Bug description
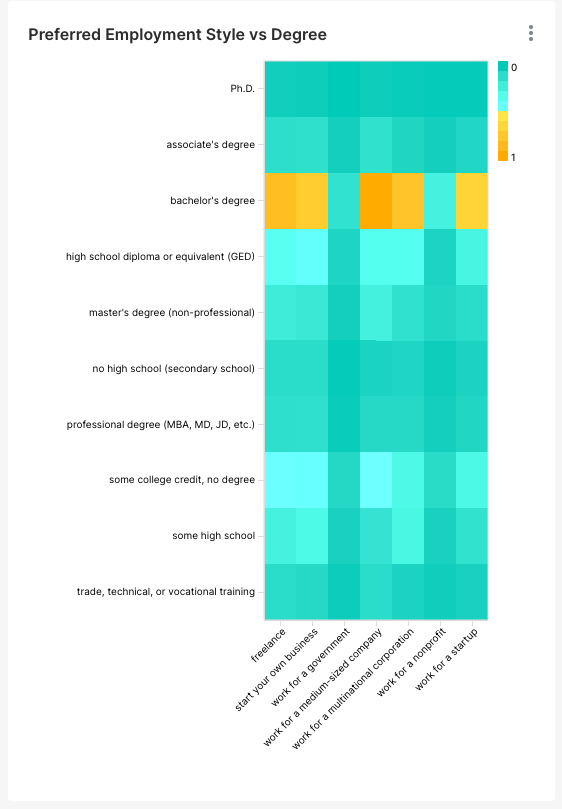
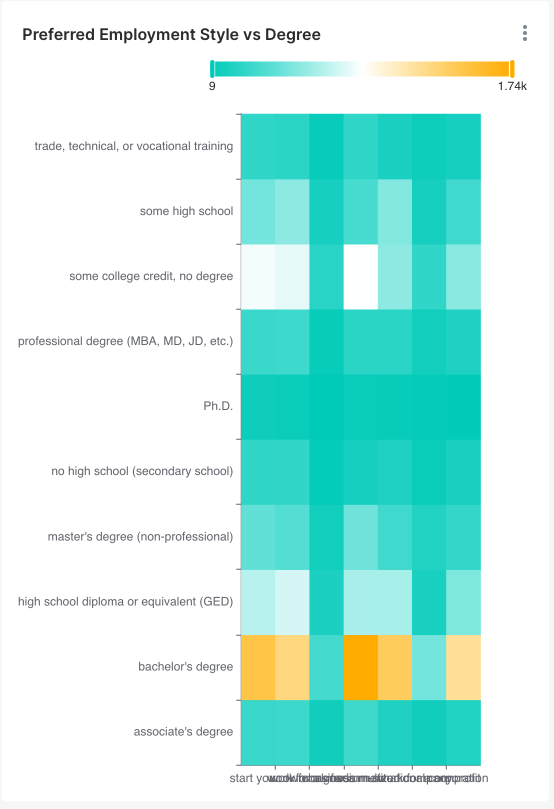
On the legacy heatmap, the x axis labels would be at an angle to not overlap. On the new ECharts Heatmap, the labels overlap (see screenshots below)
How to reproduce the bug
- Create a Heatmap chart with the new ECharts Heatmap with a dataset with longer labels
- (Optional) Add the chart to a dashboard and adjust the width to see the chart overlaps)
Screenshots/recordings
On the same dashboard with the same width:
Legacy Heatmap:
New Heatmap:
Superset version
master / latest-dev
Python version
3.9
Node version
16
Browser
Chrome
Additional context
No response
Checklist
- [X] I have searched Superset docs and Slack and didn't find a solution to my problem.
- [X] I have searched the GitHub issue tracker and didn't find a similar bug report.
- [X] I have checked Superset's logs for errors and if I found a relevant Python stacktrace, I included it here as text in the "additional context" section.
Comment From: yousoph
@michael-s-molina I don't think the Legacy heatmap had a control to change the labels, I believe they just adjusted automatically. Do you know if that would be possible with the new heatmap as well?
Comment From: michael-s-molina
@yousoph I'm not sure if ECharts offers the same behavior out of the box but I'm sure it could be implemented or at least use a different strategy such as hiding overlapped labels.
Comment From: rusackas
ECharts definitely offers rotation, but I'm not sure if it supports automatic rotation.
Comment From: alberk8
Need an option to rotate the x-axis label.
Comment From: bluespring2812
Is there any way to rotate the x-lable using CSS or JSON metadata @michael-s-molina @rusackas ? I'm struggling with this issue
Comment From: rusackas
I don't think so, but we'd be open to a PR adding a control input for rotating the labels (other charts already support this)
Comment From: rusackas
Anyone here is welcome to open a PR, but this one seems otherwise at risk of becoming inactive/not-planned.
Comment From: alesnav
Thank you @SBIN2010 !!
@rusackas , could you check the PR https://github.com/apache/superset/pull/34239 ? Seems a quite straightforward modification :smile: