Proposal Details
Runtime traces don't contain (or display) an absolute timestamp for events. This would be useful for comparing traces with other (tracing) tools, logs et cetera.
An example would be combining a Go runtime trace with perf sched events. This would allow better investigation of kernel scheduling events and how they impact the latency of goroutines.
IIRC, runtime traces currently use a relative (monotonic) timestamps for performance reasons. It's fine to keep this as-is. But it would be helpful if (e.g.) the start of a trace batch could contain an absolute system time (perhaps something lie nanoseconds since the UNIX epoch) together with the relative timestamp it was derived from. Tools like go tool trace could then adjust all the relative timestamps post-hoc, or at least display the trace start and end time.
cc @mknyszek
Comment From: aktau
(I don't know if this needs to be a proposal. It's not really a noteworthy feature, as it's an optional addition and only concerns very few users of a sub-tool, please adjust accordingly.)
Comment From: prattmic
In the new trace format, we do usually store absolute (monotonic) timestamps. The start of each batch has the full absolute timestamp. Each event within the batch contains the time delta from the previous event.
The exception is Windows, where time has low resolution, so in that case we use CPU ticks (RDTSC).
cc @felixge
Comment From: aktau
That's nice. I don't know much about catapult, but could it be made to display things in absolute time?
Comment From: prattmic
In theory, I believe this field just needs to be in absolute time: https://cs.opensource.google/go/go/+/master:src/internal/trace/traceviewer/format/format.go;l=25;drc=70f4717e96cf9d8ca8a5f439d7d6487ec822ce49;bpv=1;bpt=1
The current values tend to just come from computations like https://cs.opensource.google/go/go/+/master:src/cmd/trace/goroutinegen.go;l=137;drc=70f4717e96cf9d8ca8a5f439d7d6487ec822ce49;bpv=1;bpt=1, which currently are event.Time - startTime.
The format says the time should be in microseconds. I don't know how nicely Catapult will display the values, given they will probably be huge.
Comment From: aktau
That's just reading AFAICT. I spent some time looking for writing and found traceClockNow: https://github.com/golang/go/blob/f2d118fd5f7e872804a5825ce29797f81a28b0fa/src/runtime/tracetime.go#L57-L62
nanotime is (on Linux) clock_gettime(CLOCK_MONOTONIC). Which is (quoting man7) time since boot:
CLOCK_MONOTONIC
              A nonsettable system-wide clock that represents monotonic time
              since—as described by POSIX—"some unspecified point in the
              past".  On Linux, that point corresponds to the number of sec‐
              onds that the system has been running since it was booted.

              The CLOCK_MONOTONIC clock is not affected by discontinuous
              jumps in the system time (e.g., if the system administrator
              manually changes the clock), but is affected by the incremen‐
              tal adjustments performed by [adjtime(3)](https://man7.org/linux/man-pages/man3/adjtime.3.html) and NTP.  This clock
              does not count time that the system is suspended.  All
              CLOCK_MONOTONIC variants guarantee that the time returned by
              consecutive calls will not go backwards, but successive calls
              may—depending on the architecture—return identical (not-
              increased) time values.
The absolute value can thus be calculated if we knew the time since boot. But I haven't been able to find that anywhere in a trace. Did I miss it?
Comment From: prattmic
The absolute value can thus be calculated if we knew the time since boot. But I haven't been able to find that anywhere in a trace. Did I miss it?
I think I am confused by what you mean by "absolute time". I thought that meant you wanted the CLOCK_MONOTONIC value, which we have. Do you actually mean the CLOCK_REALTIME value (wall time)? We don't record that. I don't think that would be as useful for correlation with other trace events on the machine, since the real time clock can change arbitrarily.
Comment From: aktau
Do you actually mean the CLOCK_REALTIME value (wall time)? We don't record that. I don't think that would be as useful for correlation with other trace events on the machine, since the real time clock can change arbitrarily.
For correlation with other trace events on the machine, CLOCK_MONOTONIC is fine (ideal even), if one has these events available from the same epoch (boot time in Linux's case).
In my case, I don't always:
- I'm checking metrics collected by a centralized metric system. Its timestamps use the UNIX epoch, as the metrics come from many different machines.
- I'm checking logs printed by a given task (up to millisecond accuracy). Unless the task in question printed
clock_gettime(CLOCK_MONOTONIC)somewhere, I don't have a way to line up this timestamp with trace timestamps.
Specifically, I get a crash which has exported a trace around crash time using the flight recorder. The monitoring service tells me the crash timestamp is 01:03:53 21-10-2024 UTC. I'd like to know when the trace started, and until what time before the crash it actually ran. I'd like the "when" to be absolute here, not some machine-relative timestamp.
It seems to me like this could be solved by (also) adding a timestamp relative to the UNIX epoch in every generation event. Then, tooling (go tool trace or something custom) could render all events in either a relative timeline (current default) or an absolute timeline.
That, or I'm missing something that currently exists, or a different way to correlate the data I want. Any ideas?
Comment From: prattmic
That makes sense. There is a caveat that it will probably be difficult to precisely line up events using wall time, but I agree it would be useful even just for getting a vague sense of where within logs, etc the trace occurs (within a few hundred ms).
I think including a real time timestamp in each generation would be reasonable. I think that would be sufficient. If the real time clock changes during tracing then computed timestamps may be wrong, but that should be rare.
Comment From: prattmic
(cc @mknyszek for thoughts on including a real time timestamp in each generation)
Comment From: aktau
There is a caveat that it will probably be difficult to precisely line up events using wall time, but I agree it would be useful even just for getting a vague sense of where within logs, etc the trace occurs (within a few hundred ms).
Up to a few hundred ms is much better than what's currently available. It would already help me. I wonder how easy it is to get the equivalent of time.Now().UnixNano() in the runtime...
Comment From: prattmic
runtime.walltime
Comment From: mknyszek
We could just add this as a new event type that always lives in the same batch as EvFrequency, which currently always lives in its own batch. Old toolchains won't understand it and fail, but new toolchains will still be able to understand old traces without having to interpret anything differently.
With respect to exposing this in the trace API, the easiest thing to do would be to make it a property of the Sync event type; we could then also emit a Sync event at the start of the trace so we have a place to put the information for the first generation. Sync events always precede a generation, so you can always count on having the value you need to interpret all timestamps in a given generation.
Comment From: mknyszek
I don't think this needs to be a proposal. The trace parsing API is still experimental.
Comment From: aktau
We could just add this as a new event type that always lives in the same batch as EvFrequency... With respect to exposing this in the trace API, the easiest thing to do would be to make it a property of the Sync event type.
I don't know much about this, but this sounds contradictory, unless internal trace events and trace API events are fully decoupled. In which case, SGTM.
Comment From: mknyszek
We could just add this as a new event type that always lives in the same batch as EvFrequency... With respect to exposing this in the trace API, the easiest thing to do would be to make it a property of the Sync event type.
I don't know much about this, but this sounds contradictory, unless internal trace events and trace API events are fully decoupled. In which case, SGTM.
Sorry, yes. They are completely decoupled. The Sync event type is an event type in the parsing API, the new event type would be part of the wire format.
Comment From: gopherbot
Change https://go.dev/cl/653576 mentions this issue: internal/trace: expose EvWalltime as Sync.Walltime
Comment From: gopherbot
Change https://go.dev/cl/653575 mentions this issue: runtime: emit new EvWalltime event for every trace generation
Comment From: gopherbot
Change https://go.dev/cl/653876 mentions this issue: internal/trace: add test for new walltime event
Comment From: gopherbot
Change https://go.dev/cl/653875 mentions this issue: internal/trace/internal/testgen: don't hard code trace version
Comment From: felixge
I decided to pick this up as a little thing to hack on during my vacation, and the CLs above should implement what was suggested by @mknyszek above.
Unfortunately I wasn't able to hook this up into the go tool trace viewer in a useful way. The screenshot below shows where my attempt stalled (notice the large time values on the time axis). Check the CL message for more details.
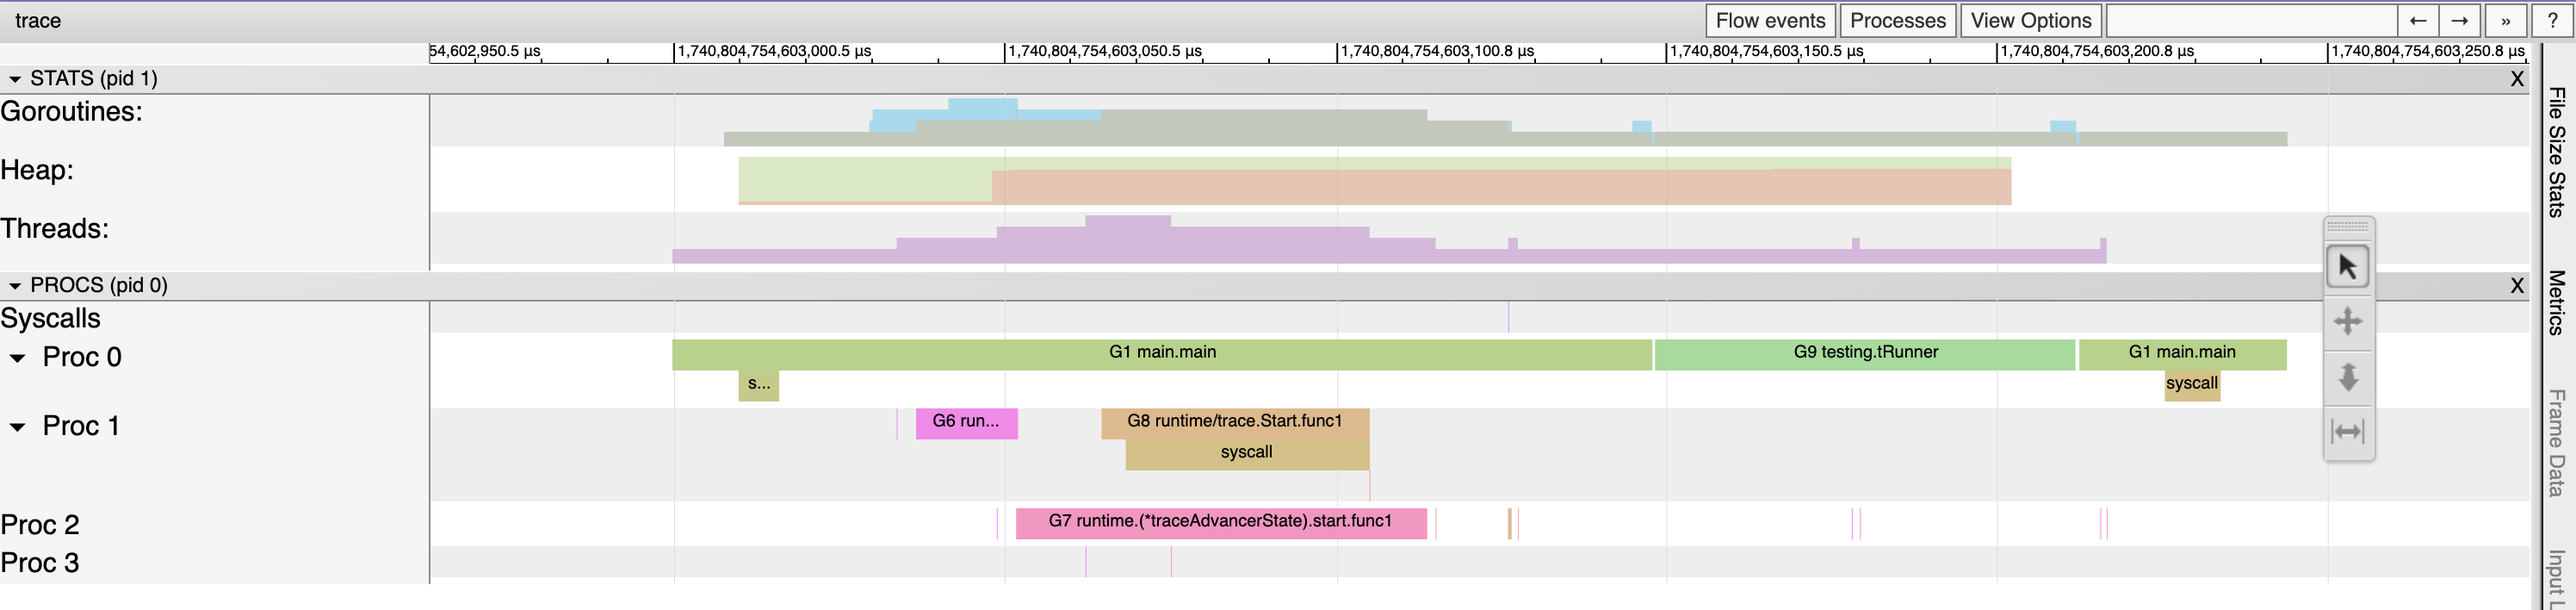
Old toolchains won't understand it and fail, but new toolchains will still be able to understand old traces without having to interpret anything differently.
Turns out I was able to keep old toolchains forward compatible. The code for parsing the frequency batch didn't check for additional events in the batch and just ignores them (rather than failing). It's a little hacky in the sense that we typically bump the trace file format version when introducing new events, but here we are introducing a new event in the existing go123 format. I think it's okay, but LMK what you think in the CLs. 🙇
Comment From: gopherbot
Change https://go.dev/cl/674476 mentions this issue: internal/trace: add generator tests for EvClockSnapshot
Comment From: aktau
Thanks a lot @felixge for working on this. It's indeed unfortunate that Catapult has no absolute timestamp viewer. I search around:
- Perfetto seems to be able to do absolute timestamps based on this screenshot.
- Spall (web viewer) doesn't appear to support it.
- ...(more generic trace viewers?)
But, having the data is already helpful for programmatic analysis. If you are using it, may I ask how?
Comment From: gopherbot
Change https://go.dev/cl/677355 mentions this issue: trace: regenerate to include CL 673116
Comment From: mknyszek
This work has landed, so I'm going to close off the issue. Thanks again @felixge!