Green Tea 🍵 Garbage Collector
Authors: Michael Knyszek, Austin Clements Updated: 2 May 2025
This issue tracks the design and implementation of the Green Tea garbage collector. As of the last update to this issue, development of Green Tea is still active. We'll produce more detailed design document once we're ready to commit to a design. For now, Green Tea is available as an experiment at tip-of-tree and is planned as to be available as an opt-in experiment in Go 1.25, once it releases. We encourage teams to try it out.
Introduction
Memory latency and bandwidth are becoming increasingly constrained as CPU clocks outpace DRAM clocks, increasing core counts offer more load on physically limited memory buses, and speed-of-light constraints necessitate increasingly non-uniform memory topologies. As a result, spatial locality, temporal locality, and topology-awareness are becoming ever more critical to high-performance systems.
Unfortunately, all of these trends are at odds with most of today’s garbage collection algorithms. Go’s garbage collector implements a classic tri-color parallel marking algorithm. This is, at its core, just a graph flood, where heap objects are nodes in the graph, and pointers are edges. However, this graph flood affords no consideration to the memory location of the objects that are being processed. As a result, it exhibits extremely poor spatial locality—jumping between completely different parts of memory—poor temporal locality—blithely spreading repeated accesses to the same memory across the GC cycle—and no concern for topology.
As a result, on average 85% of the garbage collector's time is spent in the core loop of this graph flood—the scan loop—and >35% of CPU cycles in the scan loop are spent solely stalled on memory accesses, excluding any knock-on effects. This problem is expected to only get worse as the industry trends toward many-core systems and non-uniform memory architectures.
In this document, we present Green Tea: a parallel marking algorithm that, if not memory-centric,1 is at least memory-aware, in that it endeavors to process objects close to one another together.
This new algorithm has an implementation that is ready for developers to trial on their workloads, and in this document we also present the results from evaluating this implementation against our benchmark suite. Overall, the algorithm shows a significant reduction in GC CPU costs on GC-heavy workloads.
Finally, this new marking algorithm unlocks new opportunities for future optimization, such as SIMD acceleration, which we discuss with other possible avenues of future work.
Design
The core idea behind the new parallel marking algorithm is simple. Instead of scanning individual objects, the garbage collector scans memory in much larger, contiguous blocks. The shared work queue tracks these coarse blocks instead of individual objects, and the individual objects waiting to be scanned in a block are tracked in that block itself. The core hypothesis is that while a block waits on the queue to be scanned, it will accumulate more objects to be scanned within that block, such that when a block does get dequeued, it’s likely that scanning will be able to scan more than one object in that block. This, in turn, improves locality of memory access, in addition to better amortizing per-scan costs.
Prototype implementation
In the prototype implementation of this new algorithm, the memory blocks we track are called spans. A span is always some multiple of 8 KiB, always aligned to 8 KiB, and consists entirely of objects of one size. Our prototype focuses exclusively on “small object spans”, which are exactly 8 KiB and contain objects up to 512 bytes.
A span is also the basic unit of storing heap metadata. In the prototype, each span stores two bits for each object: a gray bit and a black bit. These correspond to the tri-color abstraction: an object is black if it has been scanned, gray if it is in the queue to be scanned, and white if it has not been reached at all. In the prototype, white objects have neither bit set, gray objects have the gray bit set, and black objects have both bits set.
When scanning finds a pointer to a small object, it sets that object’s gray bit to indicate the object needs to be scanned. If the gray bit was not already set and the object’s span is not already enqueued for scanning, it enqueues the span. A per-span flag indicates whether the span is currently enqueued so it will only be enqueued once at a time. When the scan loop dequeues a span, it computes the difference between the gray bits and the black bits to identify objects to scan, copies the gray bits to the black bits, and scans any objects that had their gray bit set but not their black bit.
Limiting scope to small objects
The prototype focuses on small objects because we derive the most benefit from them. The per-scan overhead of small objects is much harder to amortize because the garbage collector spends so little time scanning each individual object. Larger objects continue to use the old algorithm.
The choice of which algorithm to use is made when scanning encounters a pointer. The span allocator maintains a bitmap with one bit for each 8 KiB page in the heap to indicate whether that page is backed by a small object span. The footprint of this fits easily into cache even for very large heaps, and contention is extremely low.
Since small object spans are always 8 KiB large and 8 KiB aligned, once the scanner knows the target of a pointer is in a small object span, it can use simple address arithmetic to find the object’s metadata within the span, thus avoiding indirections and dependent loads that seriously harm performance.
Work distribution
Go’s current garbage collector distributes work across scanners by having each scanner maintain a local fixed-sized stack of object pointers. However, in order to ensure parallelism, each scanner aggressively checks and populates global lists. This frequent mutation of the global lists is a significant source of contention in Go programs on many-core systems.
The prototype implementation has a separate queue dedicated to spans and based on the distributed work-stealing runqueues used by the goroutine scheduler. The opportunity for stealing work directly from other workers means less contention on global lists. Furthermore, by queuing spans instead of individual objects, there are far fewer items to queue and thus inherently lower contention on the queues.
Span work may be ordered several different ways. We explored several policies, including FIFO, LIFO, sparsest-first, and densest-first, random, and address-ordered. FIFO turned out to accumulate the highest average density of objects to scan on a span by the time it was dequeued for scanning.
Single-object scan optimization
If a span has only a single object to scan when it is dequeued, the new algorithm will have done more work to handle that single object than the current, object-centric algorithm does.
To bring the performance of the single-object-per-span case more in line with the current marking algorithm, we apply two tricks. First, we track the object that was marked when the span was enqueued. This object becomes the span's representative until the span is scanned. Next, we add a hit flag to the span that indicates an object was marked while the span was queued; that is, that at least two objects are marked. When scanning a span, if the hit flag is not set, then the garbage collector can directly scan the span’s representative, instead of processing the entire span.
Prototype evaluation
We evaluated the prototype implementation across a variety of benchmarks, on low-CPU-count, high-CPU-count, amd64, and arm64 Linux virtual machines. The rest of this section summarizes the results, focusing primarily on the differences in garbage collection CPU cost.
In select GC-heavy microbenchmarks (garbage, from golang.org/x/benchmarks, and binary-trees Go #2, from the Computer Language Benchmarks Game), depending on core count, we observed anywhere from a 10–50% reduction in GC CPU costs compared to the existing Go GC. The improvement generally rose with core count, indicating that the prototype scales better than the existing implementation. Furthermore, the number of L1 and L2 cache misses was reduced by half in these benchmarks.
On our bent and sweet benchmark suites, the results were more varied.
- linux/amd64 Intel Xeon Gold 6253CL Processor (Cascade Lake) (16-core VM)
- linux/amd64 Intel Xeon Platinum 8481C Processor (Sapphire Rapids) (88-core VM)
- linux/arm64 Google Axion (16-core VM)
- linux/arm64 Google Axion (72-core VM)
The results are positive overall, but include a mix of improvements and regressions.
Most benchmarks were either unaffected by the changes to the garbage collector or regressed or improved solely due to changes that had little to do with the garbage collector, such as code alignment changes. Some benchmarks regressed even though less CPU time is spent in the garbage collector. One reason for this is because the garbage collector's mark phase is active for less time, leading to less floating garbage which acts as a ballast in some benchmarks. Another reason for this is that less time spent in the garbage collector means more time spent in other scalability bottlenecks, either in the runtime or in user code, leading to a net apparent regression.
The Go compiler benchmarks appear to inconsistently show a very slight regression (0.5%). Given the magnitude and inconsistency of the regression, these benchmarks appear to be rather insensitive to this change. One hypothesis is that the occasional regression may be due to an out-of-date PGO profile, but remains to be investigated.
The tile38 benchmark shows substantial improvements across throughput, latency and memory use. In addition, it showed a 35% reduction in garbage collection overheads. This benchmark queries a local instance of a Tile38 in-memory geospatial database pre-seeded with data. Most of the heap consists of a high-fanout tree, so Green Tea is able to quickly generate large amounts of work and high densities.
The bleve-index benchmark has a heap topology that is quite difficult for Green Tea, though performance overall is a wash. Most of the heap consists of a low-fanout binary tree that is rapidly mutated by the benchmark. Green Tea struggles to generate locality in this benchmark, and half of all span scans only scan a single object. Our current hypothesis is that because of frequent tree rotations, the tree structure itself becomes shuffled across a large heap (100+ MiB). In contrast, the binary-trees benchmark does not perform rotations, so the tree layout retains the good locality of its initial allocations. This suggests that Green Tea has good locality when the application itself has good locality, unlike the current Go GC; but Green Tea, unsurprisingly, can’t create locality out of nothing. Both Linux perf and CPU profiles in the 16-core amd64 environment indicate a small \~2% regression in garbage collection overhead. Overall, the single object scan optimization was integral to making this benchmark perform well in the 16-core amd64 environment. In the 72- and 88-core environments we see a significant improvement, due to the design's improved many-core scalability. There remains a small overall regression on the 16-core arm64 environment that still needs to be investigated.
Future work
SIMD-accelerated scanning kernels
Scanning memory in larger blocks of memory unlocks the ability to apply SIMD to small objects in the garbage collector. The core idea is to generate a unique scanning kernel for each size class and use SIMD bit manipulation and permutation instructions to load, mask, swizzle, pack, and enqueue pointers. The regularity of the layout of objects in a single span and Go’s packed representation of pointer/scalar metadata for small objects both play a major role in making this feasible.
Austin Clements developed prototype AVX512-based scanning kernels that reduce garbage collection overheads by another 15–20% in the benchmarks where we already saw improvements. The prototype implementation does not currently use these kernels because they only apply to a small subset of objects at this point in time.
These SIMD kernels tend to require a higher density of objects in order to outperform sparsely scanning objects within a scan. These kernels are still being developed, so the prototype does not use them by default, and when they are enabled, it only uses SIMD scanning when a minimum density threshold is reached.
Concentrator network
Austin's original design for Green Tea used a sorting network called the concentrator network to achieve the even higher pointer density required by SIMD-based scanning, and to generate locality even for metadata operations like setting gray bits. The network was carefully designed to minimize queuing costs, so individual pointers could still be processed efficiently when sufficient scan density was unavailable.
There are two main reasons we did not pursue this direction in the short term. First, we found that even very low density can produce good results, especially with the single-object scan optimization. Second, the concentrator network is more complex to implement, as it is a greater departure from the existing algorithm. However, this design is still an avenue we plan to explore, since it is far more general and tunable.
Acknowledgements
Credit to Austin Clements for the inception of the key idea (that is, accumulating pointers on a span before scanning, which they wrote down in 2018!), initial prototyping of the concentrator network, which motivated further work, and in polishing up this text significantly.
Credit to Yves Vandriessche from Intel for providing many microarchitectural insights that were vital to making this design viable. Many of his suggestions were applied to the new core scan loop, including proper prefetching, batching subsequent pointer loads to hide their memory latency, and simpler iteration over object pointers.
Comment From: gopherbot
Change https://go.dev/cl/658036 mentions this issue: runtime: mark and scan small objects in whole spans [green tea]
Comment From: mknyszek
How to try it out
First,
go install golang.org/dl/go1.25rc1@latest
Then build your program with GOEXPERIMENT=greenteagc go1.25rc1 build.
Sending feedback
Please focus your attention on whole programs. Microbenchmarks tend to be poor representatives of garbage collection behavior in real programs. Large changes in the foundations such as these can move the needle for all sorts of reasons, unrelated to (or even inversely related to) how efficient the garbage collector actually is.
If you encounter a situation where Green Tea isn't working out for you, we'd appreciate it if you could share some details with us that would be really helpful moving forward. (This is also helpful if it is working for you.)
- The platform you're running on.
- The CPU model (or if in the cloud, the VM type) you're running your code on.
- Excerpts from stderr of your program running with
GODEBUG=gctrace=2, both with and without Green Tea. - A CPU profile of your program running with and without Green Tea.
- An execution trace capturing a few complete GC cycles, with and without Green Tea (a few seconds is usually enough).
Note: you can use GOEXPERIMENT=nogreenteagc to explicitly disable Green Tea at build time.
Please file a new GitHub issue and reference this one, or you can email me directly at mknyszek(at)golang.org.
Thank you!
Comment From: gopherbot
Change https://go.dev/cl/669655 mentions this issue: main.star: add greenteagc builders
Comment From: dominikh
~No discernible change~ Minor improvement in CPU time for Staticcheck.
CPU: AMD Ryzen 9 3950X 16-Core Processor
> ./staticcheck -debug.version | head -1
staticcheck (devel, v0.7.0-0.dev.0.20250511162810-63832850a84e)

Vanilla:
> GOEXPERIMENT=nogreenteagc go build
> go version ./staticcheck
./staticcheck: go1.25-devel_fac2ccbed3 Thu May 15 08:27:04 2025 -0700
> rm -rf ~/.cache/staticcheck/
> perf stat ./staticcheck -debug.cpuprofile=vanilla.cpu.pprof std

 Performance counter stats for './staticcheck -debug.cpuprofile=vanilla.cpu.pprof std':

        197,121.11 msec task-clock:u                     #   18.932 CPUs utilized
                 0      context-switches:u               #    0.000 /sec
                 0      cpu-migrations:u                 #    0.000 /sec
           741,678      page-faults:u                    #    3.763 K/sec
   738,518,295,442      cycles:u                         #    3.747 GHz
   124,817,958,966      stalled-cycles-frontend:u        #   16.90% frontend cycles idle
   785,988,849,431      instructions:u                   #    1.06  insn per cycle
                                                  #    0.16  stalled cycles per insn
   163,480,505,449      branches:u                       #  829.340 M/sec
     2,197,680,754      branch-misses:u                  #    1.34% of all branches

      10.411895545 seconds time elapsed

     182.959316000 seconds user
      10.483651000 seconds sys
> rm -rf ~/.cache/staticcheck
> ./staticcheck -debug.trace=vanilla.trace std # trace collected separately
> rm -rf ~/.cache/staticcheck
> GODEBUG=gctrace=2 ./staticcheck std 2>vanilla.gctrace # GC trace collected separately


Green tea:
> GOEXPERIMENT=greenteagc go build
> go version ./staticcheck
./staticcheck: go1.25-devel_fac2ccbed3 Thu May 15 08:27:04 2025 -0700 X:greenteagc
> rm -rf ~/.cache/staticcheck/
> perf stat ./staticcheck -debug.cpuprofile=greentea.cpu.pprof std
 Performance counter stats for './staticcheck -debug.cpuprofile=greentea.cpu.pprof std':

        193,681.28 msec task-clock:u                     #   18.553 CPUs utilized
                 0      context-switches:u               #    0.000 /sec
                 0      cpu-migrations:u                 #    0.000 /sec
           782,480      page-faults:u                    #    4.040 K/sec
   723,000,663,331      cycles:u                         #    3.733 GHz
   130,424,001,536      stalled-cycles-frontend:u        #   18.04% frontend cycles idle
   788,115,346,312      instructions:u                   #    1.09  insn per cycle
                                                  #    0.17  stalled cycles per insn
   158,001,376,147      branches:u                       #  815.780 M/sec
     2,432,170,668      branch-misses:u                  #    1.54% of all branches

      10.439577978 seconds time elapsed

     178.367421000 seconds user
      11.257257000 seconds sys
> rm -rf ~/.cache/staticcheck
> ./staticcheck -debug.trace=greentea.trace std # trace collected separately
> rm -rf ~/.cache/staticcheck
> GODEBUG=gctrace=2 ./staticcheck std 2>greentea.gctrace # GC trace collected separately
The attached files contain the CPU profiles and the gctrace output. I also have execution traces, but they span the whole execution and are ~50 MB each when compressed, which GitHub won't let me attach.
greentea.tar.gz vanilla.tar.gz
perf stat before/after courtesy of normalize-benchfmt:
             │ vanilla.bench │          greentea.bench           │
             │      sec      │    sec      vs base               │
Task-clock:u      199.3 ± 0%   194.4 ± 1%  -2.50% (p=0.000 n=10)
Wall-time         10.11 ± 0%   10.18 ± 1%  +0.74% (p=0.005 n=10)
User-time         184.9 ± 0%   178.9 ± 1%  -3.26% (p=0.000 n=10)
System-time       10.66 ± 2%   11.33 ± 3%  +6.32% (p=0.000 n=10)
geomean           44.63        44.75       +0.25%

                          │ vanilla.bench │            greentea.bench             │
                          │      val      │     val      vs base                  │
Context-switches:u           0.000 ± 0%      0.000 ± 0%        ~ (p=1.000 n=10) ¹
Cpu-migrations:u             0.000 ± 0%      0.000 ± 0%        ~ (p=1.000 n=10) ¹
Page-faults:u               796.2k ± 4%     804.4k ± 4%        ~ (p=0.579 n=10)
Cycles:u                    739.5G ± 0%     719.6G ± 1%   -2.69% (p=0.000 n=10)
Stalled-cycles-frontend:u   125.9G ± 0%     131.1G ± 0%   +4.07% (p=0.000 n=10)
Instructions:u              786.6G ± 0%     789.0G ± 0%   +0.30% (p=0.000 n=10)
Branches:u                  163.6G ± 0%     158.1G ± 0%   -3.36% (p=0.000 n=10)
Branch-misses:u             2.205G ± 0%     2.436G ± 0%  +10.48% (p=0.000 n=10)
geomean                                 ²                 +1.15%                ²
¹ all samples are equal
² summaries must be >0 to compute geomean
Comment From: mknyszek
Thanks for sharing! I think there is a win here, though it's not a massive improvement. I think there are some effects that might be masking a bigger win.
At least according to the gctrace I see less overall CPU time spent in any individual GC cycle. On average around 10-15% .
Also, here are the distributions of wall time spent in the mark phase:
$ cat greentea.gctrace | grep ^gc | cut -d ' ' -f 5 | cut -d '+' -f 2 | dist
N 152  sum 3269.07  mean 21.507  gmean 12.3254  std dev 19.7445  variance 389.844

     min 0.28
   1%ile 0.365667
   5%ile 0.9985
  25%ile 4.94167
  median 16.5
  75%ile 29.5833
  95%ile 59.1
  99%ile 82.1533
     max 101

⠀⠀⠀⠀⠀⠀⠀⠀⢀⡴⠒⠒⠢⣄⠀⠀⠀⠀⠀⠀⠀⠀⠀⠀⠀⠀⠀⠀⠀⠀⠀⠀⠀⠀⠀⠀⠀⠀⠀⠀⠀⠀⠀⠀⠀⠀⠀⠀⠀⠀⠀⠀⠀⠀⠀⠀⠀⠀⠀⠀⠀⠀⠀⠀⠀⠀⠀⠀⠀⠀⡖ 0.036
⠀⠀⠀⠀⠀⠀⠀⡰⠋⠀⠀⠀⠀⠈⠓⠒⠒⠤⠒⠒⠒⠒⠒⠦⢤⣀⠀⠀⠀⠀⠀⠀⠀⠀⠀⠀⠀⠀⠀⠀⠀⠀⠀⠀⠀⠀⠀⠀⠀⠀⠀⠀⠀⠀⠀⠀⠀⠀⠀⠀⠀⠀⠀⠀⠀⠀⠀⠀⠀⠀⡇
⠠⠤⠤⠤⠤⠤⠞⠀⠀⠀⠀⠀⠀⠀⠀⠀⠀⠀⠀⠀⠀⠀⠀⠀⠀⠈⠉⠉⠙⠒⠒⠒⠒⠒⠒⠒⠒⠒⠒⠋⠉⠉⠙⠒⠒⠦⠤⠤⠤⠤⠤⠤⠤⠤⠤⠤⠤⠤⠤⠤⠤⠤⠤⠤⠤⠤⠤⠤⠤⠄⠧ 0.000
⠈⠉⠉⠉⠉⠉⠉⠉⠙⠉⠉⠉⠉⠉⠉⠉⠉⠉⠉⠉⠉⠉⠉⠉⠉⠉⠉⠉⠉⠉⠉⠉⠉⠉⠉⠉⠙⠉⠉⠉⠉⠉⠉⠉⠉⠉⠉⠉⠉⠉⠉⠉⠉⠉⠉⠉⠉⠉⠉⠉⠉⠉⠉⠉⠙⠉⠉⠉⠉⠁
        0                          50                          100
$ cat vanilla.gctrace | grep ^gc | cut -d ' ' -f 5 | cut -d '+' -f 2 | dist
N 139  sum 3502.72  mean 25.1994  gmean 15.1408  std dev 20.7032  variance 428.621

     min 0.28
   1%ile 0.3018
   5%ile 1.13
  25%ile 6.28333
  median 21
  75%ile 36.6667
  95%ile 66.4
  99%ile 80.2733
     max 81

⠀⠀⠀⠀⠀⠀⠀⠀⠀⢀⡤⠒⠒⠒⠲⢤⣀⠀⠀⠀⠀⠀⠀⠀⣀⣀⣀⠀⠀⠀⠀⠀⠀⠀⠀⠀⠀⠀⠀⠀⠀⠀⠀⠀⠀⠀⠀⠀⠀⠀⠀⠀⠀⠀⠀⠀⠀⠀⠀⠀⠀⠀⠀⠀⠀⠀⠀⠀⠀⠀⡖ 0.028
⠀⠀⠀⠀⠀⠀⠀⣠⠔⠁⠀⠀⠀⠀⠀⠀⠈⠓⠒⠒⠊⠉⠉⠉⠁⠀⠈⠉⠙⠒⠦⢤⣀⡀⠀⠀⠀⠀⠀⠀⠀⢀⣀⠀⠀⠀⠀⠀⠀⠀⠀⠀⠀⠀⠀⠀⠀⠀⠀⠀⠀⠀⠀⠀⠀⠀⠀⠀⠀⠀⡇
⠠⠤⠤⠤⠤⠤⠚⠁⠀⠀⠀⠀⠀⠀⠀⠀⠀⠀⠀⠀⠀⠀⠀⠀⠀⠀⠀⠀⠀⠀⠀⠀⠀⠉⠉⠉⠉⠉⠉⠉⠉⠁⠈⠉⠉⠉⠉⠉⠉⠉⠉⠒⠒⠒⠒⠒⠒⠢⠤⠤⠤⠤⠤⠤⠤⠤⠤⠤⠤⠄⠧ 0.000
⠈⠉⠉⠉⠉⠉⠉⠉⠉⠋⠉⠉⠉⠉⠉⠉⠉⠉⠉⠉⠉⠉⠉⠉⠉⠉⠉⠉⠉⠉⠉⠉⠉⠉⠉⠉⠉⠉⠉⠉⠉⠉⠋⠉⠉⠉⠉⠉⠉⠉⠉⠉⠉⠉⠉⠉⠉⠉⠉⠉⠉⠉⠉⠉⠉⠉⠉⠉⠉⠁
         0
Simultaneously, because each GC cycle is shorter, there's less floating garbage, leading to a smaller live heap. This means for the same amount of allocation work, we're going to have more GC cycles, if GOGC is constant (which it is here). Proof of that is in the fact that with Green Tea there are 152 GC cycles, whereas the original GC only executes 139 cycles. Despite this increase in the number of cycles, the CPU profile suggests that around 10% less time is spent in the garbage collector.
Here are the heap size distributions:
$ cat greentea.gctrace | grep ^gc | cut -d ' ' -f 11 | sed 's/->/\./g' | cut -d '.' -f 2 | dist
N 152  sum 78714  mean 517.855  gmean 295.01  std dev 441.656  variance 195060

     min 3
   1%ile 4.71333
   5%ile 23.85
  25%ile 118.167
  median 425
  75%ile 746.583
  95%ile 1422.05
  99%ile 1576.32
     max 1644

⠀⠀⠀⠀⠀⠀⠀⠀⠀⢀⡤⠒⠒⠒⠲⢄⡀⠀⠀⠀⠀⠀⠀⠀⠀⠀⠀⠀⠀⠀⠀⠀⠀⠀⠀⠀⠀⠀⠀⠀⠀⠀⠀⠀⠀⠀⠀⠀⠀⠀⠀⠀⠀⠀⠀⠀⠀⠀⠀⠀⠀⠀⠀⠀⠀⠀⠀⠀⠀⠀⡖ 0.001
⠀⠀⠀⠀⠀⠀⠀⣠⠔⠁⠀⠀⠀⠀⠀⠀⠙⠒⠦⠤⠤⠖⠒⠋⠉⠉⠉⠓⠒⠒⠒⠲⠤⠤⠤⣄⣀⡀⠀⠀⠀⠀⠀⠀⠀⠀⠀⠀⠀⠀⠀⠀⠀⠀⠀⠀⠀⠀⠀⠀⠀⠀⠀⠀⠀⠀⠀⠀⠀⠀⡇
⠠⠤⠤⠤⠤⠴⠊⠁⠀⠀⠀⠀⠀⠀⠀⠀⠀⠀⠀⠀⠀⠀⠀⠀⠀⠀⠀⠀⠀⠀⠀⠀⠀⠀⠀⠀⠀⠉⠉⠙⠒⠒⠒⠒⠒⠒⠒⠒⠒⠒⠒⠚⠉⠉⠉⠉⠉⠉⠙⠒⠒⠢⠤⠤⠤⠤⠤⠤⠤⠄⠧ 0.000
⠈⠉⠉⠉⠉⠉⠉⠉⠉⠙⠉⠉⠉⠉⠉⠉⠉⠉⠉⠉⠉⠉⠉⠉⠉⠉⠉⠉⠉⠉⠉⠉⠉⠉⠉⠉⠉⠉⠉⠉⠉⠉⠙⠉⠉⠉⠉⠉⠉⠉⠉⠉⠉⠉⠉⠉⠉⠉⠉⠉⠉⠉⠉⠉⠉⠉⠉⠉⠉⠁
         0                              1000
$ cat vanilla.gctrace | grep ^gc | cut -d ' ' -f 11 | sed 's/->/\./g' | cut -d '.' -f 2 | dist
N 139  sum 77043  mean 554.266  gmean 314.515  std dev 450.016  variance 202514

     min 3
   1%ile 4.45333
   5%ile 22
  25%ile 124.333
  median 504
  75%ile 820.833
  95%ile 1492.1
  99%ile 1602.14
     max 1661

⠀⠀⠀⠀⠀⠀⠀⠀⠀⣀⠴⠒⠒⠒⠦⣄⠀⠀⠀⠀⠀⠀⠀⢀⣀⣀⣀⣀⠀⠀⠀⠀⠀⠀⠀⠀⠀⠀⠀⠀⠀⠀⠀⠀⠀⠀⠀⠀⠀⠀⠀⠀⠀⠀⠀⠀⠀⠀⠀⠀⠀⠀⠀⠀⠀⠀⠀⠀⠀⠀⡖ 0.001
⠀⠀⠀⠀⠀⠀⠀⣠⠞⠁⠀⠀⠀⠀⠀⠈⠑⠦⠤⠤⠤⠖⠋⠉⠀⠀⠀⠈⠉⠉⠙⠒⠦⠤⠤⢤⣀⣀⣀⡀⠀⣀⣀⣀⣀⡀⠀⠀⠀⠀⠀⠀⠀⠀⠀⠀⠀⠀⠀⠀⠀⠀⠀⠀⠀⠀⠀⠀⠀⠀⡇
⠠⠤⠤⠤⠤⠴⠊⠀⠀⠀⠀⠀⠀⠀⠀⠀⠀⠀⠀⠀⠀⠀⠀⠀⠀⠀⠀⠀⠀⠀⠀⠀⠀⠀⠀⠀⠀⠀⠀⠉⠉⠁⠀⠀⠀⠈⠉⠉⠉⠒⠒⠒⠒⠒⠚⠉⠉⠉⠉⠙⠒⠒⠒⠤⠤⠤⠤⠤⠤⠄⠧ 0.000
⠈⠉⠉⠉⠉⠉⠉⠉⠉⠙⠉⠉⠉⠉⠉⠉⠉⠉⠉⠉⠉⠉⠉⠉⠉⠉⠉⠉⠉⠉⠉⠉⠉⠉⠉⠉⠉⠉⠉⠉⠉⠙⠉⠉⠉⠉⠉⠉⠉⠉⠉⠉⠉⠉⠉⠉⠉⠉⠉⠉⠉⠉⠉⠉⠉⠉⠉⠉⠉⠁
As for why this isn't improving overall end-to-end time much, I suspect that:
1. The garbage collector is just not on the critical path. Does staticcheck run in parallel or is it mostly a single goroutine?
2. The increase in the number of GC cycles from a reduction in memory is eroding some of the CPU win.
(I could probably analyze this more efficiently if I just made a tool to parse gctraces... I've been doing quite a lot of this lately. 😅)
Comment From: dominikh
The garbage collector is just not on the critical path. Does staticcheck run in parallel or is it mostly a single goroutine?
The actual analysis phase of Staticcheck tries to use GOMAXPROCS goroutines at once, parallelizing on packages as well as individual analyzers per package.
I've updated my original comment with a proper comparison of before and after perf stat. Maybe that can help shed some more light. The increase in system time surprises me.
Comment From: mknyszek
The increase in system time might be related to the use of a runtime.mutex for the global span list. I tried to swap that out with a lock-free stack (and a lock-free stack of blocks of spans, not coalesced) and it actually scaled significantly worse. With a lock, we can amortize the lock's use over several spans (we try to almost never take just one off the list once we get the lock) whereas a lock-free stack requires an atomic operation for each span we want to take off the list. I'm not quite sure how to confirm this. (It's possibly also a second-order effect from (apparently) having a little less GC pressure. Maybe there's some other system resource that staticcheck relies on that's now hammered slightly harder. Like a kernel lock or something.)
As an aside, there may be a more clever lock-free data structure we could use that would allow us to take many spans off the global list at once, but it's probably going to be quite complicated.
I also checked out the new scan stats I added and based on that, Green Tea's core hypothesis does seem to apply to staticcheck, which is good. A dozen or two objects are scanned on every span scan, which is not bad.
Comment From: mxmauro
Hi, will the new GC implement a method to remove/re-add an object completely from the allocated objects list?
Of course may introduce memory leaks if the developer does not take care but would be useful when a large amount of objects are allocated like an in-memory key/value storage where the value is not a slice of bytes.
If I'm right, the experimental arena feature was abandoned.
Comment From: mknyszek
Hi, will the new GC implement a method to remove/re-add an object completely from the allocated objects list?
No, that's out of scope. This is just changing the implementation, not adding any user-visible APIs.
Of course may introduce memory leaks if the developer does not take care but would be useful when a large amount of objects are allocated like an in-memory key/value storage where the value is not a slice of bytes.
If the value contains any pointers, the garbage collector must observe it to prevent a bad free. It's worse than just a memory leak in that case, it's potential memory corruption.
If I'm right, the experimental arena feature was abandoned.
You may be interested in the discussion of memory regions, which is more likely to be the successor of the arenas experiment. See https://github.com/golang/go/discussions/70257.
Comment From: mknyszek
With the release of Go 1.25 RC1, it should be substantially easier to try out Green Tea, since a tip toolchain is no longer needed. I updated the comment containing the instructions above.
As before, please try it out!
Comment From: DeedleFake
@mknyszek
The new instructions are not working for me. If I just set GOTOOLCHAIN and then run go version, I get go version go1.25rc1 linux/amd64, but if I set GOEXPERIMENT=greenteagc, I get
panic: runtime error: invalid memory address or nil pointer dereference
[signal SIGSEGV: segmentation violation code=0x1 addr=0x3 pc=0x81a081]

goroutine 1 [running]:
cmd/go/internal/fips140.Init()
    cmd/go/internal/fips140/fips140.go:117 +0x101
cmd/go/internal/modload.Init()
    cmd/go/internal/modload/init.go:419 +0x33
cmd/go/internal/toolchain.Exec({0xc0000261bc, 0x9})
    cmd/go/internal/toolchain/select.go:356 +0x3fc
cmd/go/internal/toolchain.Select()
    cmd/go/internal/toolchain/select.go:284 +0x11a5
main.main()
    cmd/go/main.go:107 +0x4f
This doesn't seem to be something specific to GOEXPERIMENT=greenteagc. I also get the exact same crash with GOEXPERIMENT=jsonv2. The go command just crashes immediately regardless of arguments. The value of GOTOOLCHAIN doesn't seem to matter, either, as long as it's a valid version. If GOTOOLCHAIN is set to a valid version and GOEXPERIMENT is set to anything at all, running the go command instantly crashes with the above.
For context, I'm on Arch and have Go installed via the go package.
Comment From: prattmic
Oops, that looks like a bug in cmd/go (in your installed version, not 1.25rc1) where it crashes if there is a GOEXPERIMENT the installed version doesn't know about before it switches to the new toolchain. I'll file an issue shortly.
As a workaround, it should work to go install golang.org/dl/go1.25rc1@latest and then use GOEXPERIMENT=greentea go1.25rc1 build.
Comment From: prattmic
Filed #74111.
Comment From: mknyszek
Ugh, my apologies. I ran the command in the instructions myself, but with a toolchain that understood the GOEXPERIMENT. I will fix up the instructions. Thanks for reporting so promptly! Thank you also to @prattmic for quickly filing a bug and figuring out the problem.
Comment From: introspection3
Hello everyone, when do you think this gc can be officially put into golang as a formal prod environment? @mknyszek
Comment From: bep
Our prototype focuses exclusively on “small object spans”, which are exactly 8 KiB and contain objects up to 512 bytes.
I have tested this new collector on a case with "big objects" that shows a significant regression, so I'm not sure if this is something that's known and being worked on, but I thought I'd report it just in case.
many-big-json-in-assets is a Hugo project I created a while ago to test a new "dynamic LRU cache" implementation.1 It basically reads many big JSON files into a Go map. Running with go1.25rc1:
Output below comes from a MacBook M1 Pro 32GB.
greenteagc disabled
~/d/s/h/many-big-json-in-assets ❯❯❯ nohugogreenteagc env                                                               main
hugo v0.148.0-DEV-4217fee4b0455dac0c711708afb27c6506fa3339 darwin/arm64 BuildDate=2025-06-09T09:44:13Z
GOOS="darwin"
GOARCH="arm64"
GOVERSION="go1.25rc1"
github.com/sass/dart-sass/protocol="3.1.0"
github.com/sass/dart-sass/compiler="1.81.0"
github.com/sass/dart-sass/implementation="1.81.0"

~/d/s/h/many-big-json-in-assets ❯❯❯ time HUGO_MEMORYLIMIT=8 nohugogreenteagc --logLevel info       main ⬆ ⬇ ✖ ✱ ◼
Start building sites …
hugo v0.148.0-DEV-4217fee4b0455dac0c711708afb27c6506fa3339 darwin/arm64 BuildDate=2025-06-09T09:44:13Z

INFO  build:  step process substep collect files 2000 files_total 2000 pages_total 2000 resources_total 0 duration 65.761333ms
INFO  build:  step process duration 65.8265ms
INFO  build:  step assemble duration 24.065ms
INFO  dynacache: adjusted partitions' max size evicted 956 numGC 22 limit 8.00 GB alloc 13.56 GB totalAlloc 18.40 GB
INFO  dynacache: adjusted partitions' max size evicted 4171 numGC 22 limit 8.00 GB alloc 18.25 GB totalAlloc 25.33 GB
INFO  build:  step render substep pages site en outputFormat html duration 36.802299917s
INFO  build:  step render substep pages site en outputFormat rss duration 226.391375ms
INFO  build:  step render pages 2003 content 2000 duration 37.032966792s
INFO  build:  step render deferred count 0 duration 1.792µs
INFO  build:  step postProcess duration 212.333µs
INFO  build:  duration 37.123888042s

                  │  EN
──────────────────┼──────
 Pages            │ 2003
 Paginator pages  │    0
 Non-page files   │    0
 Static files     │    0
 Processed images │    0
 Aliases          │    0
 Cleaned          │    0

Total in 37141 ms
HUGO_MEMORYLIMIT=8 nohugogreenteagc --logLevel info  156.74s user 63.40s system 567% cpu 38.792 total
greenteagc enabled
 hugogreenteagc  env                                                                main
hugo v0.148.0-DEV-4217fee4b0455dac0c711708afb27c6506fa3339 darwin/arm64 BuildDate=2025-06-09T09:44:13Z
GOOS="darwin"
GOARCH="arm64"
GOVERSION="go1.25rc1 X:greenteagc"
github.com/sass/dart-sass/protocol="3.1.0"
github.com/sass/dart-sass/compiler="1.81.0"
github.com/sass/dart-sass/implementation="1.81.0"

~/d/s/h/many-big-json-in-assets ❯❯❯ time HUGO_MEMORYLIMIT=8 hugogreenteagc --logLevel info                   main
Start building sites …
hugo v0.148.0-DEV-4217fee4b0455dac0c711708afb27c6506fa3339 darwin/arm64 BuildDate=2025-06-09T09:44:13Z

INFO  build:  step process substep collect files 2000 files_total 2000 pages_total 2000 resources_total 0 duration 70.020208ms
INFO  build:  step process duration 70.332041ms
INFO  build:  step assemble duration 25.223333ms
INFO  dynacache: adjusted partitions' max size evicted 956 numGC 22 limit 8.00 GB alloc 13.48 GB totalAlloc 21.83 GB
INFO  dynacache: adjusted partitions' max size evicted 4563 numGC 22 limit 8.00 GB alloc 20.40 GB totalAlloc 28.81 GB
INFO  dynacache: adjusted partitions' max size evicted 316 numGC 26 limit 8.00 GB alloc 8.62 GB totalAlloc 65.96 GB
INFO  build:  step render substep pages site en outputFormat html duration 1m9.976262208s
INFO  build:  step render substep pages site en outputFormat rss duration 485.931166ms
INFO  build:  step render pages 2003 content 2000 duration 1m10.465748584s
INFO  build:  step render deferred count 0 duration 2.167µs
INFO  build:  step postProcess duration 38.583µs
INFO  build:  duration 1m10.56192575s

                  │  EN
──────────────────┼──────
 Pages            │ 2003
 Paginator pages  │    0
 Non-page files   │    0
 Static files     │    0
 Processed images │    0
 Aliases          │    0
 Cleaned          │    0

Total in 70586 ms
HUGO_MEMORYLIMIT=8 hugogreenteagc --logLevel info  146.87s user 171.52s system 438% cpu 1:12.63 total
There are instructions on how to run this yourself in many-big-json-in-assets.
Also note that Hugo has some hidden flags that may be useful in this context:
--profile-cpu=<filename>--profile-mem=<filename>--profile-mutex=<filename>
Comment From: mknyszek
@bep A regression that large is very unlikely to be the result of the garbage collector becoming wildly slow. Plus, the large object scanning path hasn't changed at all, so if your heap is mostly dominated by large pointer-ful things, it won't make a difference. ~The memory limit bits here seem fishy to me. "alloc" in your reported numbers is much higher than limit both before and after. I do not know exactly what that number is referring to (this is one reason I requested a specific list of diagnostics in the instructions, since I know what all the numbers mean in those diagnostics) but if it's the allocated heap size, then I would argue this is a misconfigured program. Green Tea might use slightly more memory for small objects, and it's possible the change is just pushing you further into "the GC is running continuously because the memory limit is too low" territory.~ EDIT: AFAICT, the memory limit doesn't have anything to do with GOMEMLIMIT, so my assumption here was wrong. Apologies for the noise.
I'll take a look, but at face value, I would not extrapolate the performance of Green Tea from this example alone.
Thank you for taking the time to try it out! I'll post a more detailed analysis soon.
Comment From: mknyszek
Hello everyone, when do you think this gc can be officially put into golang as a formal prod environment? @mknyszek
It's an experiment that's part of an upcoming official release (Go 1.25). If there are no significant blockers, the goal is for it to become the default in Go 1.26.
If you're wondering whether it's solid enough to try in production, I would say yes, it is, and I encourage teams to try it out. It has been running smoothly in CI for over a month now and has been tested against Google's extensive internal test suite without any complicating or worrying factors.
Comment From: mknyszek
@bep A regression that large is very unlikely to be the result of the garbage collector becoming wildly slow. Plus, the large object scanning path hasn't changed at all, so if your heap is mostly dominated by large pointer-ful things, it won't make a difference. ~The memory limit bits here seem fishy to me. "alloc" in your reported numbers is much higher than limit both before and after. I do not know exactly what that number is referring to (this is one reason I requested a specific list of diagnostics in the instructions, since I know what all the numbers mean in those diagnostics) but if it's the allocated heap size, then I would argue this is a misconfigured program. Green Tea might use slightly more memory for small objects, and it's possible the change is just pushing you further into "the GC is running continuously because the memory limit is too low" territory.~ EDIT: AFAICT, the memory limit doesn't have anything to do with
GOMEMLIMIT, so my assumption here was wrong. Apologies for the noise.I'll take a look, but at face value, I would not extrapolate the performance of Green Tea from this example alone.
Thank you for taking the time to try it out! I'll post a more detailed analysis soon.
Yeah OK, so the GC itself does seem to be faster, but there's a regression with, AFAICT, how much zeroing is performed? I'm still digging into it, but this may just be a small mistake. I'll see where it leads. EDIT: See the next comment for details. It's probably not a mistake causing things to get zeroed when they shouldn't.
Again, thank you @bep for reporting! This feedback is very helpful. Apologies for my initial reply being a bit blunt -- I'd immediately entered 'analysis mode'. 😅
Comment From: mknyszek
@bep Here's some more data.
gctrace without Green Tea:
gc 1 @0.005s 0%: 0.016+0.59+0.042 ms clock, 1.0+0.11/0.89/0+2.7 ms cpu, 4->4->1 MB, 4 MB goal, 0 MB stacks, 0 MB globals, 64 P
gc 2 @0.007s 1%: 0.017+0.71+0.099 ms clock, 1.1+0.10/0.99/0+6.3 ms cpu, 3->4->1 MB, 4 MB goal, 0 MB stacks, 0 MB globals, 64 P
gc 3 @0.011s 2%: 0.037+0.86+0.14 ms clock, 2.4+0.14/1.2/0.010+9.2 ms cpu, 3->3->1 MB, 4 MB goal, 0 MB stacks, 0 MB globals, 64 P
gc 4 @0.018s 2%: 0.051+0.90+0.096 ms clock, 3.2+0.12/1.6/0.028+6.1 ms cpu, 3->3->1 MB, 4 MB goal, 0 MB stacks, 0 MB globals, 64 P
gc 5 @0.022s 2%: 0.042+0.91+0.079 ms clock, 2.7+0.083/1.9/0.001+5.0 ms cpu, 3->3->2 MB, 4 MB goal, 0 MB stacks, 0 MB globals, 64 P
gc 6 @0.029s 2%: 0.26+0.95+0.064 ms clock, 16+0.082/3.2/0+4.0 ms cpu, 5->6->4 MB, 5 MB goal, 0 MB stacks, 0 MB globals, 64 P
gc 7 @0.041s 2%: 0.044+1.2+0.18 ms clock, 2.8+0.11/8.6/0+11 ms cpu, 8->8->6 MB, 9 MB goal, 0 MB stacks, 0 MB globals, 64 P
gc 8 @0.063s 2%: 0.33+2.6+0.23 ms clock, 21+0.063/15/0+14 ms cpu, 13->14->8 MB, 13 MB goal, 0 MB stacks, 0 MB globals, 64 P
gc 9 @0.072s 3%: 0.43+5.0+0.39 ms clock, 27+1.6/34/0+25 ms cpu, 17->19->12 MB, 18 MB goal, 0 MB stacks, 0 MB globals, 64 P
gc 10 @0.086s 5%: 0.89+3.9+0.38 ms clock, 57+2.9/46/9.6+24 ms cpu, 23->24->15 MB, 26 MB goal, 0 MB stacks, 0 MB globals, 64 P
gc 11 @0.132s 4%: 0.058+4.3+0.11 ms clock, 3.7+0.13/56/39+7.1 ms cpu, 28->28->20 MB, 32 MB goal, 0 MB stacks, 0 MB globals, 64 P
gc 12 @0.155s 5%: 2.4+4.9+0.023 ms clock, 157+14/50/1.8+1.4 ms cpu, 37->48->35 MB, 42 MB goal, 0 MB stacks, 0 MB globals, 64 P
gc 13 @0.166s 6%: 1.6+5.1+0.032 ms clock, 105+28/52/0.58+2.0 ms cpu, 61->77->49 MB, 71 MB goal, 0 MB stacks, 0 MB globals, 64 P
gc 14 @0.176s 6%: 0.83+10+0.29 ms clock, 53+28/42/0.14+18 ms cpu, 92->171->128 MB, 107 MB goal, 0 MB stacks, 0 MB globals, 64 P
gc 15 @0.192s 7%: 1.6+5.9+0.38 ms clock, 104+26/50/0.013+24 ms cpu, 219->281->141 MB, 257 MB goal, 0 MB stacks, 0 MB globals, 64 P
gc 16 @0.204s 7%: 1.5+9.1+0.92 ms clock, 97+20/44/0+58 ms cpu, 251->378->249 MB, 287 MB goal, 0 MB stacks, 0 MB globals, 64 P
gc 17 @0.224s 8%: 2.0+17+2.0 ms clock, 132+0.31/99/0.76+131 ms cpu, 428->571->321 MB, 500 MB goal, 0 MB stacks, 0 MB globals, 64 P
gc 18 @0.262s 8%: 1.5+37+2.2 ms clock, 97+0/241/9.9+141 ms cpu, 549->690->455 MB, 645 MB goal, 0 MB stacks, 0 MB globals, 64 P
gc 19 @0.354s 9%: 1.8+61+2.7 ms clock, 120+0/882/0.20+177 ms cpu, 776->1137->1057 MB, 912 MB goal, 0 MB stacks, 0 MB globals, 64 P
gc 20 @0.529s 10%: 1.5+189+3.9 ms clock, 98+77/1935/34+255 ms cpu, 1815->2925->2399 MB, 2115 MB goal, 0 MB stacks, 0 MB globals, 64 P
gc 21 @0.955s 12%: 2.0+282+2.8 ms clock, 133+489/4364/0+179 ms cpu, 4088->5595->4131 MB, 4800 MB goal, 0 MB stacks, 0 MB globals, 64 P
gc 22 @1.621s 14%: 1.9+441+2.9 ms clock, 122+2267/6687/0+188 ms cpu, 7039->9565->7301 MB, 8265 MB goal, 0 MB stacks, 0 MB globals, 64 P
gc 23 @2.791s 15%: 1.8+816+2.4 ms clock, 120+4808/11935/17+157 ms cpu, 12435->16992->13070 MB, 14603 MB goal, 0 MB stacks, 0 MB globals, 64 P
gc 24 @4.861s 16%: 2.7+1088+0.22 ms clock, 174+10203/17338/0.23+14 ms cpu, 22263->28569->20030 MB, 26141 MB goal, 0 MB stacks, 0 MB globals, 64 P
gc 25 @7.744s 13%: 1.7+212+0.10 ms clock, 114+2611/3379/0.77+6.8 ms cpu, 34117->35359->4336 MB, 40061 MB goal, 0 MB stacks, 0 MB globals, 64 P
gc 26 @10.501s 11%: 1.2+196+0.099 ms clock, 78+4169/3136/3.6+6.3 ms cpu, 7387->8689->4425 MB, 8674 MB goal, 0 MB stacks, 0 MB globals, 64 P
gc 27 @10.988s 11%: 0.85+201+0.22 ms clock, 54+3789/3204/21+14 ms cpu, 7538->8788->4224 MB, 8852 MB goal, 0 MB stacks, 0 MB globals, 64 P
gc 28 @11.507s 12%: 1.8+191+0.18 ms clock, 115+3141/3041/0.31+11 ms cpu, 7204->8413->4109 MB, 8450 MB goal, 0 MB stacks, 0 MB globals, 64 P
gc 29 @12.011s 12%: 0.97+216+0.21 ms clock, 62+3827/3380/40+13 ms cpu, 7001->8312->4391 MB, 8220 MB goal, 0 MB stacks, 0 MB globals, 64 P
gc 30 @12.501s 12%: 0.62+291+0.61 ms clock, 40+2884/4629/3212+39 ms cpu, 7481->8996->6304 MB, 8783 MB goal, 0 MB stacks, 0 MB globals, 64 P
gctrace with Green Tea:
gc 1 @0.006s 1%: 0.095+1.1+0.074 ms clock, 6.1+0.12/1.3/0+4.7 ms cpu, 3->4->1 MB, 4 MB goal, 0 MB stacks, 0 MB globals, 64 P
gc 2 @0.008s 3%: 0.016+1.0+0.23 ms clock, 1.0+0.14/0.95/0+14 ms cpu, 3->4->1 MB, 4 MB goal, 0 MB stacks, 0 MB globals, 64 P
gc 3 @0.013s 3%: 0.044+0.67+0.083 ms clock, 2.8+0.14/0.98/0+5.3 ms cpu, 3->3->1 MB, 4 MB goal, 0 MB stacks, 0 MB globals, 64 P
gc 4 @0.017s 3%: 0.050+0.61+0.10 ms clock, 3.2+0.18/1.3/0+6.5 ms cpu, 3->3->1 MB, 4 MB goal, 0 MB stacks, 0 MB globals, 64 P
gc 5 @0.023s 3%: 0.039+0.73+0.24 ms clock, 2.5+0.15/1.7/0+15 ms cpu, 4->4->2 MB, 4 MB goal, 0 MB stacks, 0 MB globals, 64 P
gc 6 @0.030s 3%: 0.047+1.4+0.073 ms clock, 3.0+0.19/7.8/0+4.6 ms cpu, 4->4->3 MB, 5 MB goal, 0 MB stacks, 0 MB globals, 64 P
gc 7 @0.036s 3%: 0.030+0.80+0.070 ms clock, 1.9+0.11/3.8/0+4.4 ms cpu, 6->6->5 MB, 7 MB goal, 0 MB stacks, 0 MB globals, 64 P
gc 8 @0.062s 2%: 0.27+2.9+0.46 ms clock, 17+0.19/8.5/0+29 ms cpu, 10->12->7 MB, 10 MB goal, 0 MB stacks, 0 MB globals, 64 P
gc 9 @0.070s 3%: 0.12+2.1+0.57 ms clock, 8.1+0.025/11/0+36 ms cpu, 14->15->9 MB, 16 MB goal, 0 MB stacks, 0 MB globals, 64 P
gc 10 @0.079s 4%: 0.60+2.5+0.22 ms clock, 38+0.63/28/0+14 ms cpu, 17->19->12 MB, 20 MB goal, 0 MB stacks, 0 MB globals, 64 P
gc 11 @0.088s 5%: 0.52+4.4+1.0 ms clock, 33+0.23/24/0+67 ms cpu, 22->25->16 MB, 26 MB goal, 0 MB stacks, 0 MB globals, 64 P
gc 12 @0.131s 4%: 0.060+2.3+0.10 ms clock, 3.8+0.10/25/11+6.4 ms cpu, 30->30->21 MB, 34 MB goal, 0 MB stacks, 0 MB globals, 64 P
gc 13 @0.149s 4%: 2.5+8.1+0.091 ms clock, 160+0.30/44/0+5.8 ms cpu, 37->53->41 MB, 43 MB goal, 0 MB stacks, 0 MB globals, 64 P
gc 14 @0.171s 5%: 4.3+10+0.086 ms clock, 275+20/34/0+5.5 ms cpu, 74->85->50 MB, 84 MB goal, 0 MB stacks, 0 MB globals, 64 P
gc 15 @0.190s 6%: 0.43+3.2+0.36 ms clock, 27+16/30/1.0+23 ms cpu, 99->102->62 MB, 102 MB goal, 0 MB stacks, 0 MB globals, 64 P
gc 16 @0.197s 6%: 0.96+3.6+0.10 ms clock, 61+19/35/0+6.5 ms cpu, 110->136->89 MB, 134 MB goal, 0 MB stacks, 0 MB globals, 64 P
gc 17 @0.206s 7%: 1.5+8.0+0.37 ms clock, 101+19/39/0+23 ms cpu, 167->259->175 MB, 204 MB goal, 0 MB stacks, 0 MB globals, 64 P
gc 18 @0.222s 7%: 1.7+11+0.75 ms clock, 111+7.0/42/0+48 ms cpu, 299->422->248 MB, 352 MB goal, 0 MB stacks, 0 MB globals, 64 P
gc 19 @0.242s 7%: 2.4+9.8+2.6 ms clock, 156+0.029/42/0+171 ms cpu, 425->521->282 MB, 497 MB goal, 0 MB stacks, 0 MB globals, 64 P
gc 20 @0.272s 8%: 2.6+12+2.7 ms clock, 170+0.014/93/0+177 ms cpu, 482->527->328 MB, 566 MB goal, 0 MB stacks, 0 MB globals, 64 P
gc 21 @0.331s 7%: 1.5+81+1.8 ms clock, 100+0.35/301/0+120 ms cpu, 560->690->631 MB, 658 MB goal, 0 MB stacks, 0 MB globals, 64 P
gc 22 @0.667s 5%: 1.5+140+3.5 ms clock, 98+0.048/754/0+224 ms cpu, 1077->1333->1209 MB, 1264 MB goal, 0 MB stacks, 0 MB globals, 64 P
gc 23 @1.129s 5%: 9.8+242+5.9 ms clock, 632+10/1238/0+379 ms cpu, 2063->2754->2080 MB, 2421 MB goal, 0 MB stacks, 0 MB globals, 64 P
gc 24 @1.859s 5%: 8.2+381+6.8 ms clock, 529+15/2496/0+440 ms cpu, 3544->4476->3397 MB, 4162 MB goal, 0 MB stacks, 0 MB globals, 64 P
gc 25 @2.962s 5%: 5.5+369+4.7 ms clock, 353+33/3873/0+305 ms cpu, 5788->6526->4705 MB, 6796 MB goal, 0 MB stacks, 0 MB globals, 64 P
gc 26 @4.275s 6%: 4.6+510+5.8 ms clock, 298+21/5909/0+374 ms cpu, 8015->9084->7069 MB, 9412 MB goal, 0 MB stacks, 0 MB globals, 64 P
gc 27 @6.413s 6%: 2.7+748+4.5 ms clock, 178+26/9085/20+289 ms cpu, 12041->13439->10214 MB, 14139 MB goal, 0 MB stacks, 0 MB globals, 64 P
gc 28 @9.330s 6%: 6.6+967+2.5 ms clock, 424+50/13317/0+163 ms cpu, 17397->19249->14845 MB, 20429 MB goal, 0 MB stacks, 0 MB globals, 64 P
gc 29 @13.734s 5%: 3.4+365+5.4 ms clock, 217+50/2733/97+348 ms cpu, 25288->26017->3886 MB, 29691 MB goal, 0 MB stacks, 0 MB globals, 64 P
gc 30 @16.489s 4%: 1.0+106+0.51 ms clock, 68+2295/1667/22+33 ms cpu, 7028->7807->4092 MB, 7774 MB goal, 0 MB stacks, 0 MB globals, 64 P
gc 31 @17.009s 5%: 0.99+221+3.0 ms clock, 63+2599/3459/20+196 ms cpu, 6972->9066->7114 MB, 8186 MB goal, 0 MB stacks, 0 MB globals, 64 P
gc 32 @17.588s 5%: 1.1+424+3.0 ms clock, 76+4020/6684/16+193 ms cpu, 12121->15980->12158 MB, 14230 MB goal, 0 MB stacks, 0 MB globals, 64 P
gc 33 @18.830s 5%: 0.54+151+1.2 ms clock, 34+1427/2347/15+82 ms cpu, 20709->22037->4507 MB, 24318 MB goal, 0 MB stacks, 0 MB globals, 64 P
gc 34 @20.708s 5%: 1.2+133+1.1 ms clock, 80+1787/2094/28+73 ms cpu, 7677->9013->4484 MB, 9016 MB goal, 0 MB stacks, 0 MB globals, 64 P
gc 35 @21.291s 5%: 0.65+124+0.095 ms clock, 41+56/1972/3223+6.0 ms cpu, 7639->8056->3817 MB, 8971 MB goal, 0 MB stacks, 0 MB globals, 64 P
CPU profile without Green Tea:
Showing nodes accounting for 145.41s, 39.94% of 364.05s total
Dropped 732 nodes (cum <= 1.82s)
Showing top 10 nodes out of 150
      flat  flat%   sum%        cum   cum%
    29.16s  8.01%  8.01%     81.06s 22.27%  runtime.scanobject
    23.63s  6.49% 14.50%     46.89s 12.88%  encoding/json.checkValid
    19.05s  5.23% 19.73%     19.05s  5.23%  runtime.memclrNoHeapPointers
    15.83s  4.35% 24.08%     27.45s  7.54%  runtime.findObject
    10.67s  2.93% 27.01%     17.77s  4.88%  encoding/json.(*decodeState).rescanLiteral
    10.41s  2.86% 29.87%     11.08s  3.04%  runtime.spanOf (inline)
    10.12s  2.78% 32.65%     10.20s  2.80%  encoding/json.unquoteBytes
     9.20s  2.53% 35.18%     10.74s  2.95%  encoding/json.stateInString
     8.77s  2.41% 37.59%     15.18s  4.17%  encoding/json.stateEndValue
     8.57s  2.35% 39.94%    156.15s 42.89%  runtime.mallocgc
CPU profile with Green Tea:
Showing nodes accounting for 560.86s, 69.72% of 804.48s total
Dropped 844 nodes (cum <= 4.02s)
Showing top 10 nodes out of 124
      flat  flat%   sum%        cum   cum%
   306.87s 38.15% 38.15%    306.87s 38.15%  runtime.memclrNoHeapPointers
    76.30s  9.48% 47.63%     76.30s  9.48%  runtime.memmove
    29.34s  3.65% 51.28%     41.06s  5.10%  runtime.tryDeferToSpanScan
    26.94s  3.35% 54.63%     59.69s  7.42%  runtime.mallocgcTiny
    25.38s  3.15% 57.78%     60.28s  7.49%  runtime.scanObjectsSmall
    24.94s  3.10% 60.88%     48.96s  6.09%  encoding/json.checkValid
    24.16s  3.00% 63.88%     24.16s  3.00%  runtime.duffzero
    20.42s  2.54% 66.42%     20.42s  2.54%  internal/runtime/atomic.(*Uint64).CompareAndSwap (inline)
    14.98s  1.86% 68.28%     47.01s  5.84%  runtime.(*spanSet).pop
    11.53s  1.43% 69.72%     18.43s  2.29%  encoding/json.(*decodeState).rescanLiteral
Notes:
* The peak memory usage characteristics are wildly different, before and after. It's possible this is the root cause of the additional zeroing. With less of the heap being freshly allocated from the operating system, we're reusing memory better, but this also means much more zeroing.
* Most of the zeroing comes from zeroing the heap bits area of new small object spans and from zeroing the objects themselves.
* With Green Tea, the GC overheads seem far more stable, but there are more GC cycles. The number of cycles actually spent on garbage collection seems a lot lower, too.
* One thing that comes to mind is how the change in GC behavior is affecting the caching policy that hugo implements. If it's watching runtime metrics to make decisions, then a faster GC (leading to less floating garbage, hnce less of a ballast, etc. etc.) could lead to very different behavior, as the GC and the caching behavior effectively operate in a mutual feedback loop. Like, if hugo is much more readily dropping cache entries, that could easily lead to a lot more zeroing.
* I compared memory profiles and could not find a significant difference in total amount allocated, which runs counter to the theory that cache entries are getting dropped more frequently.
Comment From: bep
If it's watching runtime metrics to make decisions, then a faster GC (leading to less floating garbage, hnce less of a ballast, etc. etc.) could lead to very different behavior, as the GC and the caching behavior effectively operate in a mutual feedback loop. Like, if hugo is much more readily dropping cache entries, that could easily lead to a lot more zeroing.
@mknyszek thanks for looking into this. So, unmarshalling lots of JSON files into maps and then handing them over to the Go GC does not sound very uncommon, but I guess what you're saying above is that Hugo is doing this handover/zeroing in bulks (cache expiry), which I guess is less common (but not very uncommon).
Comment From: mknyszek
If it's watching runtime metrics to make decisions, then a faster GC (leading to less floating garbage, hnce less of a ballast, etc. etc.) could lead to very different behavior, as the GC and the caching behavior effectively operate in a mutual feedback loop. Like, if hugo is much more readily dropping cache entries, that could easily lead to a lot more zeroing.
@mknyszek thanks for looking into this. So, unmarshalling lots of JSON files into maps and then handing them over to the Go GC does not sound very uncommon, but I guess what you're saying above is that Hugo is doing this handover/zeroing in bulks (cache expiry), which I guess is less common (but not very uncommon).
No, I don't think unmarshalling lots of JSON files into maps is very relevant here. Even if it's happening in bulk, or all the memory is getting dropped in bulk. The GC is especially fine with dealing with the latter, with or without Green Tea (dead memory is very cheap). Yes, lots of applications do this, and ones that do do just fine with Green Tea. In fact, looking purely at the cost of the garbage collector, there's a substantial reduction in GC overheads here with Green Tea, and the GODEBUG=gctrace=2 output suggests that the Green Tea design is very effective at batching objects in this workload (80 16-byte objects scanned per span on average, 223 24-byte objects per span on average, 124 48-byte objects per span on average -- these are all great). EDIT: I also confirmed that, apples-to-apples, the same GC cycle takes around 20% less CPU time for a heap of this workload. So it's almost definitely not directly the GC.
This slowdown on the end-to-end wall time is likely a second or third order effect.
I don't think I have a conclusion yet, but what I'm trying to say with this line you quoted is that what's unusual about Hugo is that it's making decisions about liveness based on heap size metrics. The heap size is already the culmination of a feedback loop consisting of many parameters that is based on the behavior of previous cycles, and so on. This is complex in itself but is at least something I'm familiar with. For me, predicting exactly what's going to happen with GC scheduling when a program makes liveness decisions based on heap metrics is tougher. The culmination of these effects seems to be that the current GC has a ~10 GiB larger peak heap size on the same workload compared to Green Tea for this workload. My current best guess is that the ~10 GiB peak heap size difference is 10 more GiB of allocated memory that didn't come fresh from the operating system and needs to be zeroed. But that also doesn't seem like a complete answer. (EDIT: This is the point I was trying to make, but it was just a guess, and it was wrong. See below.)
Comment From: mknyszek
I've essentially ruled out the "more memory is zeroed" hypothesis. I patched in some code to count the number of zeroed bytes, and the difference is <1 GiB, or only single-digit percent.
My next lead is that sys time is up by an order of magnitude, and how much it's up (~350 CPU seconds) corresponds fairly closely with the regression in zeroing in the CPU profile. My first suspicion was that something regressed with returning memory back to the OS forcing page faults, but no, it's not that. Even if I completely disable that, nothing changes. Plus, perf stat is telling me that the Green Tea version incurs half the page faults as without Green Tea...
Still investigating.
Comment From: mknyszek
If it's watching runtime metrics to make decisions, then a faster GC (leading to less floating garbage, hnce less of a ballast, etc. etc.) could lead to very different behavior, as the GC and the caching behavior effectively operate in a mutual feedback loop. Like, if hugo is much more readily dropping cache entries, that could easily lead to a lot more zeroing.
This was just a guess, but in addition to my comment above, another thing that makes this irrelevant is I can just set HUGO_MEMORYLIMIT very high and reproduce the same slowdown. So the cache eviction behavior doesn't actually matter.
Comment From: mknyszek
I have to put this aside for today, but so far I've learned through Linux perf (via the cycles event) that the extra time unsurprisingly is coming from time spent in the kernel, which we end up in via memclrNoHeapPointers. Unfortunately, I do not have access to a machine or VM at the moment that will easily let me symbolize kernel addresses... So far I've been able to rule out the following perf events:
- minor-faults
- major-faults
- page-faults
- dTLB-*
- iTLB-*
- L1-icache-*
I may need to double-check my work and make sure I didn't misread the results on any of them.
I was concerned that the root cause was dTLB-store-related issues (an attempt to store but the page is not in the TLB) but that doesn't seem to be the case... maybe.
Comment From: mknyszek
I managed to symbolize kernel symbols on a different machine. These are task-clock based samples, so a little less accurate, but if it's correct, it's more information than before.
-   30.56%     0.71%  hugo     hugo                  [.] runtime.memclrNoHeapPointers
   - 29.84% runtime.memclrNoHeapPointers
      - 29.84% asm_exc_page_fault
         - 29.83% exc_page_fault
            - 29.83% do_user_addr_fault
               - 29.14% handle_mm_fault
                  - 29.06% __handle_mm_fault
                     - 15.12% do_wp_page
                        - 7.96% ptep_clear_flush
                           - flush_tlb_mm_range
                              - 7.90% on_each_cpu_cond_mask
                                 - 7.90% smp_call_function_many_cond
                                      3.38% __x2apic_send_IPI_mask
                        - 6.45% __pte_offset_map_lock
                           - 6.43% _raw_spin_lock
                                6.41% __pv_queued_spin_lock_slowpath
                     - 10.24% _raw_spin_lock
                          10.21% __pv_queued_spin_lock_slowpath
                     + 2.52% do_anonymous_page
                     + 1.01% do_huge_pmd_anonymous_page
Except I still don't really understand why Green Tea would cause more page faults, or more contention in the page fault handler. It is true that, especially without HUGO_MEMORYLIMIT this program's heap is growing monotonically (up to around 50 GiB), so one would expect most of the new allocations to force faulting in new memory.
... but then we also shouldn't be faulting in new memory on memclrNoHeapPointers. I have plenty of RAM on all the machines I'm testing on, so we shouldn't be hitting swap. The only page fault should be on first access to fresh memory, which we skip zeroing for. (It makes sense that it might happen from initHeapBits, though, which does touch fresh memory. We should consider not doing that...)
Also, I did indeed observe fewer page faults for GOMAXPROCS=64, but there are 1.5x-2x the page faults when I set GOMAXPROCS=16. On the other hand, the regression and the fact that the spin lock in the kernel is a major part of the regression appears to be the case either way. There doesn't necessarily have to be more page faults in any case. It seems to me that each page fault is more expensive because this spin lock is a scalability bottleneck.
My "optimistic" hypothesis about this issue is that because Green Tea is faster and scales better, it's uncovered a different scalability bottleneck, and performance is collapsing on that bottleneck. I'm not yet 100% sold on this as the answer, but one piece of evidence to support this is the fact that there's less time spent in GC assists with Green Tea (which makes sense, if the GC completes faster, goroutines don't need to assist as much). This is supported by the gctraces from earlier, but especially so when HUGO_MEMORYLIMIT is effectively disabled (100):
Without Green Tea:
gc 1 @0.005s 1%: 0.052+1.1+0.12 ms clock, 3.3+0.093/0.92/0+7.7 ms cpu, 3->4->1 MB, 4 MB goal, 0 MB stacks, 0 MB globals, 64 P
gc 2 @0.008s 1%: 0.034+0.76+0.022 ms clock, 2.2+0.10/0.91/0+1.4 ms cpu, 3->4->1 MB, 4 MB goal, 0 MB stacks, 0 MB globals, 64 P
gc 3 @0.013s 2%: 0.034+0.64+0.12 ms clock, 2.1+0.11/1.2/0.019+8.1 ms cpu, 3->3->1 MB, 4 MB goal, 0 MB stacks, 0 MB globals, 64 P
gc 4 @0.019s 2%: 0.032+0.68+0.099 ms clock, 2.0+0.11/1.8/0+6.3 ms cpu, 3->3->1 MB, 4 MB goal, 0 MB stacks, 0 MB globals, 64 P
gc 5 @0.022s 2%: 0.026+0.85+0.10 ms clock, 1.6+0.17/2.9/0.050+6.6 ms cpu, 3->3->2 MB, 4 MB goal, 0 MB stacks, 0 MB globals, 64 P
gc 6 @0.030s 2%: 0.038+0.84+0.12 ms clock, 2.4+0.078/4.2/0.009+8.2 ms cpu, 5->5->3 MB, 5 MB goal, 0 MB stacks, 0 MB globals, 64 P
gc 7 @0.040s 2%: 0.042+1.6+0.067 ms clock, 2.7+0.092/12/0.002+4.3 ms cpu, 6->6->5 MB, 7 MB goal, 0 MB stacks, 0 MB globals, 64 P
gc 8 @0.060s 3%: 0.75+3.3+0.067 ms clock, 48+0.015/18/0+4.3 ms cpu, 10->12->7 MB, 11 MB goal, 0 MB stacks, 0 MB globals, 64 P
gc 9 @0.068s 4%: 0.20+3.9+1.2 ms clock, 13+0.072/20/0+77 ms cpu, 14->16->10 MB, 16 MB goal, 0 MB stacks, 0 MB globals, 64 P
gc 10 @0.078s 5%: 0.61+5.1+0.23 ms clock, 39+2.6/43/0+15 ms cpu, 18->23->14 MB, 21 MB goal, 0 MB stacks, 0 MB globals, 64 P
gc 11 @0.102s 5%: 0.060+3.6+0.030 ms clock, 3.8+0.041/49/33+1.9 ms cpu, 26->26->16 MB, 30 MB goal, 0 MB stacks, 0 MB globals, 64 P
gc 12 @0.138s 4%: 0.20+9.0+0.027 ms clock, 13+5.2/62/0+1.7 ms cpu, 29->44->32 MB, 34 MB goal, 0 MB stacks, 0 MB globals, 64 P
gc 13 @0.153s 6%: 3.0+9.3+0.041 ms clock, 193+27/44/0+2.6 ms cpu, 60->66->41 MB, 65 MB goal, 0 MB stacks, 0 MB globals, 64 P
gc 14 @0.175s 8%: 5.6+5.1+0.37 ms clock, 362+27/55/0.090+24 ms cpu, 72->89->57 MB, 85 MB goal, 0 MB stacks, 0 MB globals, 64 P
gc 15 @0.189s 9%: 1.0+6.0+0.086 ms clock, 68+33/50/0.030+5.5 ms cpu, 114->149->104 MB, 128 MB goal, 0 MB stacks, 0 MB globals, 64 P
gc 16 @0.200s 9%: 1.5+7.6+0.25 ms clock, 99+27/59/0.21+16 ms cpu, 179->258->156 MB, 211 MB goal, 0 MB stacks, 0 MB globals, 64 P
gc 17 @0.213s 10%: 1.3+9.2+0.71 ms clock, 87+29/70/0.74+45 ms cpu, 269->371->221 MB, 314 MB goal, 0 MB stacks, 0 MB globals, 64 P
gc 18 @0.230s 10%: 2.0+10+2.1 ms clock, 130+0/63/0+135 ms cpu, 378->472->262 MB, 444 MB goal, 0 MB stacks, 0 MB globals, 64 P
gc 19 @0.259s 9%: 2.0+65+2.5 ms clock, 131+0.066/142/0+162 ms cpu, 450->691->488 MB, 527 MB goal, 0 MB stacks, 0 MB globals, 64 P
gc 20 @0.378s 10%: 1.3+63+3.1 ms clock, 88+0.079/885/0.62+200 ms cpu, 835->1175->1034 MB, 978 MB goal, 0 MB stacks, 0 MB globals, 64 P
gc 21 @0.573s 11%: 4.3+154+2.7 ms clock, 278+347/1997/0.86+174 ms cpu, 1765->2622->2140 MB, 2070 MB goal, 0 MB stacks, 0 MB globals, 64 P
gc 22 @0.950s 12%: 1.6+255+3.0 ms clock, 105+995/3283/0.042+193 ms cpu, 3646->5147->3892 MB, 4282 MB goal, 0 MB stacks, 0 MB globals, 64 P
gc 23 @1.589s 14%: 3.0+388+1.2 ms clock, 197+2139/6066/0+80 ms cpu, 6630->8981->6769 MB, 7785 MB goal, 0 MB stacks, 0 MB globals, 64 P
gc 24 @2.678s 15%: 2.5+667+2.1 ms clock, 163+4783/10560/0+137 ms cpu, 11531->15466->11846 MB, 13539 MB goal, 0 MB stacks, 0 MB globals, 64 P
gc 25 @4.575s 16%: 2.4+1175+3.4 ms clock, 153+8633/18393/0+218 ms cpu, 20177->26772->20447 MB, 23694 MB goal, 0 MB stacks, 0 MB globals, 64 P
gc 26 @7.822s 16%: 3.1+2216+1.6 ms clock, 200+12146/35272/0+108 ms cpu, 34825->45998->35265 MB, 40895 MB goal, 0 MB stacks, 0 MB globals, 64 P
With Green Tea:
gc 1 @0.006s 1%: 0.10+1.0+0.095 ms clock, 6.4+0.10/1.2/0+6.1 ms cpu, 3->4->1 MB, 4 MB goal, 0 MB stacks, 0 MB globals, 64 P
gc 2 @0.009s 3%: 0.031+0.69+0.23 ms clock, 2.0+0.16/1.1/0+15 ms cpu, 3->4->1 MB, 4 MB goal, 0 MB stacks, 0 MB globals, 64 P
gc 3 @0.013s 3%: 0.038+0.85+0.12 ms clock, 2.4+0.13/0.98/0+8.2 ms cpu, 3->4->1 MB, 4 MB goal, 0 MB stacks, 0 MB globals, 64 P
gc 4 @0.018s 4%: 0.038+0.72+0.23 ms clock, 2.4+0.15/1.1/0+15 ms cpu, 3->4->1 MB, 4 MB goal, 0 MB stacks, 0 MB globals, 64 P
gc 5 @0.024s 3%: 0.051+0.83+0.097 ms clock, 3.3+0.15/1.5/0+6.2 ms cpu, 4->4->2 MB, 4 MB goal, 0 MB stacks, 0 MB globals, 64 P
gc 6 @0.031s 3%: 0.039+1.0+0.055 ms clock, 2.5+0.75/4.1/0.066+3.5 ms cpu, 5->5->3 MB, 5 MB goal, 0 MB stacks, 0 MB globals, 64 P
gc 7 @0.042s 2%: 0.048+1.6+0.079 ms clock, 3.1+0.15/8.6/0.30+5.0 ms cpu, 6->7->5 MB, 7 MB goal, 0 MB stacks, 0 MB globals, 64 P
gc 8 @0.065s 2%: 0.40+2.4+0.13 ms clock, 26+0.58/12/0+8.4 ms cpu, 10->11->7 MB, 10 MB goal, 0 MB stacks, 0 MB globals, 64 P
gc 9 @0.073s 4%: 0.75+2.2+0.52 ms clock, 48+0.16/13/0+33 ms cpu, 13->14->9 MB, 14 MB goal, 0 MB stacks, 0 MB globals, 64 P
gc 10 @0.081s 5%: 0.51+3.6+0.89 ms clock, 32+0.21/17/0+57 ms cpu, 17->20->12 MB, 19 MB goal, 0 MB stacks, 0 MB globals, 64 P
gc 11 @0.094s 5%: 0.73+4.0+0.47 ms clock, 47+0.069/25/0.29+30 ms cpu, 24->25->16 MB, 26 MB goal, 0 MB stacks, 0 MB globals, 64 P
gc 12 @0.141s 4%: 0.054+3.8+0.10 ms clock, 3.4+0.15/30/10+6.9 ms cpu, 31->32->24 MB, 34 MB goal, 0 MB stacks, 0 MB globals, 64 P
gc 13 @0.156s 4%: 1.9+17+0.31 ms clock, 125+8.4/35/0+19 ms cpu, 44->76->57 MB, 49 MB goal, 0 MB stacks, 0 MB globals, 64 P
gc 14 @0.183s 6%: 3.9+10+0.26 ms clock, 255+16/46/1.3+16 ms cpu, 109->140->82 MB, 116 MB goal, 0 MB stacks, 0 MB globals, 64 P
gc 15 @0.202s 6%: 1.1+8.4+0.36 ms clock, 73+10/37/0+23 ms cpu, 157->233->153 MB, 167 MB goal, 0 MB stacks, 0 MB globals, 64 P
gc 16 @0.217s 6%: 1.2+10+0.54 ms clock, 77+0.14/46/0+34 ms cpu, 265->354->196 MB, 308 MB goal, 0 MB stacks, 0 MB globals, 64 P
gc 17 @0.234s 7%: 1.4+6.1+1.4 ms clock, 94+1.6/39/0+94 ms cpu, 335->397->215 MB, 394 MB goal, 0 MB stacks, 0 MB globals, 64 P
gc 18 @0.249s 7%: 2.6+29+3.8 ms clock, 167+0.044/48/0+246 ms cpu, 370->434->267 MB, 432 MB goal, 0 MB stacks, 0 MB globals, 64 P
gc 19 @0.305s 7%: 2.8+12+2.0 ms clock, 184+0.046/100/0+133 ms cpu, 457->471->304 MB, 536 MB goal, 0 MB stacks, 0 MB globals, 64 P
gc 20 @0.386s 6%: 0.65+52+1.3 ms clock, 41+0/247/13+86 ms cpu, 519->582->532 MB, 610 MB goal, 0 MB stacks, 0 MB globals, 64 P
gc 21 @0.667s 5%: 1.7+100+1.2 ms clock, 115+0.031/633/0+80 ms cpu, 908->1029->940 MB, 1066 MB goal, 0 MB stacks, 0 MB globals, 64 P
gc 22 @1.076s 5%: 7.1+231+8.0 ms clock, 454+28/1096/1.6+512 ms cpu, 1603->2184->1839 MB, 1882 MB goal, 0 MB stacks, 0 MB globals, 64 P
gc 23 @1.866s 5%: 1.2+234+4.6 ms clock, 78+0.072/2039/0+295 ms cpu, 3134->3539->2541 MB, 3680 MB goal, 0 MB stacks, 0 MB globals, 64 P
gc 24 @2.645s 5%: 1.8+324+5.5 ms clock, 119+0.040/3268/19+355 ms cpu, 4330->4815->3615 MB, 5084 MB goal, 0 MB stacks, 0 MB globals, 64 P
gc 25 @3.912s 5%: 5.0+475+7.2 ms clock, 320+0.031/4847/0+463 ms cpu, 6160->7026->5453 MB, 7233 MB goal, 0 MB stacks, 0 MB globals, 64 P
gc 26 @5.752s 5%: 5.4+611+4.0 ms clock, 348+12/6917/0+257 ms cpu, 9290->10407->7943 MB, 10907 MB goal, 0 MB stacks, 0 MB globals, 64 P
gc 27 @8.341s 5%: 4.6+776+5.5 ms clock, 295+10/10238/0+355 ms cpu, 13531->14891->11409 MB, 15887 MB goal, 0 MB stacks, 0 MB globals, 64 P
gc 28 @12.533s 5%: 2.9+1116+6.9 ms clock, 187+54/15377/0+441 ms cpu, 20773->22817->17236 MB, 22820 MB goal, 0 MB stacks, 0 MB globals, 64 P
gc 29 @18.833s 5%: 5.3+1594+7.7 ms clock, 341+56/23711/15+493 ms cpu, 31523->34216->25726 MB, 34474 MB goal, 0 MB stacks, 0 MB globals, 64 P
gc 30 @27.104s 5%: 5.5+2052+0.72 ms clock, 356+136/32755/5565+46 ms cpu, 46963->50694->38246 MB, 51454 MB goal, 0 MB stacks, 0 MB globals, 64 P
(Assists are here in the format: <sweep term STW>+<assist>/<dedicated>/<idle>+<mark term STW> ms cpu)
(Note: the GC CPU fraction reported by gctrace is likely lower for Green Tea than it should be because the rest of the program is slower, but actual CPU time and CPU cycle numbers confirm about a 20% reduction, repeatably.)
Assists put back-pressure on allocation, putting space and time between page faults, reducing contention. With added contention, a spin lock especially, will likely have its performance totally collapse.
Another minor piece of evidence supporting this hypothesis is that the perf does show some samples in the spin lock without Green Tea, too. Just less.
Like I said, I'm not 100% sold yet on this idea. There's a lot I'm still unsure of when it comes to where the page fault contention is really coming from. I think there are more experiments I can run to try to make sure Green Tea isn't introducing any new artifacts here.
Comment From: prattmic
In case it wasn't already clear, I'm fairly certain this case in do_wp_page is doing COW of a read-only mapping due to a write. I'm not 100% sure, but ptep_clear_flush is called from wp_page_copy (which is called from do_wp_page, presumably inlined). Replacing a RO page with a RW page seems like the most obvious reason a page fault would need to do a TLB shootdown in the first place.
I'd guess that the RO page being COW'd is the zero page?
Regarding the spin lock, the most likely candidate to me seems to be the page table lock. IIRC, this lock protects entries at the PMD level (that is, page table entries for 2MB of address space). It differs for huge pages, but I'm not sure huge pages use this code path.
Contention here to me implies that many threads are hitting faults within the same 2MB region (either the exact same page, or nearby).
Perhaps you could collect the exceptions:page_fault_user tracepoint (perf record -e exceptions:page_fault_user) to see if the fault addresses are close together. Though with this much CPU in the fault handler, tracing will likely emit a lot of events!
Edit: I'm also curious about a profile without Green Tea. Is the page fault overhead completely new with Green Tea? Or is it just the lock contention that is new?
Comment From: mknyszek
In case it wasn't already clear, I'm fairly certain this case in
do_wp_pageis doing COW of a read-only mapping due to a write. I'm not 100% sure, butptep_clear_flushis called fromwp_page_copy(which is called fromdo_wp_page, presumably inlined). Replacing a RO page with a RW page seems like the most obvious reason a page fault would need to do a TLB shootdown in the first place.
I hadn't dug into the sources yet, this is super helpful.
I'd guess that the RO page being COW'd is the zero page?
Oh... are you saying that memclrNoHeapPointers is writing the zero page? Some of the arithmetic in there seemed funky, and it occurs to me that that might be the trick -- if the size wraps back around we end up writing to the zero page (or something, I haven't read it too closely).
Regarding the spin lock, the most likely candidate to me seems to be the page table lock. IIRC, this lock protects entries at the PMD level (that is, page table entries for 2MB of address space). It differs for huge pages, but I'm not sure huge pages use this code path.
As an aside, I did notice that performance substantially improved both on my personal work VM and in the perf gomotes when I disabled huge pages with GODEBUG=disablethp=1. (This just calls MADV_NOHUGEPAGE on all heap memory.) Could be unrelated.
Contention here to me implies that many threads are hitting faults within the same 2MB region (either the exact same page, or nearby).
Perhaps you could collect the
exceptions:page_fault_usertracepoint (perf record -e exceptions:page_fault_user) to see if the fault addresses are close together. Though with this much CPU in the fault handler, tracing will likely emit a lot of events!
Thanks! I'll give it a try.
Edit: I'm also curious about a profile without Green Tea. Is the page fault overhead completely new with Green Tea? Or is it just the lock contention that is new?
There are a lot of page faults both before and after, and the difference depends on what GOMAXPROCS is, but I can't really intuitively say why. (GOMAXPROCS=64 is barely different, GOMAXPROCS=16 has the version with Green Tea hit 1.5-2x the page fault count, but it's inconsistent.)
perf does attribute quite a few samples without Green Tea, but it just seems to blow up when Green Tea is enabled. Instead of 29.84% in asm_exc_page_fault it's like 10%? But I've found these numbers to be noisy -- I have to use task-clock because I don't have cycles on my personal work VM, but I do have kernel symbolization. Now that I know what it is though, I can probably just interpret the kernel address as asm_exc_page_fault in the perf gomote. 😅
Comment From: prattmic
I'd guess that the RO page being COW'd is the zero page?
Oh... are you saying that
memclrNoHeapPointersis writing the zero page? Some of the arithmetic in there seemed funky, and it occurs to me that that might be the trick -- if the size wraps back around we end up writing to the zero page (or something, I haven't read it too closely).
Apologies. To be more clear, my theory is:
- Go mmaps a new MAP_ANONYMOUS page. Linux does not change the page tables at all at this point.
- Go reads from the page. This triggers a page fault, as there is no mapping. Linux sees this is a read of a brand new anonymous page. Rather than actually allocating a new page at this point, Linux adds a RO mapping of its zero page to the page table. A read of a new mapping should read as zero, so this is semantically correct.
- Go later writes to the page. This triggers a page fault because the mapping is not writable. Now Linux must allocate a new page to replace the RO zero page mapping with a RW mapping to the new page.
I am reasonably confident that this is how Linux handles mapping and touching new pages (or at least how it used to), but I'm less confident if this access pattern is what's actually happening in the application.
Comment From: mknyszek
A small tangent that I just wanted to capture in this discussion: I was confused earlier about how memclrNoHeapPointers could be writing to fresh memory. After all, we have an optimization to avoid zeroing fresh memory. We do zero part of it if it could contain small objects with pointers, via initHeapBits, so that explains that. But what @prattmic brought to my attention is that some larger allocation might have pages inside of it that never get written to, and stay zeroed. Once we recycle that memory, we lose the state of it being freshly allocated, so the next access might end up using memclrNoHeapPointers.
I mentioned that hugo seems to have a monotonically growing heap if its bespoke memory limit is set high enough, but it's not like the entire heap is live at every cycle, just most of it. It does still generate garbage that is collected, and that memory is going to get reused.
Comment From: mknyszek
As an update, @prattmic and I spent a good part of today digging in further with Linux probes. There is a clear and large difference in the number of TLB shootdowns (during page faults) we see before and after, but we haven't yet figured out where they're coming from.
We did trace all the virtual addresses that fault and subsequently trigger TLB shootdowns. Unfortunately the distribution of faulting addresses doesn't really tell us anything:
many-big-json-in-assets $ cat do_wp_page-nogreentea | go run tlbflushaddr.go | awk 'length($0) == 12' | dist
N 23378  sum 1.97178e+16  mean 8.43436e+11  gmean 8.43298e+11  std dev 1.52887e+10  variance 2.33743e+20

     min 8.24638e+11
   1%ile 8.24639e+11
   5%ile 8.24663e+11
  25%ile 8.29661e+11
  median 8.42184e+11
  75%ile 8.54467e+11
  95%ile 8.74165e+11
  99%ile 8.79345e+11
     max 8.79744e+11

⠀⠀⠀⠀⠀⠀⠀⡰⠒⢆⠀⠀⠀⠀⠀⠀⠀⠀⠀⠀⠀⠀⠀⠀⠀⠀⠀⠀⠀⠀⠀⠀⠀⠀⠀⠀⠀⠀⠀⠀⠀⠀⠀⠀⠀⠀⠀⠀⠀⠀⠀⠀⠀⠀⠀⠀⠀⠀⠀⠀⠀⠀⠀⠀⠀⠀⠀⠀⠀⠀⡖ 0.000
⠀⠀⠀⠀⠀⠀⡸⠁⠀⠈⠦⠤⠖⠒⢄⡀⠀⠀⣀⣀⡀⣀⡀⠀⠀⢀⡴⠒⠲⢤⡀⠀⠀⠀⠀⣀⡴⠒⠦⢄⡀⠀⠀⠀⠀⠀⠀⠀⠀⠀⠀⠀⠀⠀⠀⠀⠀⠀⠀⠀⠀⠀⠀⠀⠀⠀⠀⠀⠀⠀⡇
⠠⠤⠤⠤⠤⠤⠃⠀⠀⠀⠀⠀⠀⠀⠀⠉⠉⠉⠁⠀⠉⠀⠉⠉⠉⠁⠀⠀⠀⠀⠉⠉⠓⠲⠊⠁⠀⠀⠀⠀⠉⠉⠉⠒⠦⠤⠖⠖⠒⠒⠒⠒⠲⠤⠤⠤⠖⠒⠦⠤⠴⠚⠉⠓⠦⠤⠤⠤⠤⠄⠧ 0.000
⠈⠉⠉⠉⠉⠉⠉⠉⠉⠉⠉⠉⠉⠉⠉⠉⠉⠉⠉⠉⠉⠉⠉⠉⠉⠉⠉⠉⠉⠉⠉⠉⠉⠋⠉⠉⠉⠉⠉⠉⠉⠉⠉⠉⠉⠉⠉⠉⠉⠉⠉⠉⠉⠉⠉⠉⠉⠉⠉⠉⠉⠉⠉⠉⠉⠉⠉⠉⠉⠁
                              8.5e+11
many-big-json-in-assets $ cat do_wp_page-greentea | go run tlbflushaddr.go | awk 'length($0) == 12' | dist
N 176807  sum 1.48395e+17  mean 8.39303e+11  gmean 8.39193e+11  std dev 1.36006e+10  variance 1.84977e+20

     min 8.24638e+11
   1%ile 8.2466e+11
   5%ile 8.25072e+11
  25%ile 8.27105e+11
  median 8.34985e+11
  75%ile 8.5099e+11
  95%ile 8.64521e+11
  99%ile 8.67822e+11
     max 8.68519e+11

⠀⠀⠀⠀⠀⠀⠀⢠⠒⠒⠢⣄⠀⠀⠀⠀⠀⠀⠀⠀⠀⠀⠀⠀⠀⠀⠀⠀⠀⠀⠀⠀⠀⠀⠀⠀⠀⠀⠀⠀⠀⠀⠀⠀⠀⠀⠀⠀⠀⠀⠀⠀⠀⠀⠀⠀⠀⠀⠀⠀⠀⠀⠀⠀⠀⠀⠀⠀⠀⠀⡖ 0.000
⠀⠀⠀⠀⠀⠀⢠⠃⠀⠀⠀⠈⢦⠀⠀⠀⠀⠀⠀⠀⠀⠀⠀⠀⠀⠀⠀⠀⠀⠀⠀⠀⠀⠀⠀⠀⠀⠀⠀⠀⠀⠀⠀⠀⠀⠀⠀⠀⠀⠀⠀⠀⠀⠀⠀⠀⠀⠀⠀⠀⠀⠀⠀⠀⠀⠀⠀⠀⠀⠀⡇
⠠⠤⠤⠤⠤⠤⠏⠀⠀⠀⠀⠀⠀⠑⠒⠒⠒⠒⠒⠒⠒⠒⠒⠒⠒⠒⠒⠒⠒⠒⠒⠒⠒⠒⠒⠒⠒⠒⠒⠒⠒⠒⠒⠒⠒⠒⠒⠒⠒⠓⠒⠒⠒⠒⠦⠖⠒⠒⠒⠒⠒⠒⠒⠢⠤⠤⠤⠤⠤⠄⠧ 0.000
⠈⠉⠉⠉⠉⠉⠉⠉⠉⠉⠉⠉⠉⠉⠉⠉⠉⠉⠉⠉⠉⠉⠉⠉⠉⠉⠉⠉⠉⠉⠉⠉⠉⠉⠉⠉⠉⠉⠉⠙⠉⠉⠉⠉⠉⠉⠉⠉⠉⠉⠉⠉⠉⠉⠉⠉⠉⠉⠉⠉⠉⠉⠉⠉⠉⠉⠉⠉⠉⠁
                                    8.5e+11
(The X axis is the address space. That bump in the lower addresses with Green Tea seems like it should be the cause, but (1) the bump really is that wide and (2) faults that trigger TLB shootdowns do just seem to be higher across the board. The actual distributional statistics look similar as well.)
Comment From: mknyszek
@prattmic's theory in https://github.com/golang/go/issues/73581#issuecomment-2981315335 was exactly right. There's a new compiler-inserted nil check on the allocation path with Green Tea enabled that causes the page to first get mapped as RO, then immediately remapped as RW internally by Linux.
Here is the entire diff that, for me, makes hugo with Green Tea run in 13 seconds (parity or better than without Green Tea) instead of 25 seconds:
diff --git a/src/runtime/mgcmark_greenteagc.go b/src/runtime/mgcmark_greenteagc.go
index 75c347b9e9..833800b9f2 100644
--- a/src/runtime/mgcmark_greenteagc.go
+++ b/src/runtime/mgcmark_greenteagc.go
@@ -111,6 +111,9 @@ func (o *spanScanOwnership) or(v spanScanOwnership) spanScanOwnership {
 }

 func (imb *spanInlineMarkBits) init(class spanClass) {
+       if imb == nil {
+               throw("bad")
+       }
        *imb = spanInlineMarkBits{}
        imb.class = class
 }
I have never been hurt so bad by a single implicit nil check...
Comment From: mknyszek
This may also explain the small-but-inconsistent regression in the Go compiler benchmarks. IIRC, the Go compiler and linker both essentially just grow the heap monotonically, and are also short-lived binaries.
Comment From: randall77
Maybe we should distinguish a "write nil check" from a "read nil check" in the compiler.
Comment From: gopherbot
Change https://go.dev/cl/684015 mentions this issue: runtime: make explicit nil check in (*spanInlineMarkBits).init
Comment From: joamaki
Seeing a marked decrease in total CPU usage in https://github.com/cilium/statedb/tree/main/reconciler/benchmark. It's a benchmark for reconciliation of immutable objects stored in an immutable radix tree so lots of copying going on.
With green tea:
 Performance counter stats for './benchmark.greenteagc':

          2,974.23 msec task-clock:u                     #    1.700 CPUs utilized
                 0      context-switches:u               #    0.000 /sec
                 0      cpu-migrations:u                 #    0.000 /sec
           250,642      page-faults:u                    #   84.271 K/sec
    19,798,428,547      cpu_atom/instructions/u          #    2.35  insn per cycle              (20.81%)
    25,183,321,287      cpu_core/instructions/u          #    2.78  insn per cycle              (76.53%)
     8,436,847,545      cpu_atom/cycles/u                #    2.837 GHz                         (20.40%)
     9,056,228,146      cpu_core/cycles/u                #    3.045 GHz                         (76.53%)
     3,220,224,730      cpu_atom/branches/u              #    1.083 G/sec                       (20.61%)
     4,976,806,346      cpu_core/branches/u              #    1.673 G/sec                       (76.53%)
         9,409,869      cpu_atom/branch-misses/u         #    0.29% of all branches             (20.59%)
         9,790,661      cpu_core/branch-misses/u         #    0.20% of all branches             (76.53%)
             TopdownL1 (cpu_core)                 #     25.5 %  tma_backend_bound
                                                  #      4.0 %  tma_bad_speculation
                                                  #     21.4 %  tma_frontend_bound
                                                  #     49.1 %  tma_retiring             (76.53%)
                                                  #      4.8 %  tma_bad_speculation
                                                  #     48.8 %  tma_retiring             (20.49%)
                                                  #     38.0 %  tma_backend_bound
                                                  #      8.5 %  tma_frontend_bound       (20.50%)

       1.749056908 seconds time elapsed

       2.441272000 seconds user
       0.525682000 seconds sys
Without:
 Performance counter stats for './benchmark.nogreenteagc':

          4,519.52 msec task-clock:u                     #    2.590 CPUs utilized
                 0      context-switches:u               #    0.000 /sec
                 0      cpu-migrations:u                 #    0.000 /sec
           231,497      page-faults:u                    #   51.222 K/sec
    16,286,908,284      cpu_atom/instructions/u          #    1.26  insn per cycle              (29.56%)
    31,681,717,214      cpu_core/instructions/u          #    2.17  insn per cycle              (66.31%)
    12,907,119,131      cpu_atom/cycles/u                #    2.856 GHz                         (29.54%)
    14,587,197,608      cpu_core/cycles/u                #    3.228 GHz                         (66.31%)
     3,022,799,095      cpu_atom/branches/u              #  668.832 M/sec                       (29.48%)
     6,367,361,070      cpu_core/branches/u              #    1.409 G/sec                       (66.31%)
         8,234,615      cpu_atom/branch-misses/u         #    0.27% of all branches             (29.41%)
        12,593,561      cpu_core/branch-misses/u         #    0.20% of all branches             (66.31%)
             TopdownL1 (cpu_core)                 #     31.4 %  tma_backend_bound
                                                  #      4.4 %  tma_bad_speculation
                                                  #     19.1 %  tma_frontend_bound
                                                  #     45.0 %  tma_retiring             (66.31%)
                                                  #      4.8 %  tma_bad_speculation
                                                  #     26.4 %  tma_retiring             (29.46%)
                                                  #     63.4 %  tma_backend_bound
                                                  #      5.4 %  tma_frontend_bound       (29.33%)

       1.745282191 seconds time elapsed

       4.020599000 seconds user
       0.463741000 seconds sys
Still seeing higher page fault rate even with runtime: make explicit nil check in (*spanInlineMarkBits).init though.
Also interestingly by setting GOMAXPROCS=2 the difference between the two almost disappears. It seems that with nogreenteagc and higher GOMAXPROCS Go runtime is wasting a lot more cycles without really making the benchmark any faster:
$ GOMAXPROCS=2 perf stat ./benchmark.nogreenteagc
...
 Performance counter stats for './benchmark.nogreenteagc':

          2,742.13 msec task-clock:u                     #    1.392 CPUs utilized
                 0      context-switches:u               #    0.000 /sec
                 0      cpu-migrations:u                 #    0.000 /sec
           252,479      page-faults:u                    #   92.074 K/sec
    14,141,430,021      cpu_atom/instructions/u          #    2.34  insn per cycle              (2.12%)
    29,854,246,748      cpu_core/instructions/u          #    3.35  insn per cycle              (97.70%)
     6,043,431,066      cpu_atom/cycles/u                #    2.204 GHz                         (1.88%)
     8,925,010,231      cpu_core/cycles/u                #    3.255 GHz                         (97.70%)
     2,994,245,234      cpu_atom/branches/u              #    1.092 G/sec                       (1.90%)
     5,836,966,133      cpu_core/branches/u              #    2.129 G/sec                       (97.70%)
         8,748,807      cpu_atom/branch-misses/u         #    0.29% of all branches             (2.02%)
        10,158,016      cpu_core/branch-misses/u         #    0.17% of all branches             (97.70%)
             TopdownL1 (cpu_core)                 #     23.9 %  tma_backend_bound
                                                  #      4.8 %  tma_bad_speculation
                                                  #     16.6 %  tma_frontend_bound
                                                  #     54.6 %  tma_retiring             (97.70%)
                                                  #      4.3 %  tma_bad_speculation
                                                  #     55.6 %  tma_retiring             (2.01%)
                                                  #     26.0 %  tma_backend_bound
                                                  #     14.1 %  tma_frontend_bound       (2.07%)

       1.969246340 seconds time elapsed

       2.325855000 seconds user
       0.407812000 seconds sys
Comment From: bep
@mknyszek I will test this myself once the rc2 gets out, but I noticed that my Hugo report's fix had some very specific Linux remarks. My bug report came from darwin/arm64. Have you also verified this on that platform?
Comment From: thepudds
once the rc2 gets out
Hi @bep, just a quick comment that to my understanding, go1.25rc2 does contain f8ccda2e0574c (https://go.dev/cl/684015), and rc2 was released a few days ago:
https://go.dev/dl/#go1.25rc2
$ go install golang.org/dl/go1.25rc2@latest
$ go1.25rc2 download
$ go1.25rc2 test foo
Comment From: mknyszek
@mknyszek I will test this myself once the rc2 gets out, but I noticed that my Hugo report's fix had some very specific Linux remarks. My bug report came from
darwin/arm64. Have you also verified this on that platform?
Oops. I did not verify this on darwin/arm64 but I'll do that shortly. I expect it's the same issue, and that the same issue will exist on any relatively recent Unix-y OS. (That is, I wouldn't be surprised if all mmaps worked this way.)
Comment From: mknyszek
Well, no, it appears to be something different. At least on the darwin/arm64 machine I have access to.
I don't actually have enough memory to run the benchmark consistently as-is. I need to reduce the amount of content hugo works with, which is fine. (HUGO_MEMORYLIMIT doesn't seem to help because it kicks in too late, and I hit swap.) But yeah, I still reproduce a slowdown.
Here's what the CPU profiles say:
File: hugo
Type: cpu
Time: 2025-07-14 12:17:03 EDT
Duration: 20.25s, Total samples = 47.16s (232.84%)
Entering interactive mode (type "help" for commands, "o" for options)
(pprof) top
Showing nodes accounting for 2210ms, 4.69% of 47160ms total
Dropped 5 nodes (cum <= 235.80ms)
Showing top 10 nodes out of 514
      flat  flat%   sum%        cum   cum%
  -10430ms 22.12% 22.12%   -10450ms 22.16%  runtime.(*mspan).heapBitsSmallForAddr
    8840ms 18.74%  3.37%     9370ms 19.87%  runtime.tryDeferToSpanScan
    5760ms 12.21%  8.84%     5820ms 12.34%  runtime.(*mspan).mergeInlineMarks # Clearing mark bits.
   -2890ms  6.13%  2.71%    -2890ms  6.13%  runtime.madvise
    1990ms  4.22%  6.93%     1990ms  4.22%  runtime.duffzero # Clearing mark bits.
    -900ms  1.91%  5.03%    -1350ms  2.86%  runtime.greyobject
    -860ms  1.82%  3.20%     -860ms  1.82%  runtime.memclrNoHeapPointers
     850ms  1.80%  5.00%     9350ms 19.83%  runtime.scanObjectsSmall
    -700ms  1.48%  3.52%   -12560ms 26.63%  runtime.scanobject
     550ms  1.17%  4.69%      540ms  1.15%  encoding/json.stateInString
So, I think I see overall less time in the mark phase, but for whatever reason: 1. Clearing the mark bits during sweep is more expensive than I would've anticipated. 2. Clearing the mark bits on allocation is surprisingly expensive, but this could just be a cost that was being paid elsewhere.
This is pretty weird -- I'd like to know if you see the same thing, @bep, in CPU profiles. The cost of mergeInlineMarks has not shown up in the profiles I've observed on other platforms, including linux/arm64.
Comment From: mknyszek
Oh, but there's also low-hanging fruit in mergeInlineMarks. Let me see if I can just make this go away.
Comment From: mknyszek
Yeah, I made mergeInlineMarks about 30% faster by operating 8 bytes at a time instead of 1 byte at a time, and it already looks better. (This is very SIMD-able.) I have one other idea.
Comment From: gopherbot
Change https://go.dev/cl/687937 mentions this issue: runtime: only clear inline mark bits on span alloc if necessary
Comment From: gopherbot
Change https://go.dev/cl/687935 mentions this issue: runtime: merge inline mark bits with gcmarkBits 8 bytes at a time
Comment From: gopherbot
Change https://go.dev/cl/687938 mentions this issue: runtime: use memclrNoHeapPointers to clear inline mark bits
Comment From: gopherbot
Change https://go.dev/cl/687936 mentions this issue: runtime: have mergeInlineMarkBits also clear the inline mark bits
Comment From: vadyus
Did a short test on a production app, 2 instances (1 per server) each running on the same
Architecture:             x86_64
  CPU op-mode(s):         32-bit, 64-bit
  Address sizes:          46 bits physical, 57 bits virtual
  Byte Order:             Little Endian
CPU(s):                   128
  On-line CPU(s) list:    0-127
Vendor ID:                GenuineIntel
  BIOS Vendor ID:         Intel
  Model name:             INTEL(R) XEON(R) GOLD 6548Y+
    BIOS Model name:      INTEL(R) XEON(R) GOLD 6548Y+  CPU @ 2.5GHz
    BIOS CPU family:      179
    CPU family:           6
    Model:                207
    Thread(s) per core:   2
    Core(s) per socket:   32
    Socket(s):            2
Compiled with
go version go1.25-devel_66536242fc Thu Jul 17 03:41:36 2025 -0700 darwin/amd64
With GreenTea:

Without GreenTea:

Load balancer strategy was switched to round-robin so both instances receive equal amount of requests. I see a big drop in relative time spent on runtime.gcBgMarkWorker which is nice to see. I'll do more tests with gctrace later on and post here, but looks promising.
EDIT: gc traces:
Comment From: archanaravindar
Evaluated the benchmarks on power10 taking from the same list as mentioned in the beginning of the proposal Overall we see a very positive impact on last level cache misses with Green tea enabled (Go version go1.25_devel_15d9fe43d6, on a power10 VM with 8-core configuration) Pause time wise, we see some benchmarks do better with Green tea while some exhibit a slow down but it appears that this is not specific to power10 (as we see a similar effect on amd64 too) Observing sparse and dense spans we see that the number of sparse spans is quite reduced compared to number of dense spans which shows that the algorithm is able to accumulate objects well, however the number of sparse spans is not negligible in some cases In only one case(tree), we see Green tea gc has about 4-5% more number of collections It appears that the atomic instructions are used more in green tea compared to regular tea (presumably because operations are happening at the span level rather than the object level?) so we were very relieved to see that it does not impact performance to a large extent on power10.
Pause time/GC | Regular | Green Tea | Delta(%) -ve: GT is better
garbage | 207272 | 214802 | 3.63 bintree | 130184 | 177217 | 36.13 parser | 76684 | 80503 | 4.98 peano | 66842 | 62440 | -6.59 tree | 58322 | 63526 | 8.92 tree2 | 50487 | 39836 | -21.10
Benchmark references used: garbage: https://cs.opensource.google/go/x/benchmarks/+/master:garbage/garbage.go;l=5;drc=c4c5b3d18f14d8a083658ec26d06778e9a4c8437 bintree: https://benchmarksgame-team.pages.debian.net/benchmarksgame/program/binarytrees-go-2.html parser, peano, tree, tree2 are from old Go1.13 test/bench directory
gc_latency from x/benchmarks 99.999 distribution of allocation latency ns | Regular | GT | Delta(%) -ve: GT is better
BenchmarkGCLatency/how=stack/fluff=false-8 | 101316 | 102500 | 1.17 BenchmarkGCLatency/how=stack/fluff=true-8 | 91315 | 78697 | -13.82 BenchmarkGCLatency/how=heap/fluff=false-8 | 93682 | 92939 | -0.79 BenchmarkGCLatency/how=heap/fluff=true-8 | 88884 | 54877 | -38.26 BenchmarkGCLatency/how=global/fluff=false-8 | 93096 | 89539 | -3.82 BenchmarkGCLatency/how=global/fluff=true-8 | 83478 | 55562 | -33.44
99.9999 distribution of allocation latency ns | Regular | GT | Delta(%) -ve: GT is better BenchmarkGCLatency/how=stack/fluff=false-8 | 224752 | 191783 | -14.67 BenchmarkGCLatency/how=stack/fluff=true-8 | 256302 | 189596 | -26.03 BenchmarkGCLatency/how=heap/fluff=false-8 | 230159 | 189209 | -17.79 BenchmarkGCLatency/how=heap/fluff=true-8 | 234001 | 190404 | -18.63 BenchmarkGCLatency/how=global/fluff=false-8 | 862778 | 987248 | 14.43 BenchmarkGCLatency/how=global/fluff=true-8 | 880062 | 990537 | 12.55
Bent benchmarks (only ones that have a difference are shown) Except for two benchmarks that took 11% more time per op with Green tea the performance was either better or similar to without green tea
Bent benchmarks | Regular | | | GT | | | Delta
Arc-8 | 4.13µs | ± | 1.00% | 3.99µs | ± | 0.00% | -3.46% BuildJSON-8 | 4.01µs | ± | 0.00% | 4.06µs | ± | 0.00% | 1.10% RecursiveFunc-8 | 12.8µs | ± | 0.00% | 12.7µs | ± | 0.00% | -1.15% RepeatNew-8 | 162ns | ± | 2.00% | 153ns | ± | 1.00% | -5.58% RepeatIONew-8 | 1.24µs | ± | 1.00% | 1.25µs | ± | 0.00% | 0.83% Bindata-8 | 234ms | ± | 1.00% | 231ms | ± | 0.00% | -1.45% SeparateTestAndAdd-8 | 519ns | ± | 6.00% | 553ns | ± | 3.00% | 6.53% CombinedTestAndAdd-8 | 585ns | ± | 5.00% | 627ns | ± | 6.00% | 7.29% TextMovementBetweenSegments-8 | 376µs | ± | 0.00% | 372µs | ± | 0.00% | -1.17% Growth_MultiSegment-8 | 14.1ms | ± | 0.00% | 14.0ms | ± | 0.00% | -0.84% DirectSend-8 | 923ns | ± | 3.00% | 892ns | ± | 3.00% | -3.33% ParseBigBytes-8 | 1.92µs | ± | 1.00% | 1.94µs | ± | 2.00% | 1.35% Pi/foo=ericlagergren_(Go)/prec=100-8 | 160µs | ± | 1.00% | 158µs | ± | 1.00% | -0.78% Pi/foo=ericlagergren_(GDA)/prec=100-8 | 305µs | ± | 1.00% | 317µs | ± | 1.00% | 4.16% Pi/foo=shopspring/prec=100-8 | 398µs | ± | 0.00% | 430µs | ± | 5.00% | 7.99% Pi/foo=apmckinlay/prec=100-8 | 3.46µs | ± | 0.00% | 3.53µs | ± | 0.00% | 1.83% Pi/foo=go-inf/prec=100-8 | 113µs | ± | 1.00% | 121µs | ± | 3.00% | 7.63% Pi/foo=float64/prec=100-8 | 5.11µs | ± | 0.00% | 5.11µs | ± | 0.00% | -0.02% FastTest2KB-8 | 206ns | ± | 0.00% | 207ns | ± | 0.00% | 0.21% Encoding4KBVerySparse-8 | 14.0µs | ± | 0.00% | 14.2µs | ± | 0.00% | 1.55% OpDiv128-8 | 96.5ns | ± | 2.00% | 107.7ns | ± | 2.00% | 11.59% PendingDemotion10000-8 | 167ns | ± | 0.00% | 171ns | ± | 0.00% | 2.49% PoolBatchLocalInsert10000-8 | 986ms | ± | 2.00% | 969ms | ± | 0.00% | -1.74% GenerateKeyP256-8 | 39.1µs | ± | 0.00% | 39.1µs | ± | 0.00% | 0.16% GenSharedKeyP256-8 | 166µs | ± | 0.00% | 166µs | ± | 0.00% | -0.13% HashimotoLight-8 | 936µs | ± | 2.00% | 962µs | ± | 2.00% | 2.76% CommitAfterHashFixedSize/10K-8 | 14.2ms | ± | 2.00% | 13.8ms | ± | 3.00% | -2.64% DasumMediumUnitaryInc-8 | 1.27µs | ± | 0.00% | 1.28µs | ± | 0.00% | 0.60% LouvainDirectedMultiplex-8 | 15.6ms | ± | 1.00% | 15.3ms | ± | 1.00% | -1.45% Dgeev/Circulant100-8 | 12.7ms | ± | 0.00% | 12.7ms | ± | 0.00% | 0.52% MulWorkspaceDense1000Hundredth-8 | 332ms | ± | 0.00% | 332ms | ± | 0.00% | 0.19% WalkAllBreadthFirstGnp_10_tenth-8 | 4.35µs | ± | 1.00% | 4.15µs | ± | 1.00% | -4.77% WalkAllBreadthFirstGnp_1000_tenth-8 | 10.5ms | ± | 1.00% | 10.1ms | ± | 0.00% | -3.49% Hash8K-8 | 24.8µs | ± | 0.00% | 24.8µs | ± | 0.00% | -0.18% ReplaceShortcodeTokens-8 | 1.73µs | ± | 4.00% | 1.79µs | ± | 6.00% | 3.37% Listener-8 | 1.62µs | ± | 4.00% | 1.64µs | ± | 2.00% | 1.09% ParallelizeUntil/pieces:1000,workers:10,chunkSize:100-8 | 28.5µs | ± | 2.00% | 28.3µs | ± | 0.00% | -0.79% FPAQ-8 | 20.0ms | ± | 0.00% | 20.2ms | ± | 1.00% | 1.09% LZ-8 | 1.19ms | ± | 1.00% | 1.17ms | ± | 1.00% | -1.22% MTFT-8 | 1.02ms | ± | 0.00% | 1.02ms | ± | 0.00% | 0.45% DecodehealingTracker-8 | 1.30µs | ±18% | 1.12µs | ±23% | -13.85% | (p=0.028 | n=10+9) MarshalMsgdataUsageCacheInfo-8 | 87.7ns | ± | 4.00% | 97.5ns | ± | 2.00% | 11.16% ValidateVersionTildeFail-8 | 721ns | ± | 0.00% | 736ns | ± | 1.00% | 2.17% Broker_Open-8 | 139µs | ± | 1.00% | 140µs | ± | 0.00% | 0.57% Broker_No_Metrics_Open-8 | 86.6µs | ± | 1.00% | 86.1µs | ± | 1.00% | -0.58% Run/10k/16-8 | 8.07s | ± | 3.00% | 8.32s | ± | 1.00% | 3.16% Decode/large-doc-8 | 2.86ms | ± | 0.00% | 2.82ms | ± | 1.00% | -1.14% MultiWriteSyncer/2_discarder-8 | 23.4ns | ±31% | 22.0ns | ±28% | -6.21% | (p=0.049 | n=10+10) MultiWriteSyncer/4_discarder-8 | 21.5ns | ± | 1.00% | 21.1ns | ± | 1.00% | -2.10% WriteSyncer/write_file_with_no_buffer-8 | 2.07µs | ± | 5.00% | 1.97µs | ± | 5.00% | -4.48% ZapConsole-8 | 1.03µs | ± | 1.00% | 1.00µs | ± | 1.00% | -2.16% JSONLogMarshalerFunc-8 | 790ns | ± | 1.00% | 783ns | ± | 2.00% | -0.89% ZapJSON-8 | 708ns | ± | 2.00% | 692ns | ± | 1.00% | -2.25% Sampler_Check/7_keys-8 | 12.5ns | ± | 1.00% | 12.9ns | ± | 0.00% | 3.07% Sampler_Check/50_keys-8 | 14.2ns | ± | 2.00% | 14.4ns | ± | 0.00% | 1.42% Sampler_Check/100_keys-8 | 14.3ns | ± | 1.00% | 14.5ns | ± | 0.00% | 1.76% Sampler_CheckWithHook/7_keys-8 | 25.0ns | ± | 1.00% | 24.2ns | ± | 0.00% | -3.21% Sampler_CheckWithHook/50_keys-8 | 27.8ns | ± | 1.00% | 27.6ns | ± | 0.00% | -0.79% Invocation/interpreter/fib_for_20-8 | 3.59ms | ± | 1.00% | 3.79ms | ± | 1.00% | 5.71% Invocation/interpreter/string_manipulation_size_50-8 | 1.65ms | ± | 0.00% | 1.64ms | ± | 1.00% | -0.57% Invocation/interpreter/random_mat_mul_size_20-8 | 11.5ms | ± | 2.00% | 11.1ms | ± | 1.00% | -3.54% Bindata-8 | 29.3MB/s | ± | 1.00% | 29.7MB/s | ± | 0.00% | 1.47% Growth_MultiSegment-8 | 74.3MB/s | ± | 0.00% | 74.9MB/s | ± | 0.00% | 0.85% Hash8K-8 | 330MB/s | ± | 0.00% | 331MB/s | ± | 0.00% | 0.18% DecodehealingTracker-8 | 245MB/s | ±20% | 275MB/s | ±18% | 12.27% | (p=0.043 | n=10+10) Growth_MultiSegment-8 | 1.65MB | ± | 0.00% | 1.65MB | ± | 0.00% | 0.00% HashFixedSize/10K-8 | 6.32MB | ± | 0.00% | 6.32MB | ± | 0.00% | 0.01% Bindata-8 | 5.70k | ± | 0.00% | 5.70k | ± | 0.00% | -0.06%
Bintree span distribution (Left graph considers size class too forming a x-y plot and right graph just looks at distribution for every gc-cycle time wise on the x-axis)
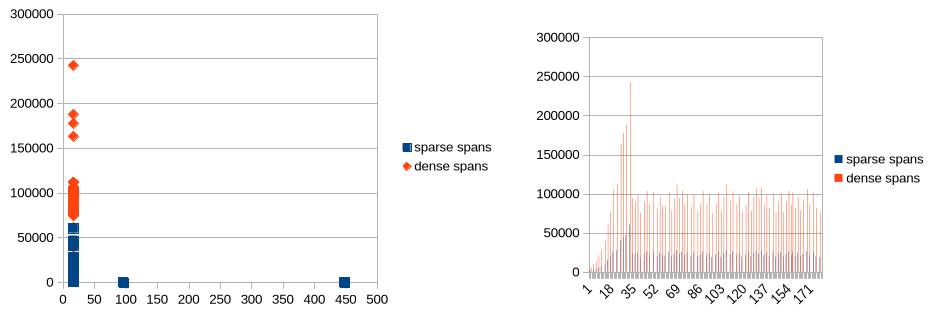
parser, tree, tree2, garbage span distributions (all considering size class too)
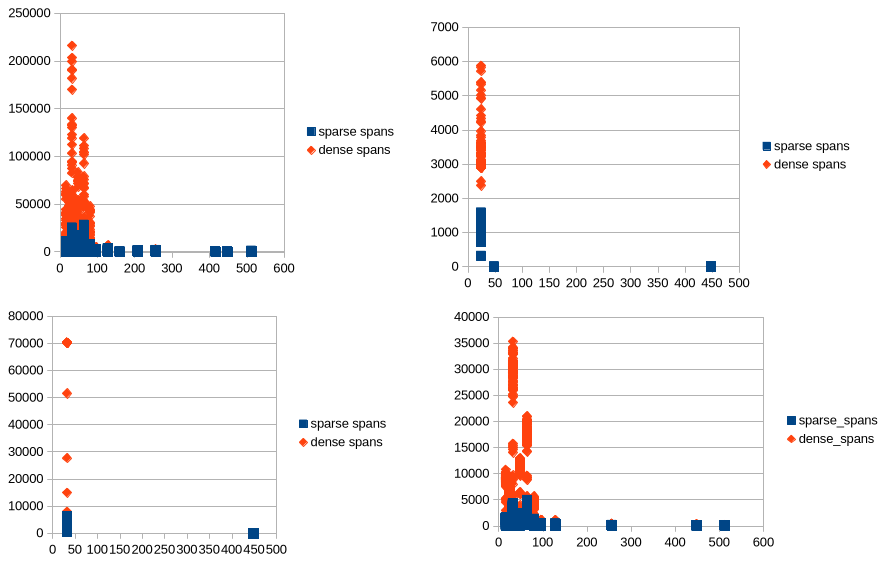
The feature does achieve what it set out to do and the integration with existing API is neat ! @mknyszek
Comment From: archanaravindar
Since there were few more commits to Green Tea recently around speeding up mergeInlineMarks , tested a subset of benchmarks on power10 with go and noted there were slight improvements
Pause time/GC | Regular | Green Tea | Delta(%) -ve: GT is better garbage | 207143 | 221933 | 7.14 bintree | 140839 | 175938 | 24.92 parser | 75789 | 78435 | 3.49 peano | 63401 | 52537 | -17.14 tree | 56340 | 61606 | 9.35 tree2 | 49036 | 44234 | -9.79
99.999 distribution of allocation latency ns | Regular | GT | Delta(%) -ve: GT is better BenchmarkGCLatency/how=stack/fluff=false-8 | 100300 | 102660 | 2.35 BenchmarkGCLatency/how=stack/fluff=true-8 | 87884 | 64131 | -27.03 BenchmarkGCLatency/how=heap/fluff=false-8 | 95800 | 92414 | -3.53 BenchmarkGCLatency/how=heap/fluff=true-8 | 88811 | 77896 | -12.29 BenchmarkGCLatency/how=global/fluff=false-8 | 94312 | 90259 | -4.30 BenchmarkGCLatency/how=global/fluff=true-8 | 82075 | 72221 | -12.01
99.9999 distribution of allocation latency ns | Regular | GT | Delta(%) -ve: GT is better BenchmarkGCLatency/how=stack/fluff=false-8 | 197088 | 167404 | -15.06 BenchmarkGCLatency/how=stack/fluff=true-8 | 242222 | 199347 | -17.70 BenchmarkGCLatency/how=heap/fluff=false-8 | 250127 | 138224 | -44.74 BenchmarkGCLatency/how=heap/fluff=true-8 | 252369 | 143195 | -43.26 BenchmarkGCLatency/how=global/fluff=false-8 | 888192 | 983986 | 10.79 BenchmarkGCLatency/how=global/fluff=true-8 | 884738 | 1012475 | 14.44
Comment From: vadyus
Updated https://github.com/golang/go/issues/73581#issuecomment-3087906771 with gctrace log, and if I read them correctly, they show more CPU time spent with greentea then without
Comment From: mknyszek
@archanaravindar Thanks!
As a top-level comment on your results, a lot of the benchmarks you're reporting are microbenchmarks, and many of these benchmarks can get slower because anything changed. (Many are tight loops sensitive to just how the loop is laid out in placed in the binary.) Many of these benchmarks are still useful, but there are quite a few in there that need to be cleaned up or removed. There may be genuine regressions in there -- I did try to go through as many of the regressions as I could, and most of them disappeared when I started passing -ldflags=-randlayout=N, but it's totally possible I missed something. I also consulted https://perf.golang.org/dashboard and looked at the history of the benchmarks. Some of the ones that are sensitive in this way are very clearly so in the history, moving semi-randomly with seemingly unrelated changes.
I would suggest running some of the more end-to-end benchmarks we have, for example with the Sweet tool. They're not perfect benchmarks by any means, but tend to exercise more diverse codepaths that make for more stable and reliable results. (I'm not sure all of them work on power10, but you can just try them out with -short and see what runs. It should be most of them.)
In only one case(tree), we see Green tea gc has about 4-5% more number of collections
Also, IIRC some of the other regressions were in benchmarks that almost purely allocate in a loop, and floating garbage would acts as a ballast. If the GC gets faster, it can appear to run more frequently because this ballast is smaller. This typically only affects microbenchmarks, and part of the problem is that microbenchmarks don't report memory footprint (it's often meaningless), but GC overhead is tightly coupled to memory use. Green Tea can even still be faster in these cases, also! Several of the microbenchmarks I tried that were faster also executed more cycles.
It appears that the atomic instructions are used more in green tea compared to regular tea (presumably because operations are happening at the span level rather than the object level?) so we were very relieved to see that it does not impact performance to a large extent on power10.
I think this is expected. There are probably more atomic operations, especially in some benchmarks, but they're should be much less contended.
Comment From: mknyszek
Updated #73581 (comment) with gctrace log, and if I read them correctly, they show more CPU time spent with greentea then without
Indeed. The difference is so large that I have to ask: is there any chance those files are named backwards? :) Or perhaps the pprof results were backwards? (I make this mistake all the time. Measurement error is a hard problem. :P)
Also, I see you've got GOMAXPROCS=128. Generally I've seen Green Tea do far better at high GOMAXPROCS, with gaps on the same order as you're seeing here, just backwards (that is, Green Tea was faster). But maybe there's some scalability bottleneck you're hitting that nothing else so far that I've tried has hit? 🤷
Assuming everything is as it should be, what's the output for GODEBUG=gctrace=2? That might help explain what's going on, and will also help disambiguate the GC traces.
Comment From: vadyus
Updated #73581 (comment) with gctrace log, and if I read them correctly, they show more CPU time spent with greentea then without
Indeed. Any chance those files are named backwards? :) Or perhaps the pprof results were backwards? (I make this mistake all the time. Measurement error is a hard problem. :P)
Assuming everything is as it should be, what's the output for
GODEBUG=gctrace=2? That might help explain what's going on.
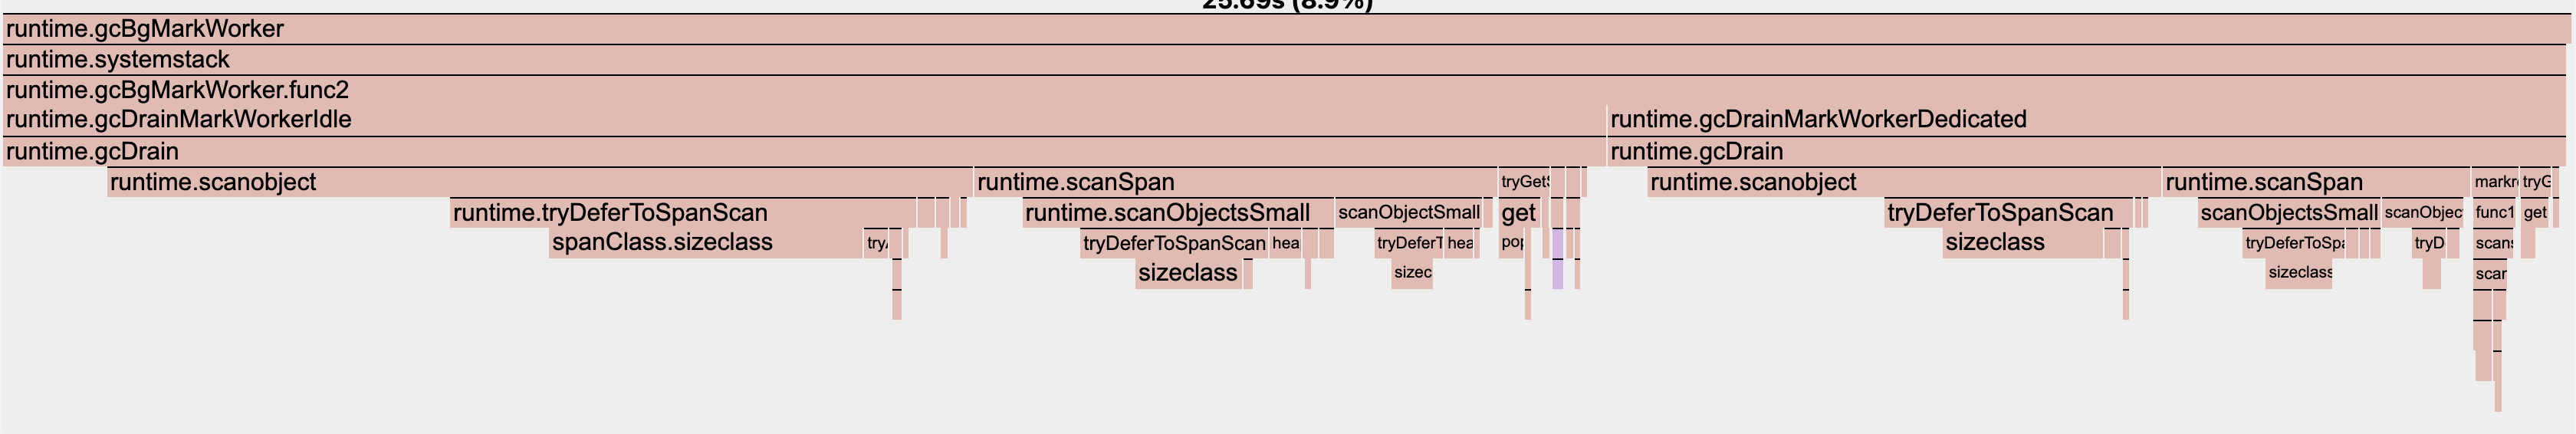
I did double check it, because those gctrace results seemed weird to me. Here is pprof screenshot from an instance where runtime.gcBgMarkWorker cumulatively lower (runtime.scanSpan should exist only with greenTea as far as I understood).
gctrace=2 logs: greentea.log nogreentea.log
Comment From: mknyszek
Yeah, the difference looks real. I'm surprised there's such a huge gap between the gctrace and what the profile is saying. Usually when this happens, the discrepancy is off-CPU time. Like a thread blocked on a runtime-internal mutex. Can you take a mutex profile before and after? (Those include runtime-internal locks.)
Comment From: vadyus
Yeah, the difference looks real. I'm surprised there's such a huge gap between the gctrace and what the profile is saying. Usually when this happens, the discrepancy is off-CPU time. Like a thread blocked on a runtime-internal mutex. Can you take a mutex profile before and after? (Those include runtime-internal locks.)
GreenTea
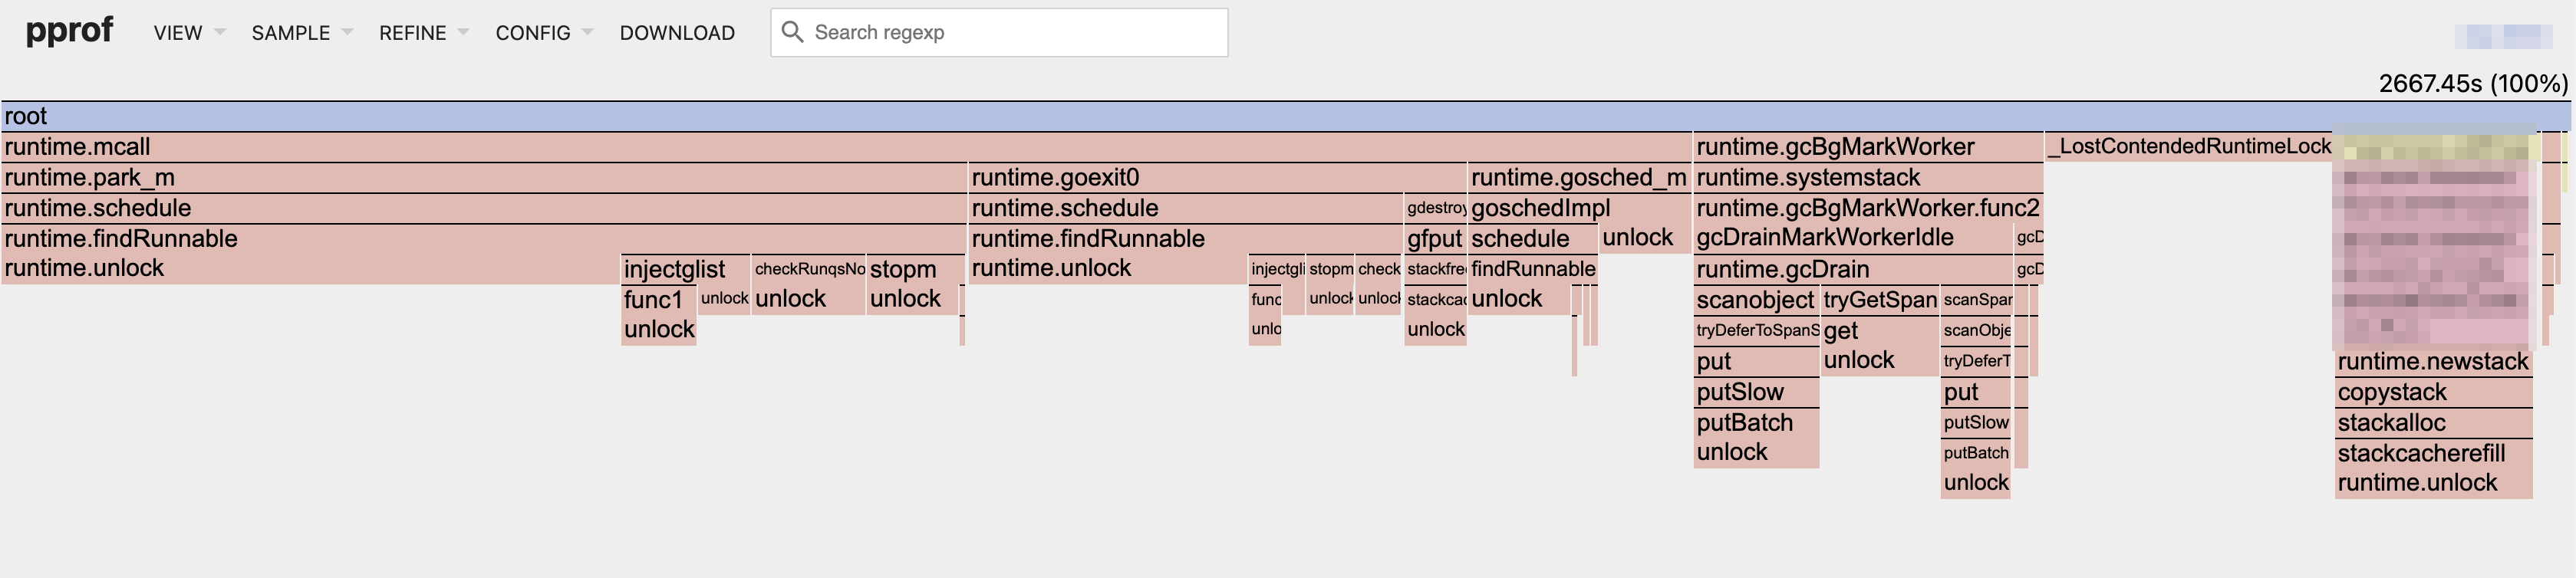
No GeenTea
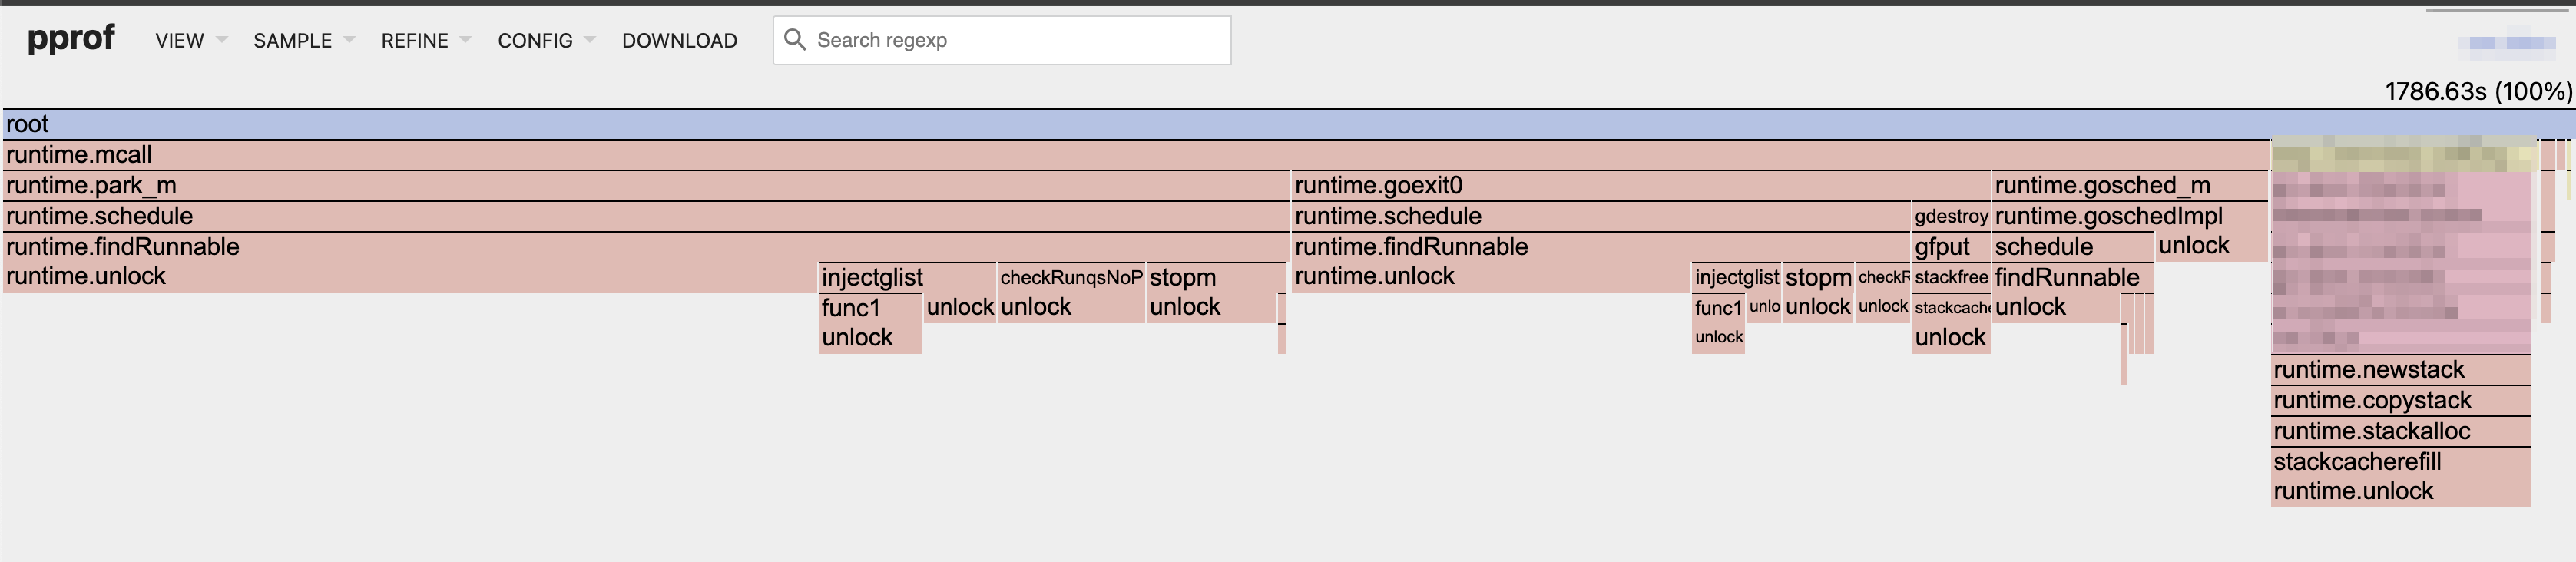
Wondering what is that runtime._LostContendedRuntimeLock that looks like a suspect :)
Comment From: mknyszek
That's very odd, there aren't many cases where we emit _LostContendedRuntimeLock in Go 1.25 (https://cs.opensource.google/go/go/+/master:src/runtime/mprof.go;l=695;drc=281cfcfc1b15fbb87fd32660b0a1d50be996d108). The lock that I had in mind is already visible under runtime.gcBgMarkWorker (used by putBatch). I guess the lost cycles must be coming from the dedicated mark worker path, given that this profile is almost exclusively pointing the finger at idle mark workers. I'll try to see what we might be doing there so that we don't lose that contention anymore.
(Note: increase in apparent lock contention is not necessarily a bad thing. It's true pre-Green-Tea-GC didn't have a lock, but instead had frequent, unmeasured contention on shared atomic variables, which burned CPU way more.)
I guess I shouldn't be surprised that there's contention on this locked global list with GOMAXPROCS=128. FWIW, I do think this is sufficient to explain the discrepancy.
I think there are some simple things we can do. IIRC there's still some low-hanging fruit in these codepaths wherein we could hold the lock for shorter periods. We can also consider making the per-P queues deeper. @aclements at some point mentioned they were surprised the queues didn't have to be deeper than how I implemented them, and it's possible that they really should be deeper in your workload. Deeper P-local queues means fewer spans spilled to the locked global queue. I see a non-trivial amount of time in scanObjectSmall which does suggest that Green Tea might not apply so well to some parts of your heap. Single-object span scans tend to eat up a lot of queue space.
I'll see what I can do. Would you be willing to try some work-in-progress changes, @vadyus?
Comment From: vadyus
I'll see what I can do. Would you be willing to try some work-in-progress changes, @vadyus?
Yep, sure
Comment From: archanaravindar
I would suggest running some of the more end-to-end benchmarks we have, for example with the Sweet tool. They're not perfect benchmarks by any means, but tend to exercise more diverse codepaths that make for more stable and reliable results. (I'm not sure all of them work on power10, but you can just try them out with
-shortand see what runs. It should be most of them.)
Hi Michael, i tried to run the sweet benchmarks on power10, looks like except cockroachdb which didnt seem to run on power, i was able to get measurement data for the others after disabling it on powerpc. Except for BleveIndexBatch100, All other benchmarks show a very small difference between regular and Greentea on power10 (in the range -5 to 5%) Same machine config used as earlier sweet version v0.3.0 commit id: 5aff1006c1d94600a078c1cae9aea729dc69febd
(Old value : Regular GC, New Value: GreenTea, +ve delta Regular is better) Time/op | Old Value | New Value | Delta | p-value BleveIndexBatch100-8 | 4.95s ± 2% | 5.67s ± 2% | +14.52% | (p=0.000 n=10+10) EtcdPut-8 | 40.1ms ± 1% | 40.4ms ± 2% | +0.92% | (p=0.481 n=10+10) EtcdSTM-8 | 222ms ± 1% | 224ms ± 1% | +0.82% | (p=0.009 n=10+10) GopherLuaKNucleotide-8 | 23.8s ± 0% | 23.8s ± 0% | -0.31% | (p=0.003 n=9+10) MarkdownRenderXHTML-8 | 208ms ± 1% | 213ms ± 1% | +2.40% | (p=0.000 n=10+10) Tile38QueryLoad-8 | 726µs ± 1% | 708µs ± 1% | -2.40% | (p=0.000 n=10+10)
Average-RSS- bytes | Old Value | New Value | Delta | p-value BleveIndexBatch100-8 | 183MB ± 3% | 182MB ± 1% | ~ | (p=0.481 n=10+10) EtcdPut-8 | 97.0MB ± 4% | 97.7MB ± 6% | ~ | (p=0.481 n=10+10) EtcdSTM-8 | 89.1MB ± 4% | 88.3MB ± 2% | ~ | (p=0.604 n=10+9) GopherLuaKNucleotide-8 | 32.7MB ±10% | 33.2MB ± 8% | ~ | (p=0.631 n=10+10) MarkdownRenderXHTML-8 | 16.8MB ± 0% | 17.8MB ± 6% | +6.25% | (p=0.021 n=6+10) Tile38QueryLoad-8 | 6.46GB ± 1% | 6.17GB ± 1% | -4.53% | (p=0.000 n=10+10)
Peak-RSS-bytes | Old Value | New Value | Delta | p-value BleveIndexBatch100-8 | 255MB ± 6% | 255MB ± 4% | ~ | (p=0.516 n=10+10) EtcdPut-8 | 141MB ± 5% | 141MB ± 6% | ~ | (p=0.920 n=10+10) EtcdSTM-8 | 114MB ± 6% | 113MB ± 6% | ~ | (p=0.838 n=10+10) GopherLuaKNucleotide-8 | 35.2MB ±12% | 38.0MB ±20% | ~ | (p=0.072 n=10+10) MarkdownRenderXHTML-8 | 16.8MB ± 0% | 18.2MB ± 8% | +8.75% | (p=0.008 n=8+10) Tile38QueryLoad-8 | 6.64GB ± 1% | 6.30GB ± 1% | -5.05% | (p=0.000 n=9+10)
Peak-VM-bytes | Old Value | New Value | Delta | p-value BleveIndexBatch100-8 | 2.31GB ± 0% | 2.31GB ± 0% | +0.01% | (p=0.039 n=10+8) EtcdPut-8 | 12.1GB ± 0% | 12.1GB ± 0% | ~ | (p=0.522 n=10+9) EtcdSTM-8 | 12.1GB ± 0% | 12.1GB ± 0% | ~ | (p=1.000 n=9+8) GopherLuaKNucleotide-8 | 1.26GB ± 0% | 1.26GB ± 0% | +0.02% | (p=0.000 n=10+8) MarkdownRenderXHTML-8 | 1.26GB ± 0% | 1.26GB ± 0% | ~ | (p=0.541 n=6+10) Tile38QueryLoad-8 | 7.88GB ± 1% | 7.54GB ± 1% | -4.29% | (p=0.000 n=10+10)
p50-latency-ns | Old Value | New Value | Delta | p-value EtcdPut-8 | 38.1M ± 3% | 38.5M ± 2% | ~ | (p=0.052 n=10+10) EtcdSTM-8 | 164M ± 2% | 165M ± 1% | ~ | (p=0.165 n=10+10) Tile38QueryLoad-8 | 274k ± 0% | 265k ± 0% | -3.04% | (p=0.000 n=10+10)
p90-latency-ns | Old Value | New Value | Delta | p-value EtcdPut-8 | 59.0M ± 3% | 58.8M ± 3% | ~ | (p=0.912 n=10+10) EtcdSTM-8 | 446M ± 1% | 450M ± 1% | +0.89% | (p=0.023 n=10+10) Tile38QueryLoad-8 | 1.33M ± 1% | 1.33M ± 0% | -0.40% | (p=0.017 n=10+9)
p99-latency-ns | Old Value | New Value | Delta | p-value EtcdPut-8 | 80.7M ± 9% | 80.0M ± 6% | ~ | (p=0.912 n=10+10) EtcdSTM-8 | 902M ± 2% | 911M ± 2% | ~ | (p=0.089 n=10+10) Tile38QueryLoad-8 | 7.26M ± 1% | 7.34M ± 2% | +1.13% | (p=0.004 n=9+10)
Ops/s | Old Value | New Value | Delta | p-value EtcdPut-8 | 24.0k ± 2% | 23.8k ± 2% | -0.88% | (p=0.028 n=10+10) EtcdSTM-8 | 4.46k ± 1% | 4.42k ± 1% | -0.89% | (p=0.003 n=10+10) Tile38QueryLoad-8 | 8.27k ± 1% | 8.47k ± 1% | +2.46% | (p=0.000 n=10+10)
Including biogo-igor and biogo-krishna results which ran after a minor tweak in the code
| biogo-igor | Old value | New Value | Change | p-value |
|---|---|---|---|---|
| Execution Time (ns/op) | 16.97 ± 0% | 17.45 ± 0% | +2.80% | (p=0.000, n=10+10) |
| Average RSS Memory | 60.01Mi ± 2% | 59.76Mi ± 2% | - | (p=0.631, n=10+10) |
| Peak RSS Memory | 81.25Mi ± 3% | 81.84Mi ± 3% | - | (p=0.617, n=10+10) |
| Peak VM Memory | 1.239Gi ± 0% | 1.239Gi ± 0% | - | (p=0.862, n=10+10) |
| biogo-krishna | Old value | New value | Change | p-value |
|---|---|---|---|---|
| Execution Time (ns/op) | 12.99 ± 1% | 13.17 ± 0% | +1.44% | (p=0.002, n=10+10) |
| Average RSS Memory | 4.032Gi ± 0% | 4.029Gi ± 0% | -0.07% | (p=0.007, n=10+10) |
| Peak RSS Memory | 4.107Gi ± 0% | 4.107Gi ± 0% | - | (p=0.810, n=10+10) |
| Peak VM Memory | 5.308Gi ± 0% | 5.308Gi ± 0% | +0.00% | Yes (p=0.020, n=10+10) |
Comment From: gopherbot
Change https://go.dev/cl/665495 mentions this issue: runtime: use scan kernels in scanSpan [green tea]
Comment From: gopherbot
Change https://go.dev/cl/655280 mentions this issue: internal/runtime/gc/scan: import scan kernel from gclab [green tea]
Comment From: mknyszek
@vadyus Apologies for the delay. I've been getting side-tracked by very many things. I should hopefully have something concrete for you to try by the end of the week.
Comment From: mknyszek
@archanaravindar Thanks! Apologies to you as well for the late reply.
Hi Michael, i tried to run the sweet benchmarks on power10, looks like except cockroachdb which didnt seem to run on power, i was able to get measurement data for the others after disabling it on powerpc.
Yep, that's about what I would expect.
Except for BleveIndexBatch100, All other benchmarks show a very small difference between regular and Greentea on power10 (in the range -5 to 5%) Same machine config used as earlier
None of the Sweet benchmarks spend more than 10% of their time in the garbage collector, so even small overall changes tend to reflect a relatively large change in GC overhead (given that it's only the GC that's changing). I suspect that's what's happening with Tile38, and the results there look about the same as they do on linux/amd64.
The magnitude of the regression with BleveIndexBatch100 is surprising, however. That benchmark did give me trouble early on, and it motivated the single-object-span-scan optimization described in the original post of this issue. That being said, it also has a tendency to be overly sensitive to memory management changes. Nevertheless, it deserves a closer look.
Is this a power10 machine that's in the Go builder fleet? Could I reproduce this myself with a gomote? If not (or if you just have time :)), it would be really helpful to get (1) a CPU profile and (2) a GC trace (GODEBUG=gctrace=2) for that benchmark, both with and without Green Tea. If you need any help setting that up in Sweet feel free to email me. The instructions should be in sweet help run but the documentation is far from perfect.