Hello!
I'm encountering some issues when trying to apply a logarithmic axis in Apache Superset while rendering charts.
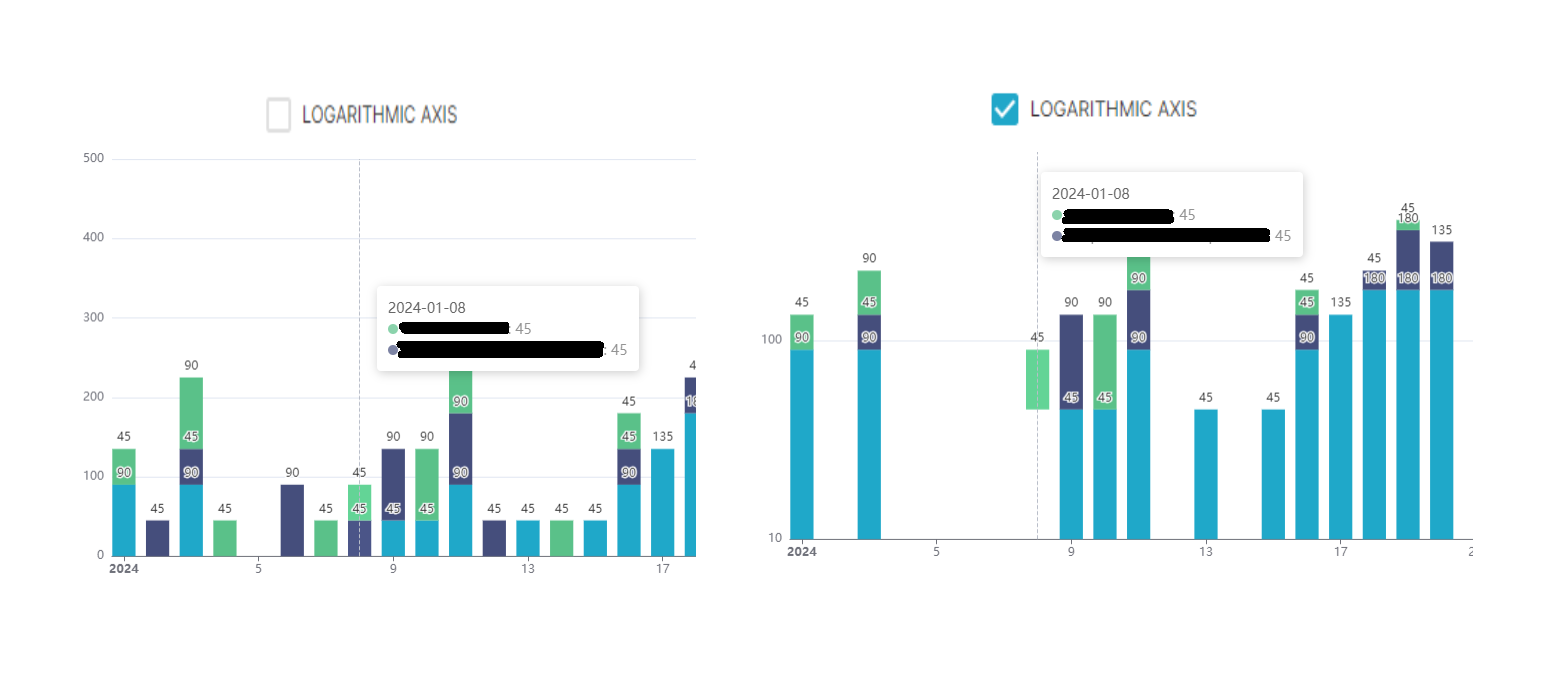
1- Stacked bar charts: When applying the logarithmic axis, I notice blank spaces at the bottom of the chart. I've attached a photo where the problem can be better observed. In the image, let's take the example of the data from 2024-01-08: without applying the logarithmic axis, we see two data sets, one in green and one in blue, both with a value of 45. However, when applying the logarithmic axis, only the green set is displayed, and not the blue one, although both values appear in the tooltip. Additionally, I've noticed that in the three previous bars where we have unique data, they disappear when applying the logarithmic axis.
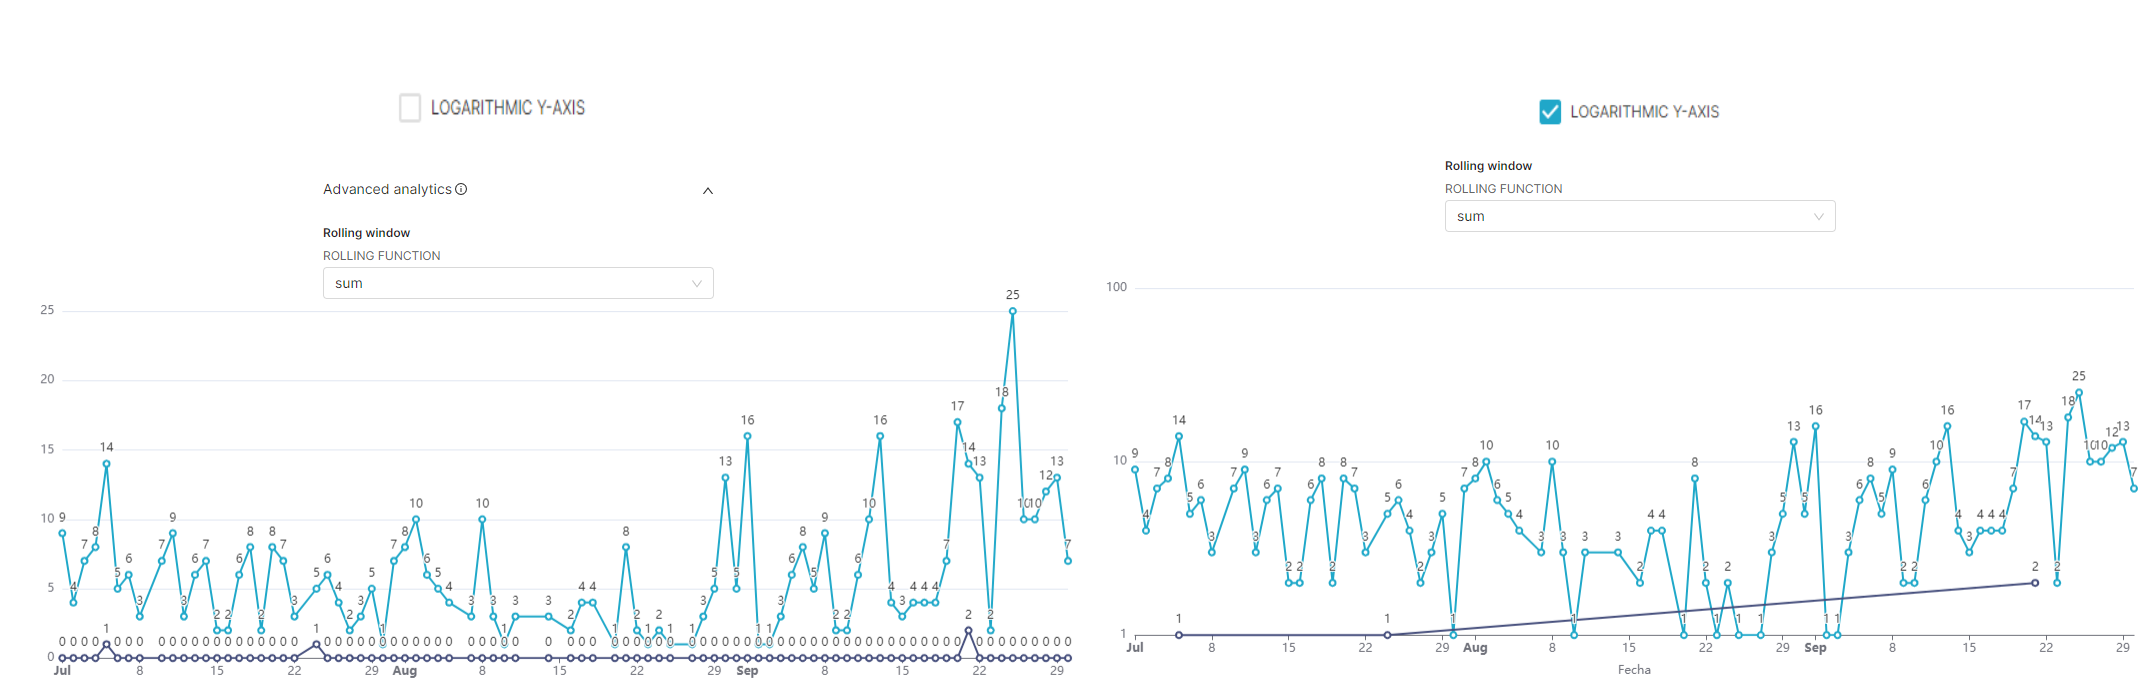
2- Time series line charts: I typically utilize the advanced analytics sum of rolling function, as seen in the attached image, to represent all cumulative values and avoid displaying only a single point when data is available. However, I've encountered the limitation that this function does not behave the same when the logarithmic axis is applied. In the first chart of the image, without the logarithmic axis, each data point displays a value of 0 if there is no data, or the corresponding value if there is, connected by a line. However, when applying the logarithmic axis, as shown in the second image, only the points with data are connected by lines. In fact, the line is incomplete because it does not reach the beginning and end. It's not as if the sum function is not being applied, because in that case, individual points are displayed, but it's also not the solution I'm looking for. Is it possible that I'm mistaken in my approach, or is this simply a combination that cannot be achieved? Is there any specific reason why this combination might not be feasible?
Any insights or suggestions on how to address these issues would be greatly appreciated! Thank you!
Comment From: rusackas
Sorry this has been quiet for upward of a year. Are you still facing this issue? We might need to close it as stale to have a more actionable backlog if it's not happening in currently supported versions (4.x+)
@dosu-bot
Comment From: aprendizlaura
Hi! @rusackas I hadn't tried for quite some time, and I've been running a couple of tests since I read your message. In the first case, with bar charts, the issue is resolved. However, with the time series line chart, it is not. Every time I try to display a chart that has null values at some points, they only appear as null if I don't have the logarithmic axis enabled.
Comment From: rusackas
Looks like this is working fine in current versions, for bar (stacked or otherwise), and line. Tested both with nulls. Can't share screenshots, but all looks good!