Superset 3.1.0rc2:
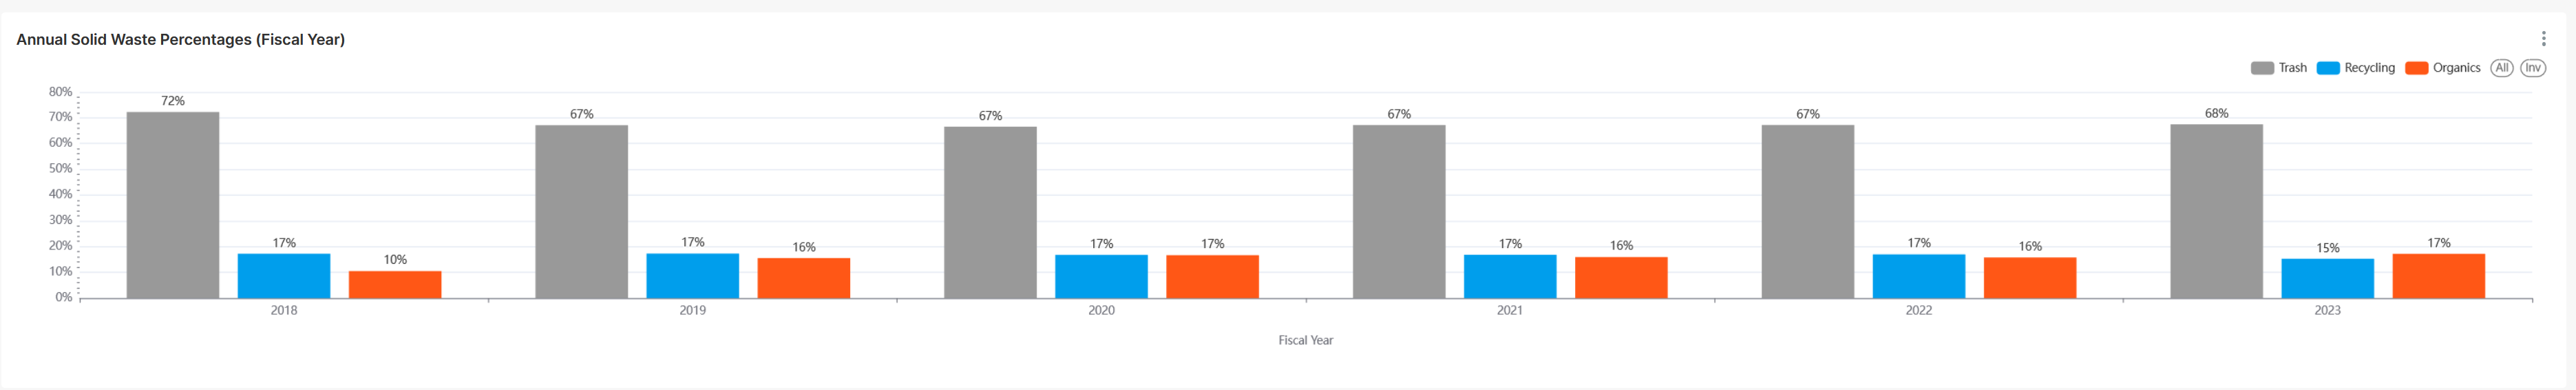
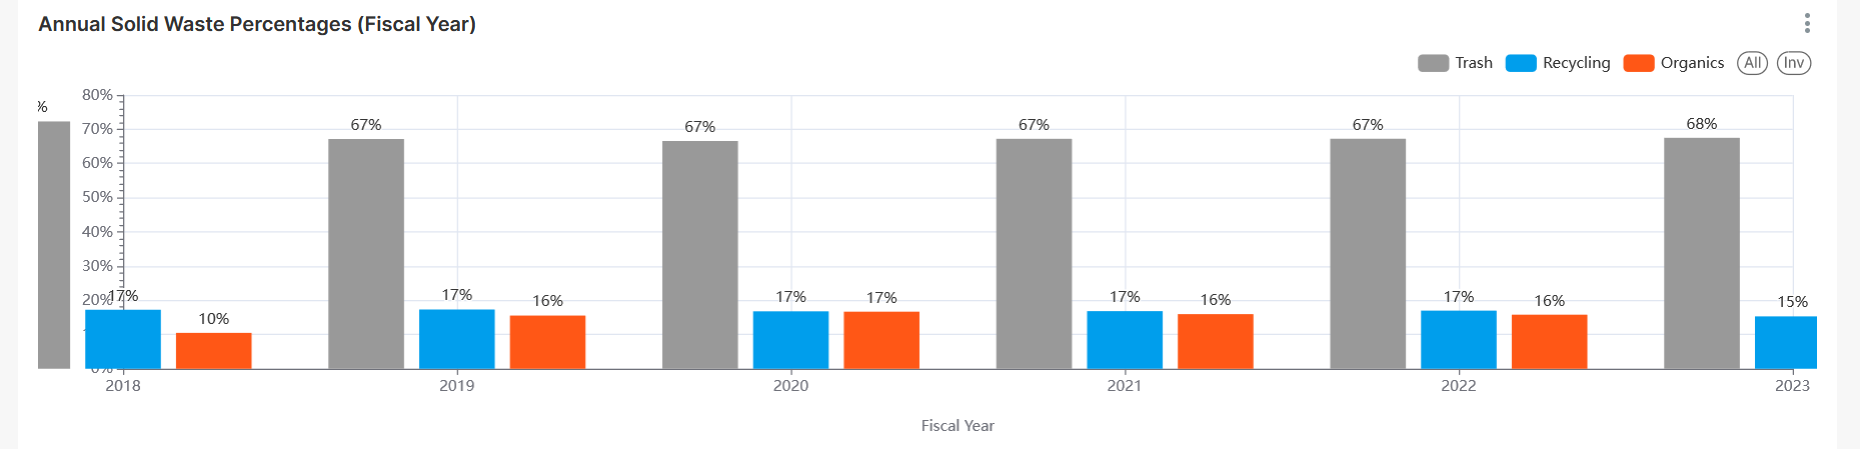
How it looks previously in 3.0.0:
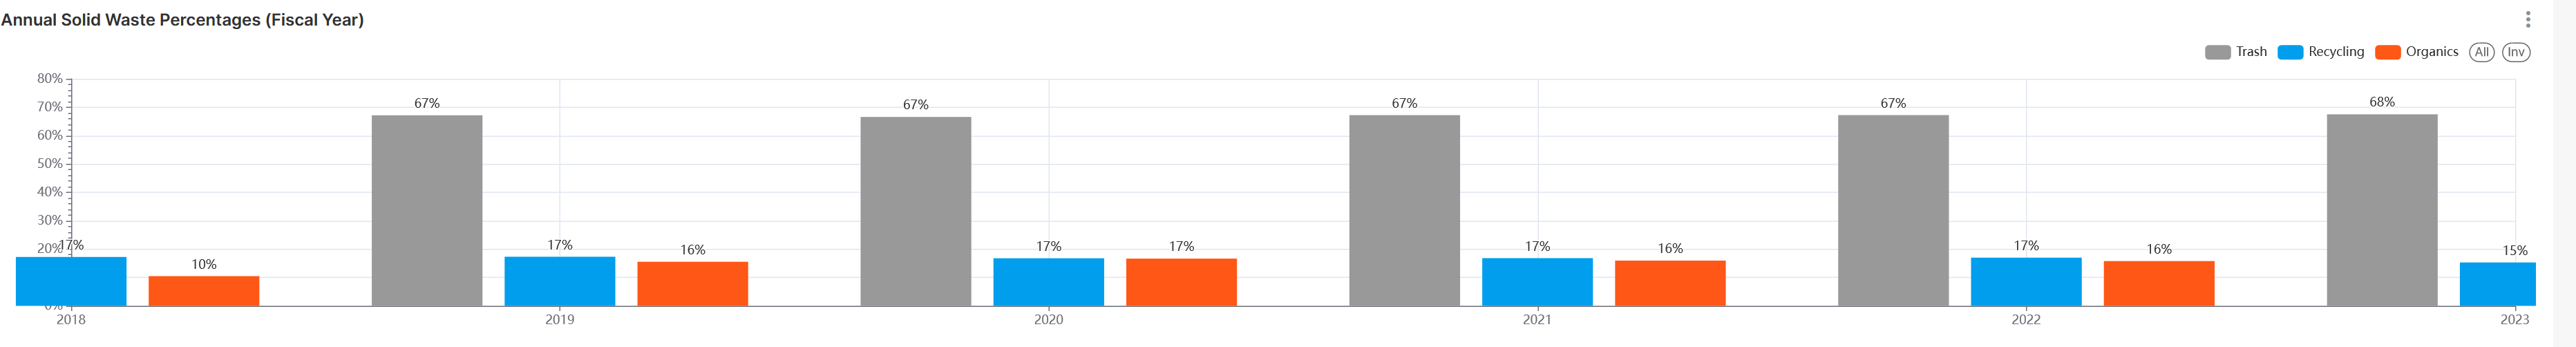
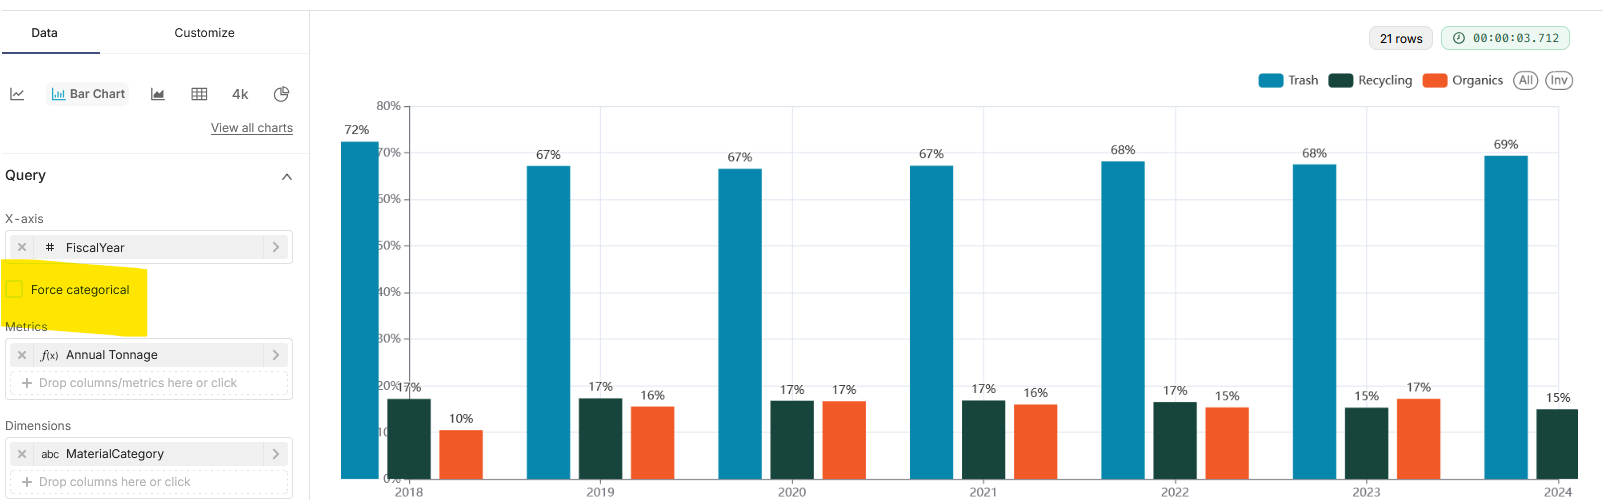
Here's the chart config in 3.1.0rc2:
Again there's a numeric x-axis, maybe broken by #26215 ?
Comment From: michael-s-molina
It looks like that's how ECharts displays the bar chart with numerical x-axis when min is defined as dataMin.
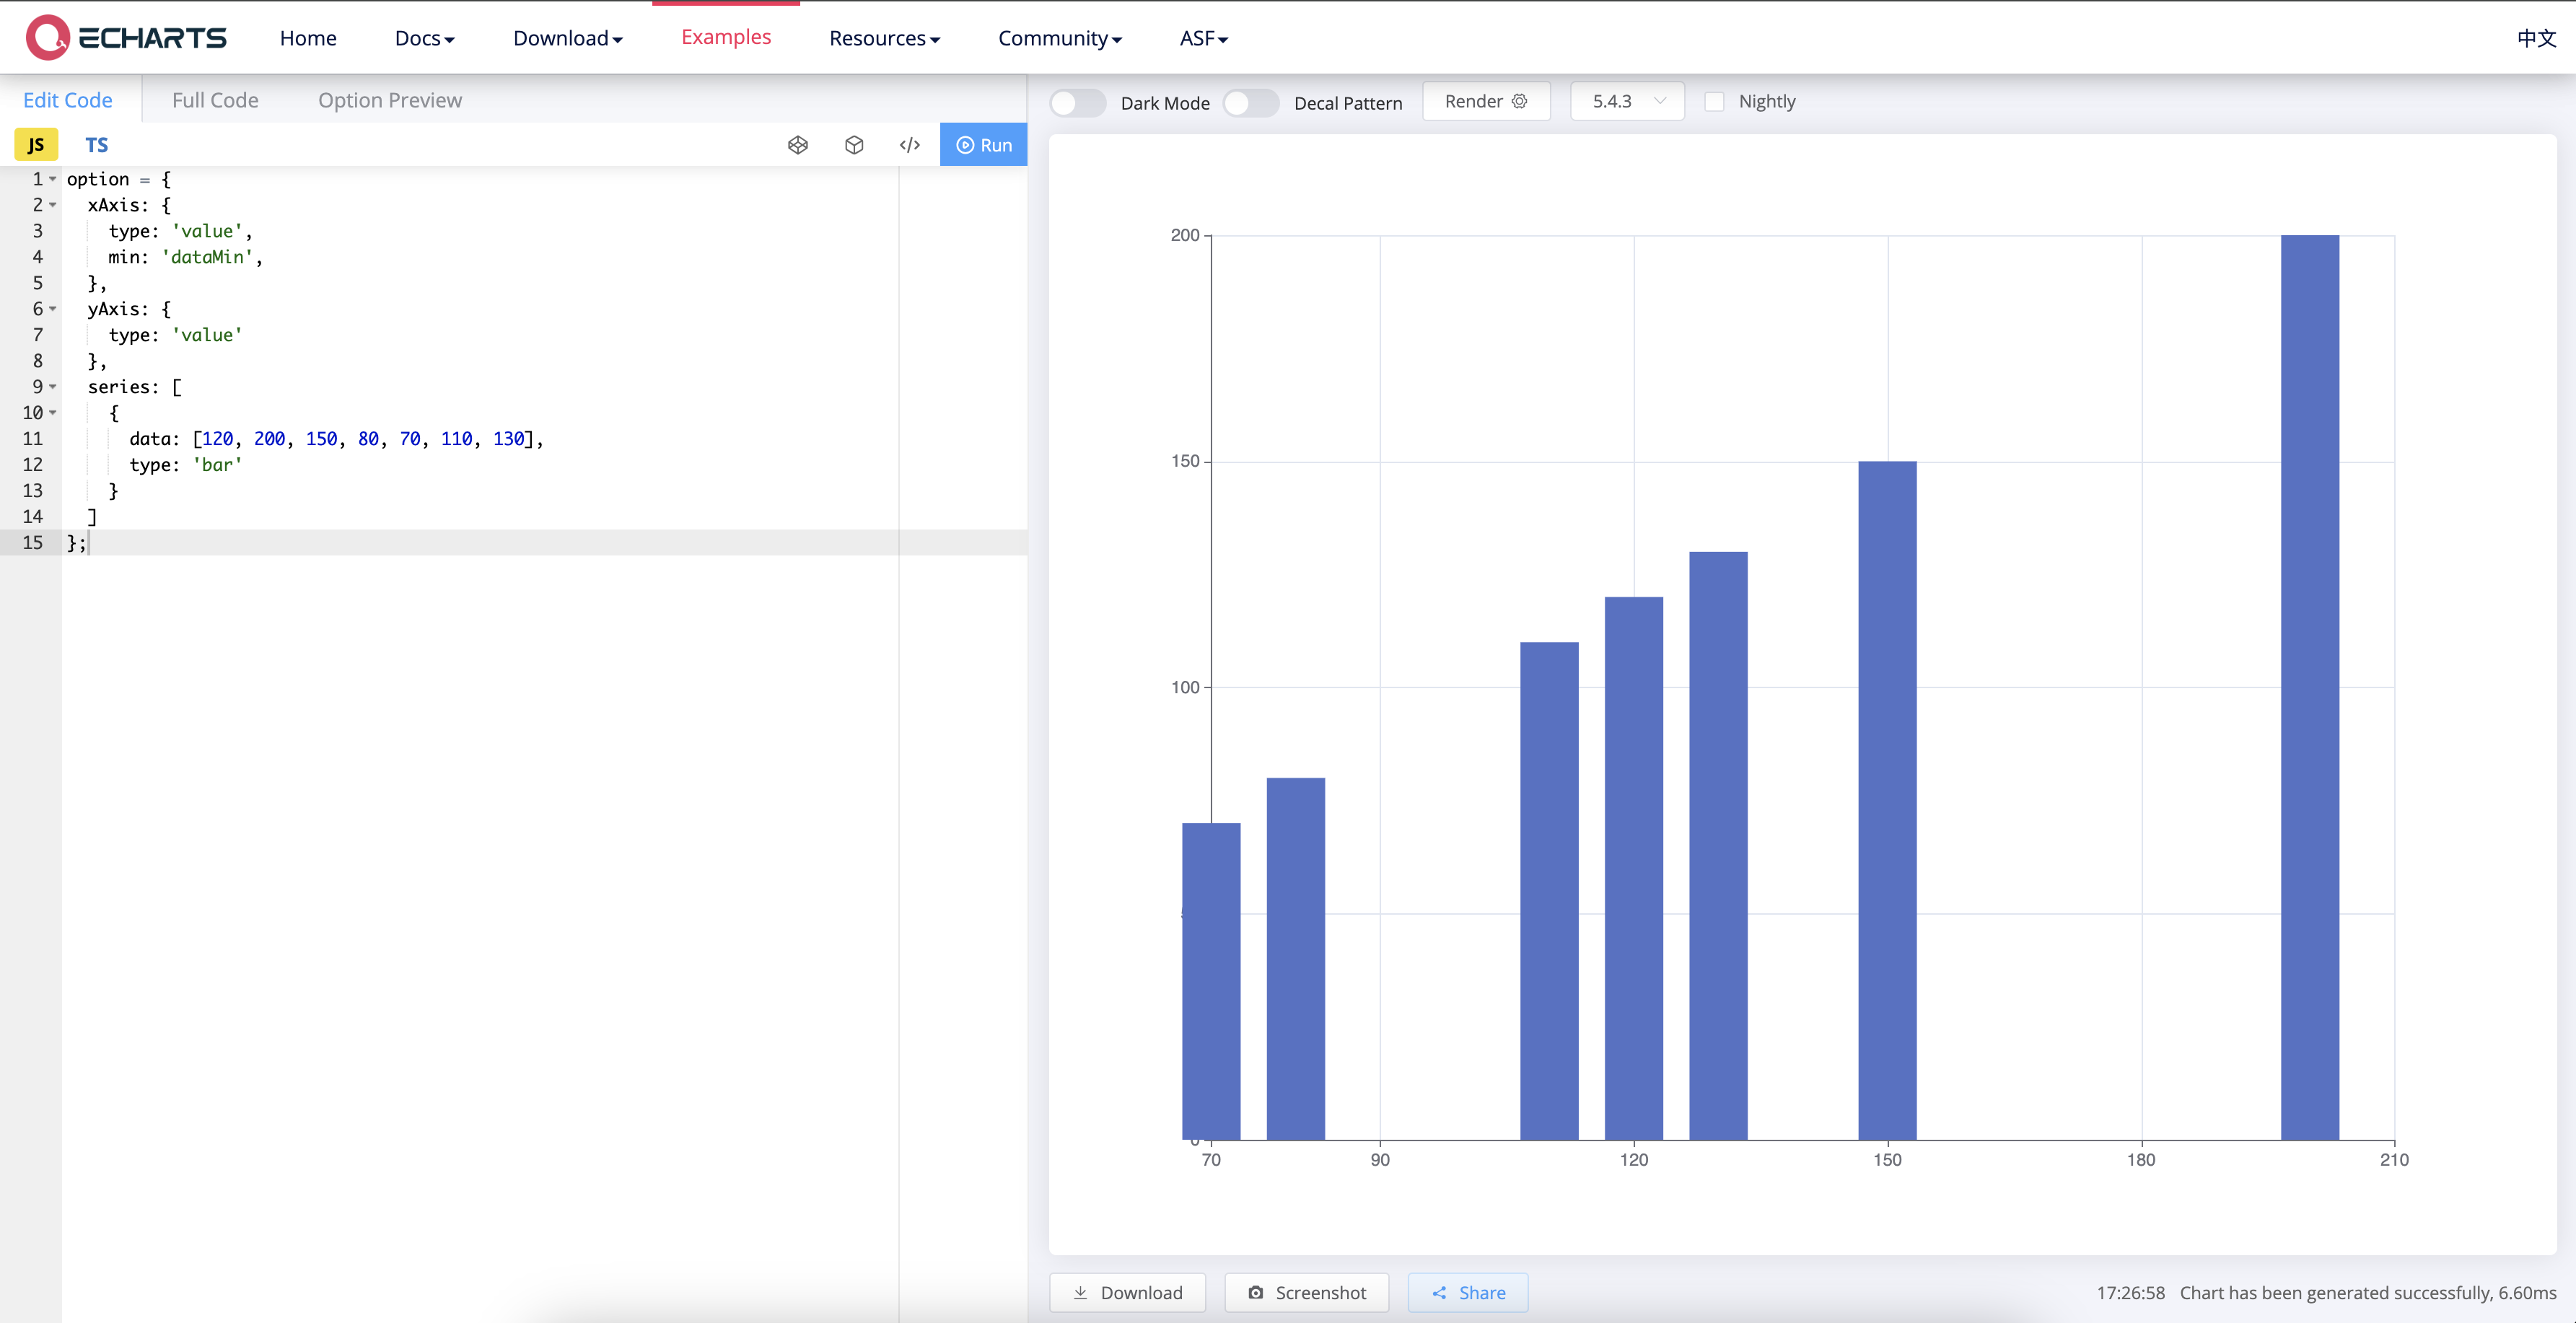
I searched ECharts docs but I was not able to find a configuration that would fix this. It looks like you need to manually set bounds.
Comment From: sfirke
Thanks for looking into this, I'm sorry to hear there's nothing in ECharts to help with this. This wasn't a problem in 3.0.0 so maybe there's a way forward? It's an unfortunate regression.
Manually set bounds don't provide a satisfactory experience here. If I set 2017 as my x-min I get weird whitespace and x-min = 2018 gets me the same as the bad chart I posted. 2017.5 looks okay but creates a silly "2017.5" label, and anyway if my data values are subject to change I would have to keep changing the bounds.
I think my best way forward for now is to cast the x-axis variable to a categorical (varchar). But I would love to see the 3.0.0 behavior return.
Comment From: michael-s-molina
@villebro do you think there's something we can do here?
But I would love to see the 3.0.0 behavior return.
@sfirke This would bring back the bug of treating numerical values as categories.
Comment From: sfirke
~~@michael-s-molina is that bug documented / can you link to it? 🙏~~ EDIT: I see the regression you referenced, #26034
Comment From: michael-s-molina
[Bug] Bar chart item overlap grid
Comment From: sfirke
This is persisting for me in 3.1.0rc3:
Comment From: michael-s-molina
@villebro It looks like scale will not be sufficient and we'll need to submit a fix to ECharts to unblock the releases.
Comment From: villebro
@michael-s-molina @sfirke IIUC, the plan was to add a note to UPDATING informing users that Superset won't automatically convert numerical x-axes to categorical, and that they should be manually cast to categorical to get the previous appearance? I feel blocking the release in anticipation of getting this improvement into ECharts first will be excessive. Therefore, if we really do feel like numerical x-axis support is too lacking in the current state, we should probably just roll back to always using categorical x-axis until the upstream change is in place?
Comment From: sfirke
I had mistakenly thought this issue was fixed so thank you for clarifying. As it's not, can we leave it open?
I agree this should not hold up the release of 3.1.0. If we can't fix this without changes in ECharts then it's a matter of which bug is better to live with, this or #26034. I think we keep this one, because there is the workaround of casting the variable to varchar (which I tested and works). I can cast the variables and replace as users report issues.
Thank you both for working on this. I noticed that compared to rc2, this only affects an unstacked bar chart with a dimension - when I stack it, it looks good in 3.1.0rc3. So there seems to be have been progress from the screenshots posted above by @michael-s-molina and in 26269 by @villebro showing single bars spilling over the sides.
Comment From: michael-s-molina
I think we keep this one, because there is the workaround of casting the variable to varchar (which I tested and works). I can cast the variables and replace as users report issues.
Makes sense.
As it's not, can we leave it open?
Yes. The context in this discussion will also be useful for folks when they find this problem.
Comment From: michael-s-molina
For anyone reading this thread, here's the summary about this issue:
There's a bug in ECharts when displaying numerical x-axis in bar charts. We'll work with the ECharts team to provide a solution.
While the solution is not available, you can follow the instructions in UPDATING.md
https://github.com/apache/superset/issues/26034: Fixes a problem where numeric x-axes were being treated as categorical values. As a consequence of that, the way labels are displayed might change given that ECharts has a different treatment for numerical and categorical values. To revert to the old behavior, users need to manually convert numerical columns to text so that they are treated as categories. Check https://github.com/apache/superset/issues/26159 for more details.
or use the x-axis truncation controls when applicable.
Comment From: sfirke
New fix method: in 3.0.3+ (where this problem first appears), users don't have to manually convert numerical columns to text - there is now a "force categorical" checkbox that instantly applies the fix to a chart 🎉 Implemented in https://github.com/apache/superset/pull/26404.
Comment From: rusackas
This still seems to be the case, and now I'm wondering if we should just detect numeric axes and automatically "force categorical" in these instances.
Comment From: rumbin
Wouldn't this bring back #26034?
Comment From: rusackas
Oh... good question... probably so. :/
Comment From: rusackas
Is this still happening in 4.1.1?
Comment From: sfirke
Yes, here it is in 4.1.2rc1:
The "force categorical" still works as a workaround. I see no action in the linked eCharts issue so it makes sense this persists in Superset.
Comment From: rusackas
Did 5.0 fix it? 🤞