I cannot correctly graph a rolling average on resampled data.
How to reproduce the bug
- Add this CSV file as a dataset: demo.csv
- Create a "Time-series Line Chart" based on the dataset provided
- Set the metric to be "AVG(value)"
- At this stage, if you click "Update chart" you'll see a straight line (y=5). Note, for example, there is no value for 2000-01-03, as expected.
- Open "Advanced Analytics"
- From the resampling rules, select "1 calendar day frequency"
- From fill method, select "Zero imputation" (or "Sum values", they both give the same outcome)
- If you update the chart now, you will see many days with zero values. The line is no longer the simple y=5. This is as expected.
- Select "mean" from as the rolling window function.
- Set period and min periods to, say, 5.
- Update the chart
- Note that graph is not a smooth curve, but rather has values at y=5 and y=0:
Expected results
I expected to see a smooth curve, with values between zero and 5, similar to:
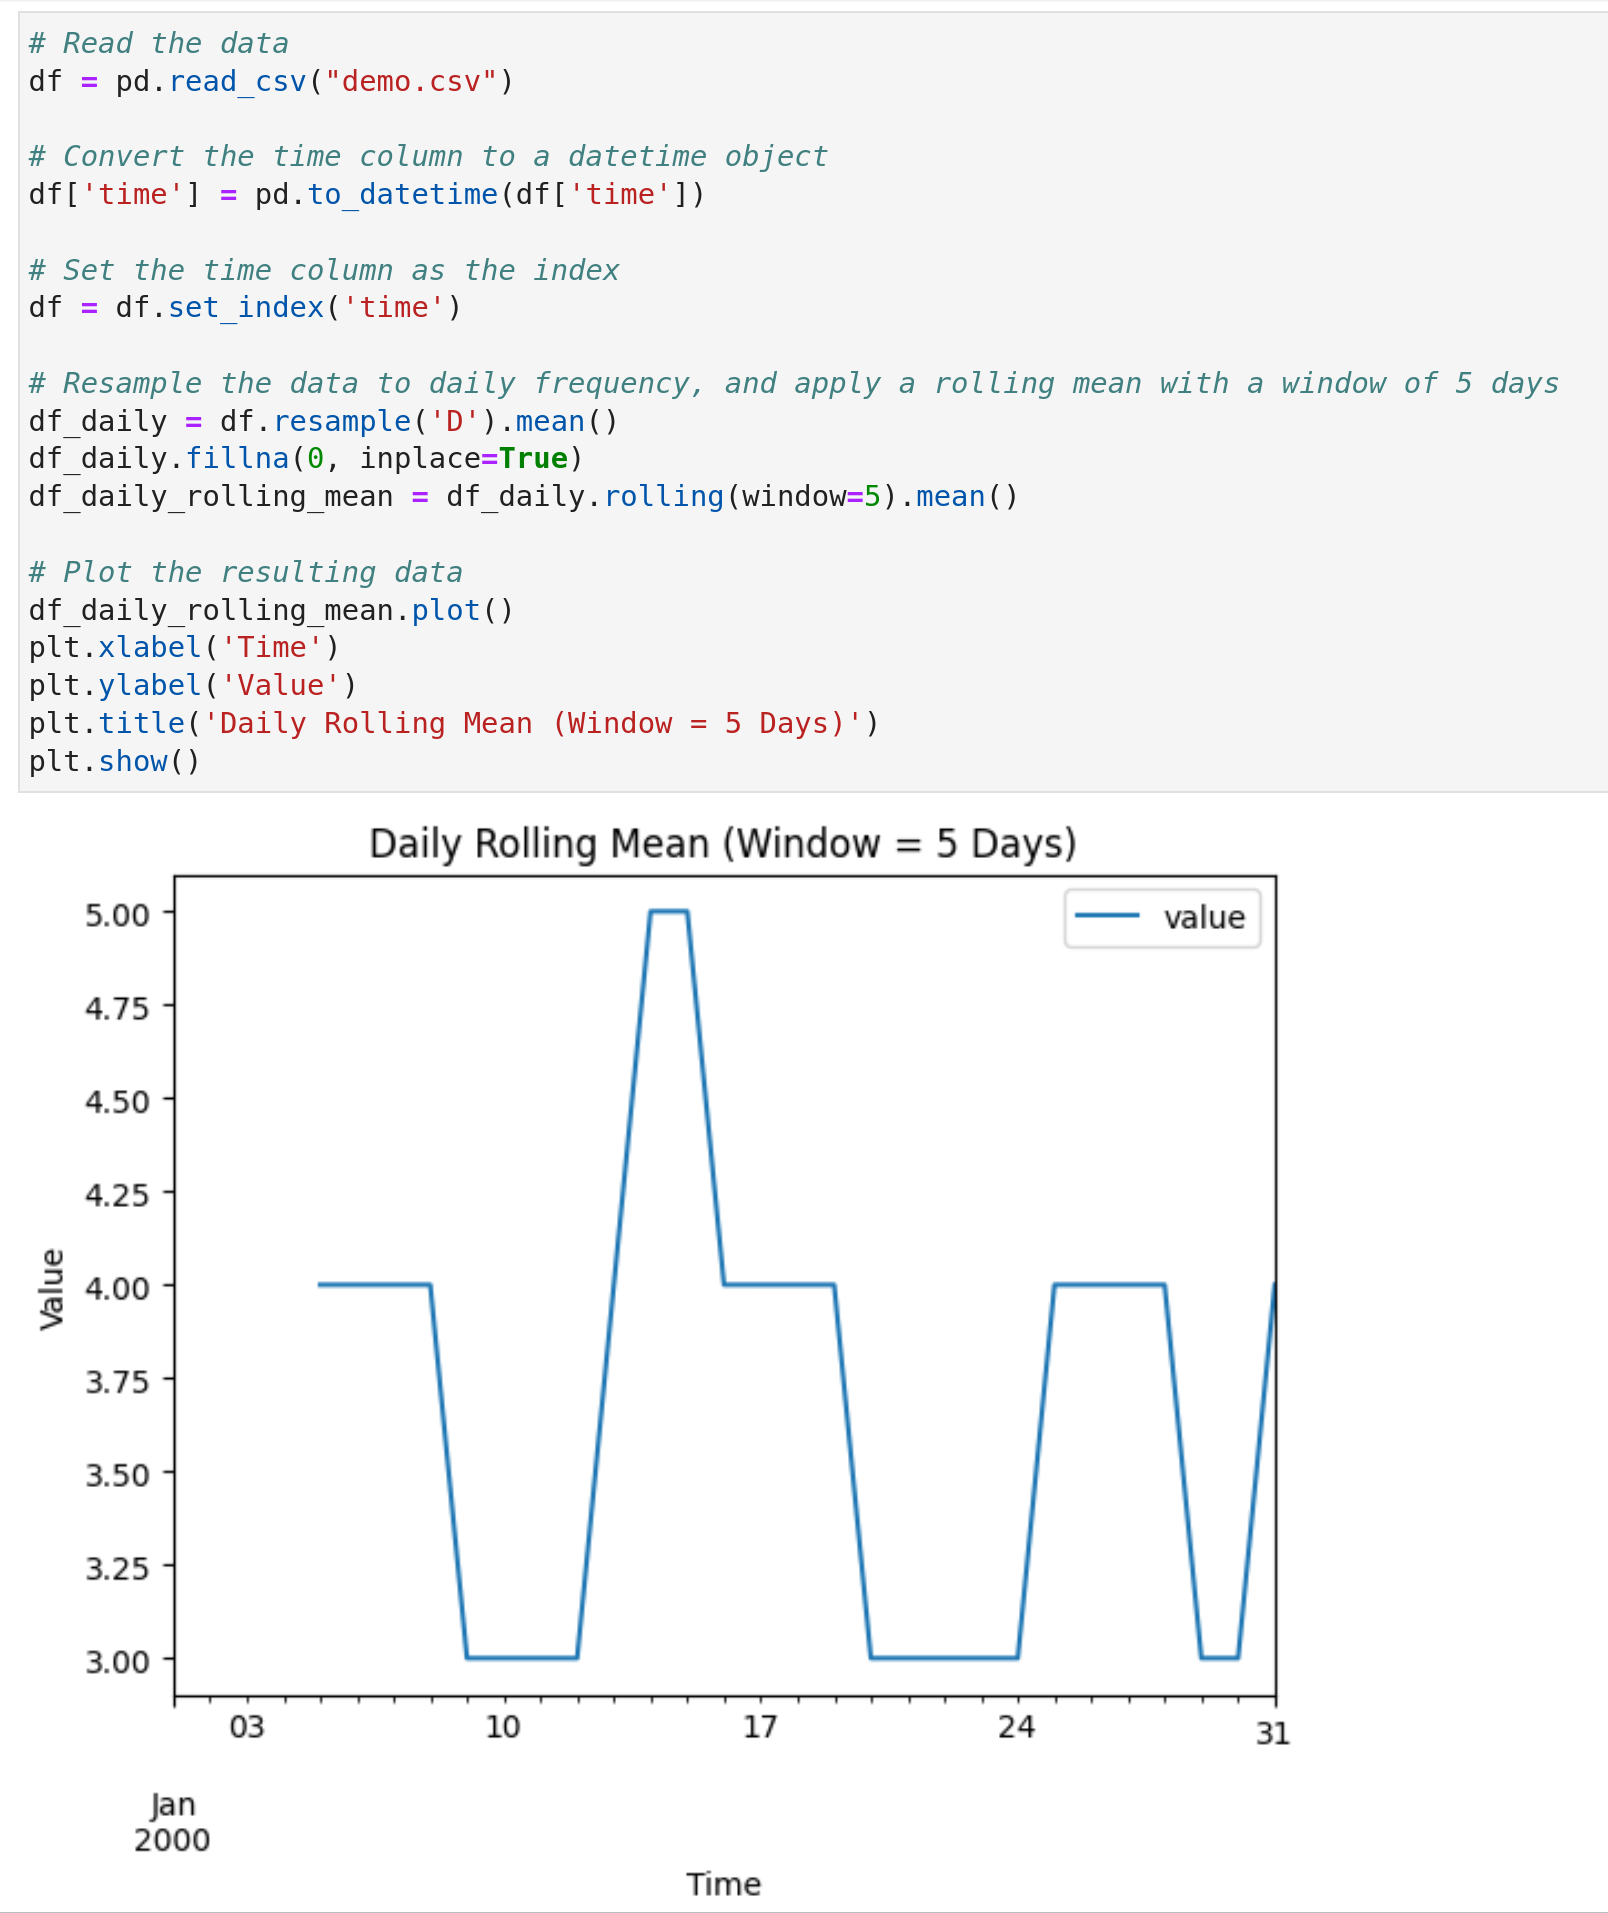
Actual results
We see values at y=5 and y=0, not the values that would be expected from a rolling mean on resampled data:

Environment
- browser type and version: Firefox 109.0.1
- superset version: 0.0.0-dev. I've also tried this on Superset 2.3
- python version: 3.8.13
Checklist
Make sure to follow these steps before submitting your issue - thank you!
- [ x ] I have checked the superset logs for python stacktraces and included it here as text if there are any.
- [ x ] I have reproduced the issue with at least the latest released version of superset.
- [ x ] I have checked the issue tracker for the same issue and I haven't found one similar.
Additional context
I'm using the apache/superset Docker images.
Comment From: matthew-at-qamcom
For more context, I posted a related question on Stack Overflow.
Comment From: matthew-at-qamcom
I re-encountered this problem again. Here's an indication of the size of the effect, with two graphs superimposed. In blue we have Superset's results and in red we have a plot of data manipulated directly using Pandas.
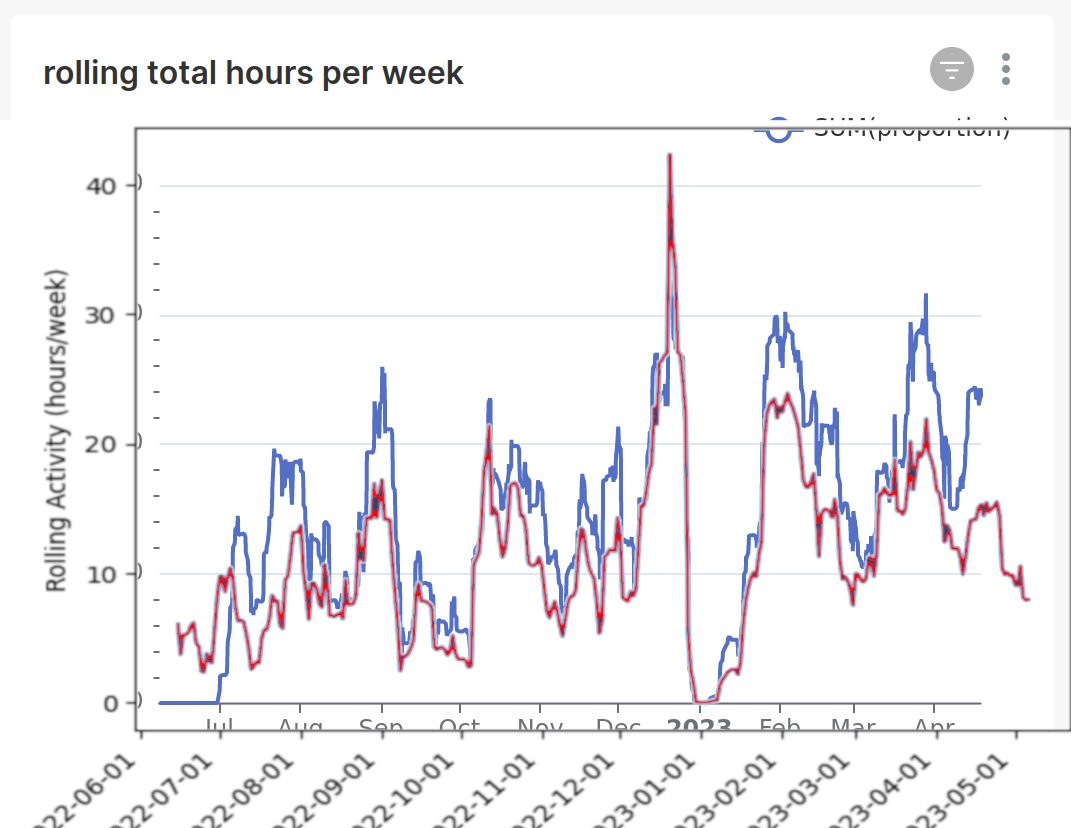
The difference is caused by the fact that we do not have data for weekends. These days are just ignored by Superset, but a correct manipulation would fill with zeros before calculating the rolling values.
Comment From: rusackas
This still seems to be an issue in 3.x. Thanks for giving sample data and a detailed repro flow. Keeping this open.
Comment From: rusackas
I wonder if @zhaoyongjie knows what's going on here?
Comment From: Rydberg95
Still an issue in 4.0.1. I think the issue can be reduced down to the fact that the the rolling values are calculated first, after which the interpolation is carried out.
I can't really think of scenarios when you would want this to be the order instead of first interpolating, so a change of default would imho be justified.
Comment From: rusackas
@dosu-bot
Comment From: rusackas
This has been silent for nearly a year, but I'll leave it open since it's a data correctness issue. Volunteers welcome to contribute though, since this doesn't seem to be getting much interest or prioritization.
Comment From: rusackas
@dosu for good measure :)
Comment From: dosubot[bot]
The root cause here is the order of operations in Superset's post-processing pipeline: currently, rolling calculations are applied before resampling/filling missing values, which leads to technically incorrect results—rolling ignores the zeros or interpolated points that should be included if resampling happened first. This is why you see the "stepped" pattern instead of a smooth rolling mean, especially when your data has missing dates (like weekends) that should be filled with zeros before rolling is applied.
The pipeline is defined as a list of operations (like "rolling", "resample") and executed in order, but the construction of this list isn't managed centrally—it's handled in chart-specific or serialization logic, and by default, the order is often wrong for this use case. Fixing this would require ensuring that resample/imputation always happens before rolling in the query pipeline for time series charts. See the relevant code and schema for more details on how these operations are defined and executed (source, source).
As a workaround, if you have control over the dataset or can preprocess your data, you could fill missing dates with zeros before uploading to Superset, then apply the rolling mean. Otherwise, a code change is needed to adjust the post-processing order for the affected chart types.
Let me know if you want more details on where to look in the code or how to approach a fix!
To reply, just mention @dosu.
How did I do? Good | Irrelevant | Incorrect | Verbose | Hallucination | Report 🐛 | Other 
