Split from https://github.com/golang/go/issues/31908#issuecomment-1887667141 and full write-up at https://jazco.dev/2024/01/10/golang-and-epoll/.
tl;dr is that a program on a 192 core machine with >2500 sockets and with >1k becoming ready at once results in huge costs in netpoll -> epoll_wait (~65% of total CPU).
Most interesting is that sharding these connections across 8 processes seems to solve the problem, implying some kind of super-linear scaling.
That the profile shows the time spent in epoll_wait itself, this may be a scalability problem in the kernel itself, but we may still be able to mitigate.
@ericvolp12, some questions if you don't mind answering:
- Which version of Go are you using? And which kernel version?
- Do you happen to have a reproducer for this problem that you could share? (Sounds like no?)
- On a similar note, do you have a
perfprofile of this problem that shows where the time in the kernel is spent? - The 128 event buffer size is mentioned several times, but it is not obvious to me that increasing this size would actually solve the problem. Did you try increasing the size and see improved results?
cc @golang/runtime
Comment From: prattmic
There is a small chance that #56424 is related, though it seems unlikely as that was at a much smaller scale.
Comment From: ericvolp12
- Which version of Go are you using? And which kernel version?
We're running on the golang:1.21-bullseye docker image base which is currently using: go version go1.21.6 linux/amd64, kernel version 5.15.0-91-generic on Ubuntu
- Do you happen to have a reproducer for this problem that you could share? (Sounds like no?)
We don't have a reproducer for this problem right now unfortunately, but our suspicion is that it should be easy to replicate by serving or making hundreds of thousands of fast network requests in a go application using TCP.
- On a similar note, do you have a
perfprofile of this problem that shows where the time in the kernel is spent?
We don't have a perf profile unfortunately, most of our discovery was done via pprof profiles from the running binary and testing different configurations (4, then 8 containers per host).
- The 128 event buffer size is mentioned several times, but it is not obvious to me that increasing this size would actually solve the problem. Did you try increasing the size and see improved results?
We did not try increasing the buffer size, it wasn't apparent there was a way to do that without running a custom build of Go and at the time running more than one container was a more accessible solution for us.
Thanks for looking into this, it was definitely a interesting thing to find in the wild!
Comment From: whyrusleeping
For some more context, the EpollWait time in the profile was 2800 seconds on a 30 second profile.
Also I don't necessarily think that the epoll buffer itself is the problem, rather just how epoll works under the hood with thousands of 'ready' sockets and hundreds of threads.
The application under load had around 3500 open sockets, http2 clients making requests to our grpc service on one end and us making requests to scyllaDB on the other.
Comment From: prattmic
Thanks for the details! I'll try to write a reproducer when I have some free time, not sure when I'll get to it.
it wasn't apparent there was a way to do that without running a custom build of Go
Indeed, you'd need to manually modify the runtime. Note that is possible to simply edit the runtime source in GOROOT and rebuild your program (no special steps required for the runtime, it is treated like any other package). But if you build in a Docker container it is probably a pain to edit the runtime source.
Comment From: prattmic
Some thoughts from brainstorming for posterity:
My best theory at the moment (though I'd really like to see perf to confirm) is that ~90 threads are calling epoll_wait at once (probably at this non-blocking netpoll: https://cs.opensource.google/go/go/+/master:src/runtime/proc.go;l=3230;drc=dcbe77246922fe7ef41f07df228f47a37803f360). The kernel has a mutex around the entire copy-out portion of epoll_wait, so there is probably a lot of time waiting for the mutex. If that is the case, some form of rate-limiting on how many threads make the syscall at once may be effective. N.B. that this non-blocking netpoll is not load-bearing for correctness, so occasionally skipping it would be OK.
Comment From: whyrusleeping
Yeah, it was the netpoll call inside findRunnable (though i didnt have my source mapping set up at the time to confirm the exact line numbers). I overwrite the profile i took from the degerate case unfortunately, if helpful we can probably reorient things back down to a single process per machine and run some tests with perf.
I've also got a spare test machine with the same CPU i can use to try out a repro test case as well.
Comment From: sschepens
is go using the same epoll instance accross all threads? that might be the underlying problem, most high-throughput applications (nginx, envoy, netty) create several instances (usually one per thread together with an event loop) and connections get distributed to all epoll instances some way or another.
Comment From: panjf2000
is go using the same epoll instance accross all threads? that might be the underlying problem, most high-throughput applications (nginx, envoy, netty) create several instances (usually one per thread together with an event loop) and connections get distributed to all epoll instances some way or another.
Good point! And to answer your question, yes, Go has been using the single (and global) epoll/kqueue/poll instance internally since the day Go netpoll was introduced. I actually had this concern for a few years, but never got a chance to spot that kind of performance bottleneck emerge. What I had in mind is that we can make a transition from single epoll instance to per-P epoll instances, or just multiple global epoll instances simply, which could also help.
From where I stand, I reckon that refactoring the current epoll from a single instance to multiple instances would require much less work than introducing io_uring. What is more, given the current Go codebase, io_uring is better suited for file I/O than for network I/O. Oh boy, I can already imagine now how many obstacles we'll have to go through before io_uring is implemented for network I/O eventually, and also transparently.
To sum up, multiple epoll instances should be able to gain sufficient credits for the performance boost of network I/O, and in consideration of the complexity from introducing io_uring for network I/O, I think the former is more feasible at this stage.
Comment From: sschepens
using multiple epoll instances would mean that connections or fds would now be bound to a single thread? does this means that it could be possible for connection imbalances to happen where some threads could be handling many long lived connections while others be mostly idle?
Comment From: panjf2000
using multiple
epollinstances would mean that connections or fds would now be bound to a single thread? does this means that it could be possible for connection imbalances to happen where some threads could be handling many long lived connections while others be mostly idle?
This is one of the potential issues we may encounter and need to resolve if we decide to introduce multiple epoll instances for Go runtime. But I don't think it's going to be our big concern cuz there are ways for us to mitigate that, for instance, the work-stealing mechanism, or just to put surplus tasks in the global run queue.
I actually drafted a WIP implementation of multiple epoll/kqueue/poll instances a long time ago on my local computer, and I can take on this if we eventually decide to introduce multiple netpollers after the root cause of this issue has been revealed.
Comment From: errantmind
A casual observation (not go specific): one reason epoll doesn't scale well when a single epoll instance is shared across threads is the file descriptor table, which is typically shared across the process. This is one of the reasons why, say, 8 separate processes usually performs better than a single process with 8 threads. The impact is present both with multiple epoll instances (per thread), or a single epoll instance shared across threads. The way to circumvent this is to unshare (syscall) the file descriptor table across threads upon thread creation, then create an epoll instance per thread. This yields similar performance to a multi process approach (within 1% in my experience). After that you can distribute the work however you want, maybe with SO_REUSEPORT. Also, be careful unsharing the file descriptor table, it is not appropriate for all situations.
Side note, if you are sharing an epoll instance across threads you should use edge triggered to avoid all threads from being woken up, most unnecessarily.
This is my experience anyway when using a thread per core model, although the principle would apply regardless of the number of threads. I don't know anything about go internals so I'll leave it there.
Comment From: bwerthmann
I don't want to derail this issue, let me know if I should move this to a separate bug...
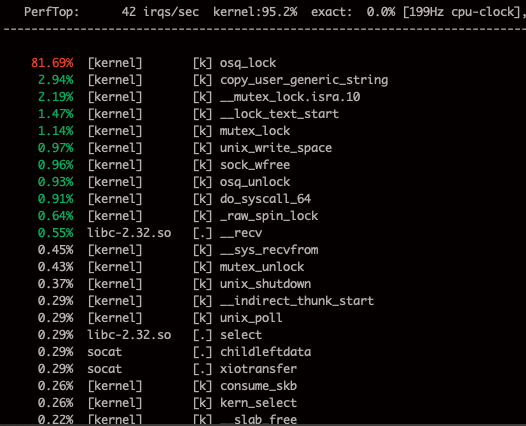
We are seeing a similar issue on a system with 128 cores, we're only reading from 96 Unix Sockets, 1 per goroutine. Go was spending much time in netpoll -> epoll_wait and perf top reported much of time in the kernel in osq_lock.
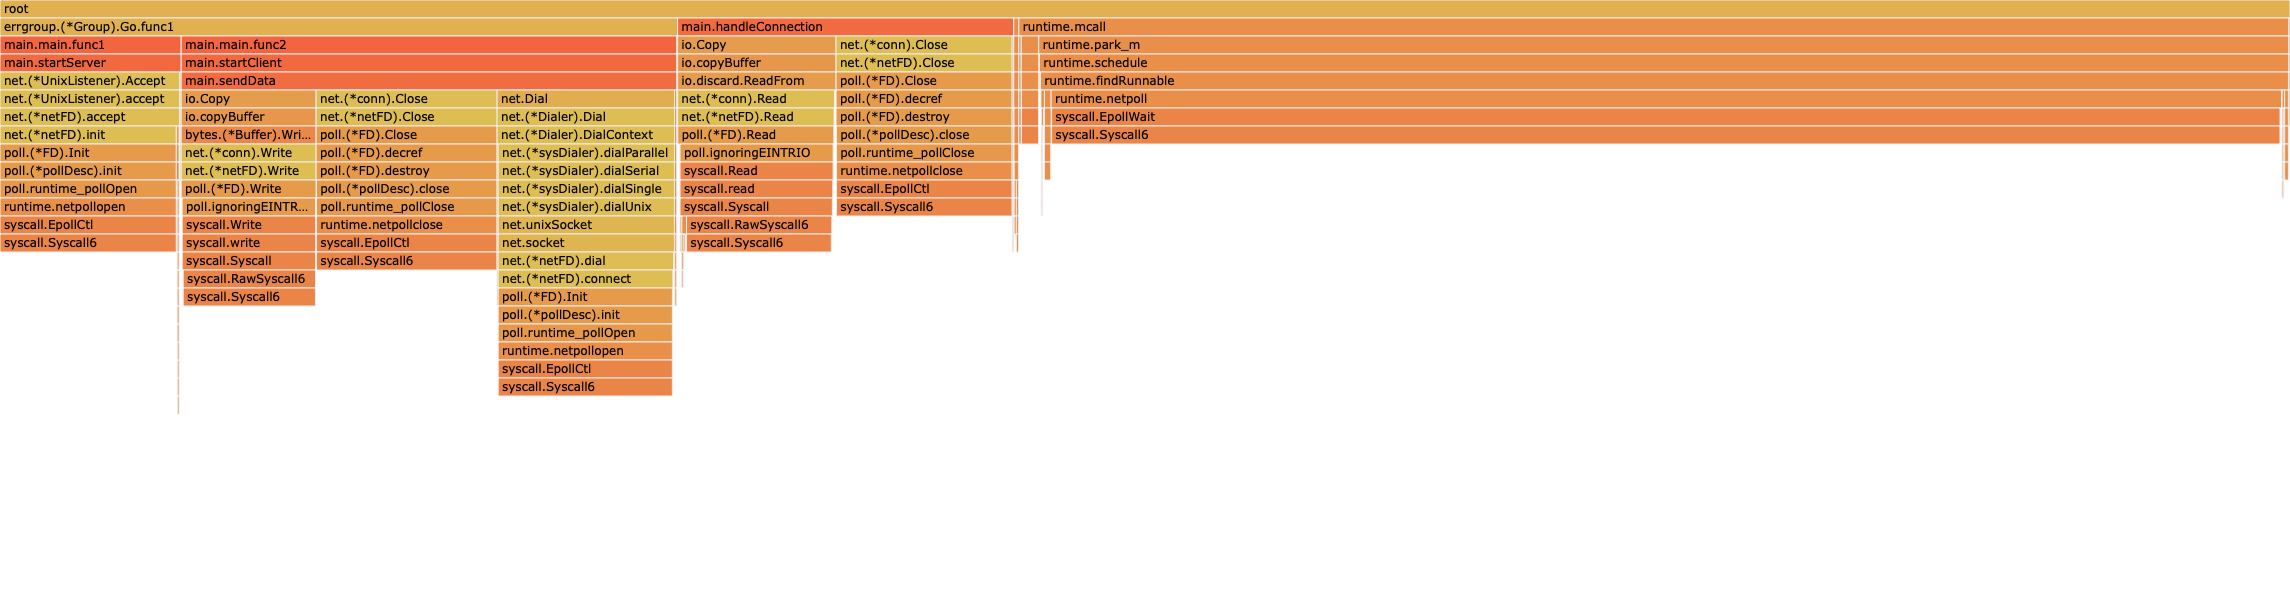
I'm looking for the profiles from the Go App, in the mean time I can share that we reproduced this issue with a simple socat invocation:
I wrote a workaround that does not invoke netpoll at all, instead it just makes raw syscalls and throughput improved by 5x (which is the next bottleneck in the App, also related to Mutex being slow). My microbenchmark with raw syscalls just reading from unix sockets performed >10x in terms of bandwidth with the 96 producers.
Let me know if there's anything I can do to help.
Comment From: bwerthmann
These kernel patches may be of interest:
locking/osq_lock: Fix false sharing of optimistic_spin_node in osq_lock, may not be accepted yet?
https://lore.kernel.org/lkml/20230615120152.20836-1-guohui@uniontech.com/
Comment From: panjf2000
I wrote a workaround that does not invoke netpoll at all, instead it just makes raw syscalls and throughput improved by 5x
Just to make sure I don't misread what said, you achieved that by using raw syscalls of socket(), bind(), listen(), connect(), read() write(), etc. instead of the APIs provided by std net, right?
@bwerthmann
Comment From: bwerthmann
I wrote a workaround that does not invoke netpoll at all, instead it just makes raw syscalls and throughput improved by 5x
Just to make sure I don't misread what said, you achieved that by using raw syscalls of
socket(),bind(),listen(),connect(),read()write(), etc. instead of the APIs provided by stdnet, right? @bwerthmann
Correct. I'll ask today if I can share an example.
Comment From: valyala
I think it would be great if Go runtime could maintain a separate epoll file descriptor (epfd) per each P. Then every P could register file descriptors in its own local epfd and call epoll() on it when its local list of goroutines ready to run becomes empty and it needs to find runnable goroutine. This scheme has the following benefits:
- Goroutines, which work with network, will tend to stay on the same P, since the file descriptors created by the goroutine are registered in P-local epfd. Even if the goroutine migrates to another P for some reason, it will migrate to the original P after the next network IO. This improves locality of data accessed by the goroutine, so it remains for longer in P-local CPU caches. This should improve the overall performance, since access to local CPU caches is usually faster than access to shared memory.
- This should improve scalability of epoll() calls, since every P will poll its own epfd, thus removing bottlenecks related to access synchronization to shared epfd in kernel space.
Such a scheme may result in imbalance of goroutines among P workers, if a single goroutine creates many network connections (e.g. server accept loop). Then the Go scheduler will migrate all the goroutines, which make IO on these connections, to the original P where the original goroutine created all these network connections. This can be solved by periodic even re-distribution of the registered network connections among P-local epfds. For example, if P cannot find ready to run goroutines in local queue and in local epfd, then it can steal a few network connections from the busiest P, to de-register them from that P's epfd and then to register them in local epfd. The busiest P can be determined from some rough per-P CPU usage stats.
Comment From: aclements
I agree that most likely we need multiple epoll FDs, with some sort of affinity.
@bwerthmann , since you're able to get perf profiles, could you get one with perf record -g? I'd love to see where the osq_lock call is coming from to confirm the hypothesis.
It would be really helpful if someone could create a benchmark that reproduces this issue. If it can be done with only 96 UNIX domain sockets, it may not even be especially hard.
Comment From: aclements
If we want to go deep here, it might even be possible for the Go scheduler to become RX queue aware using sockopts like SO_INCOMING_CPU or SO_INCOMING_NAPI_ID. I suspect we can do a lot better without bringing in that complexity, but it's an interesting opportunity to consider.
Comment From: bwerthmann
@aclements profile as requested. Taken with go1.21.5 on a 128 core machine:
Comment From: aclements
@bwerthmann , thanks for the profile. Are you able to get one with call stacks that extend into the kernel? What I really want to see is what in the kernel is spending so much time on osq_lock.
Comment From: aclements
Nevermind! I was reading your profile backwards. 😅
Comment From: bwerthmann
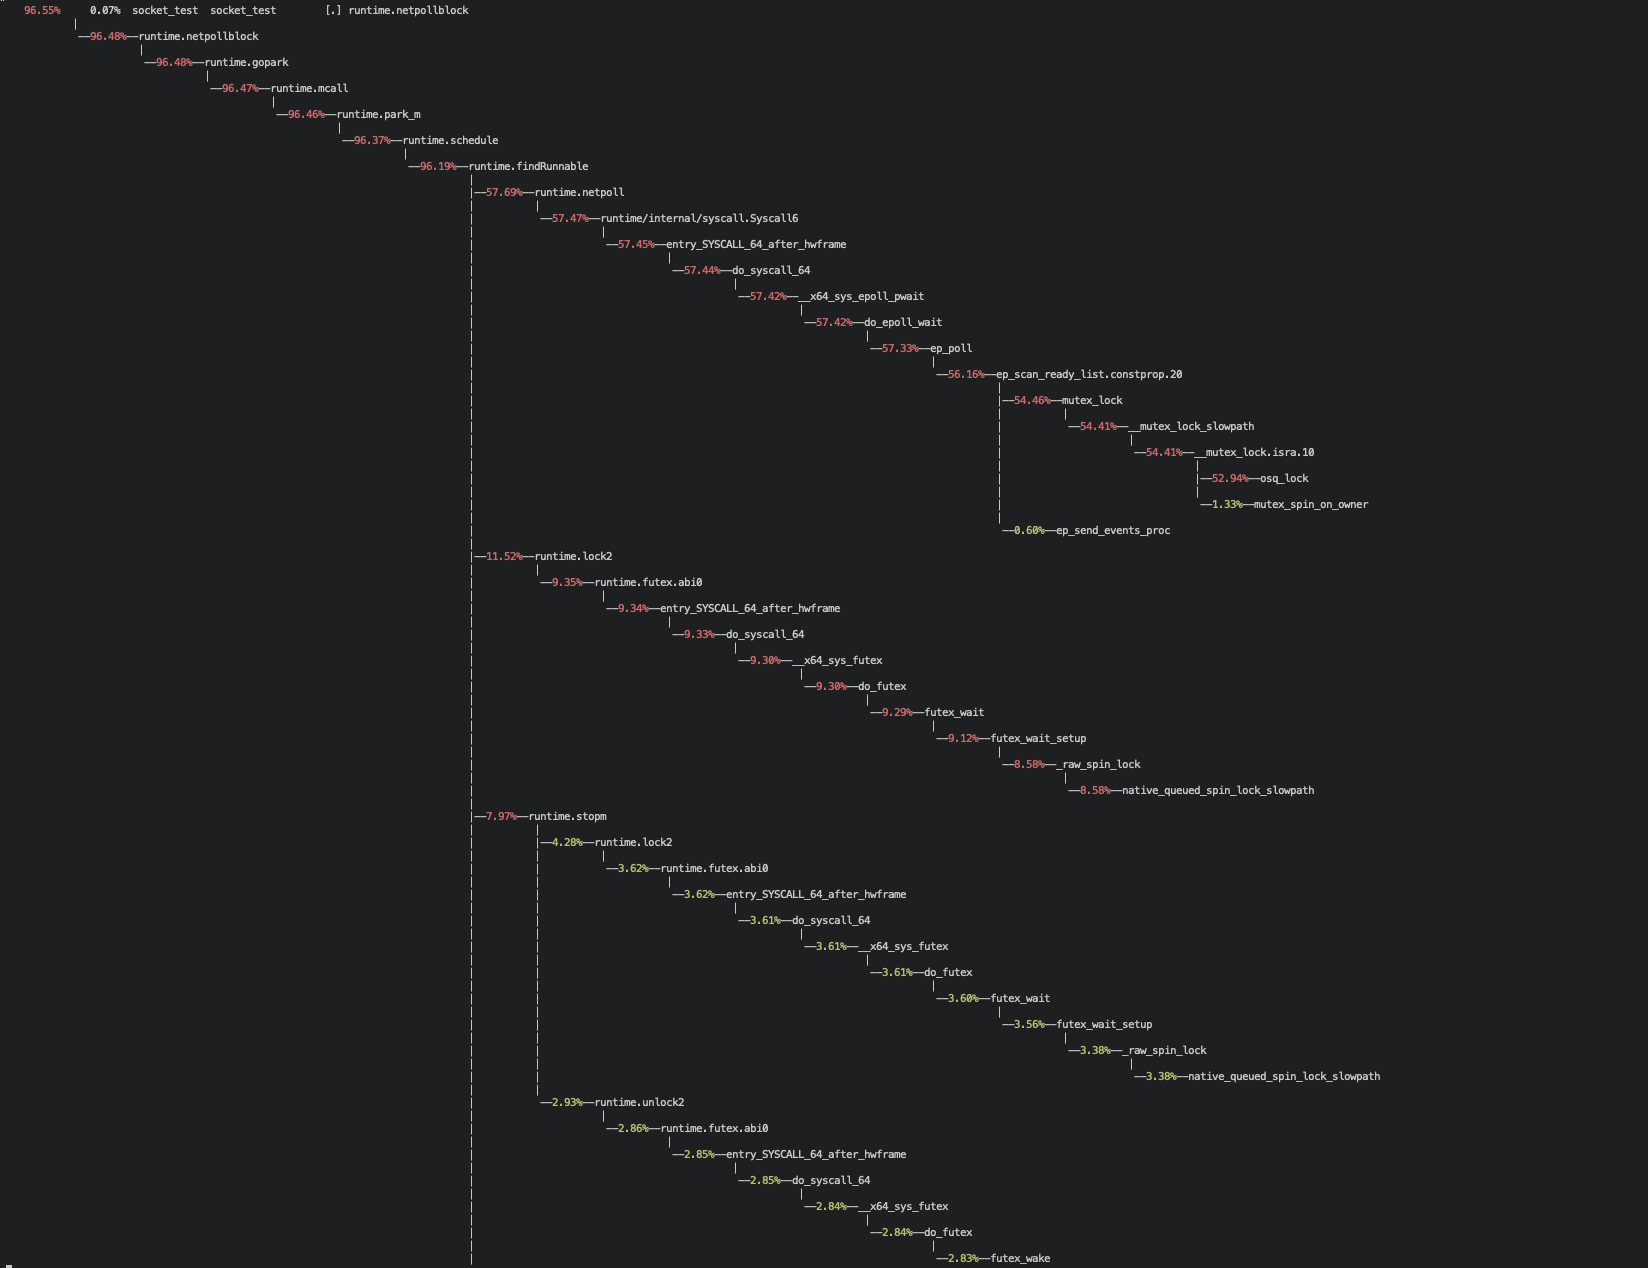
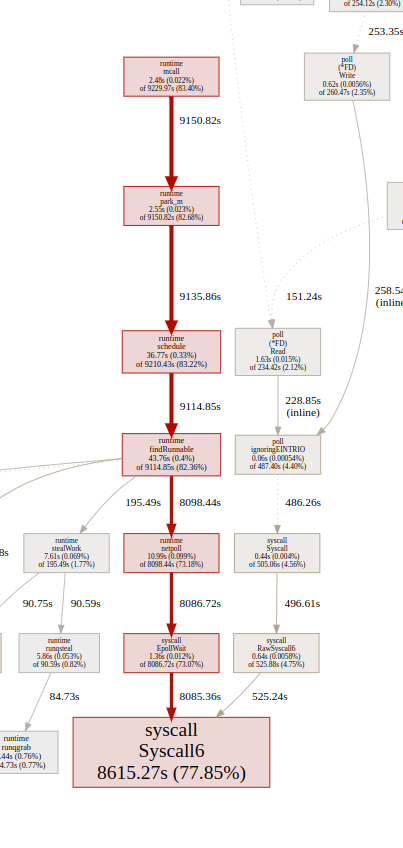
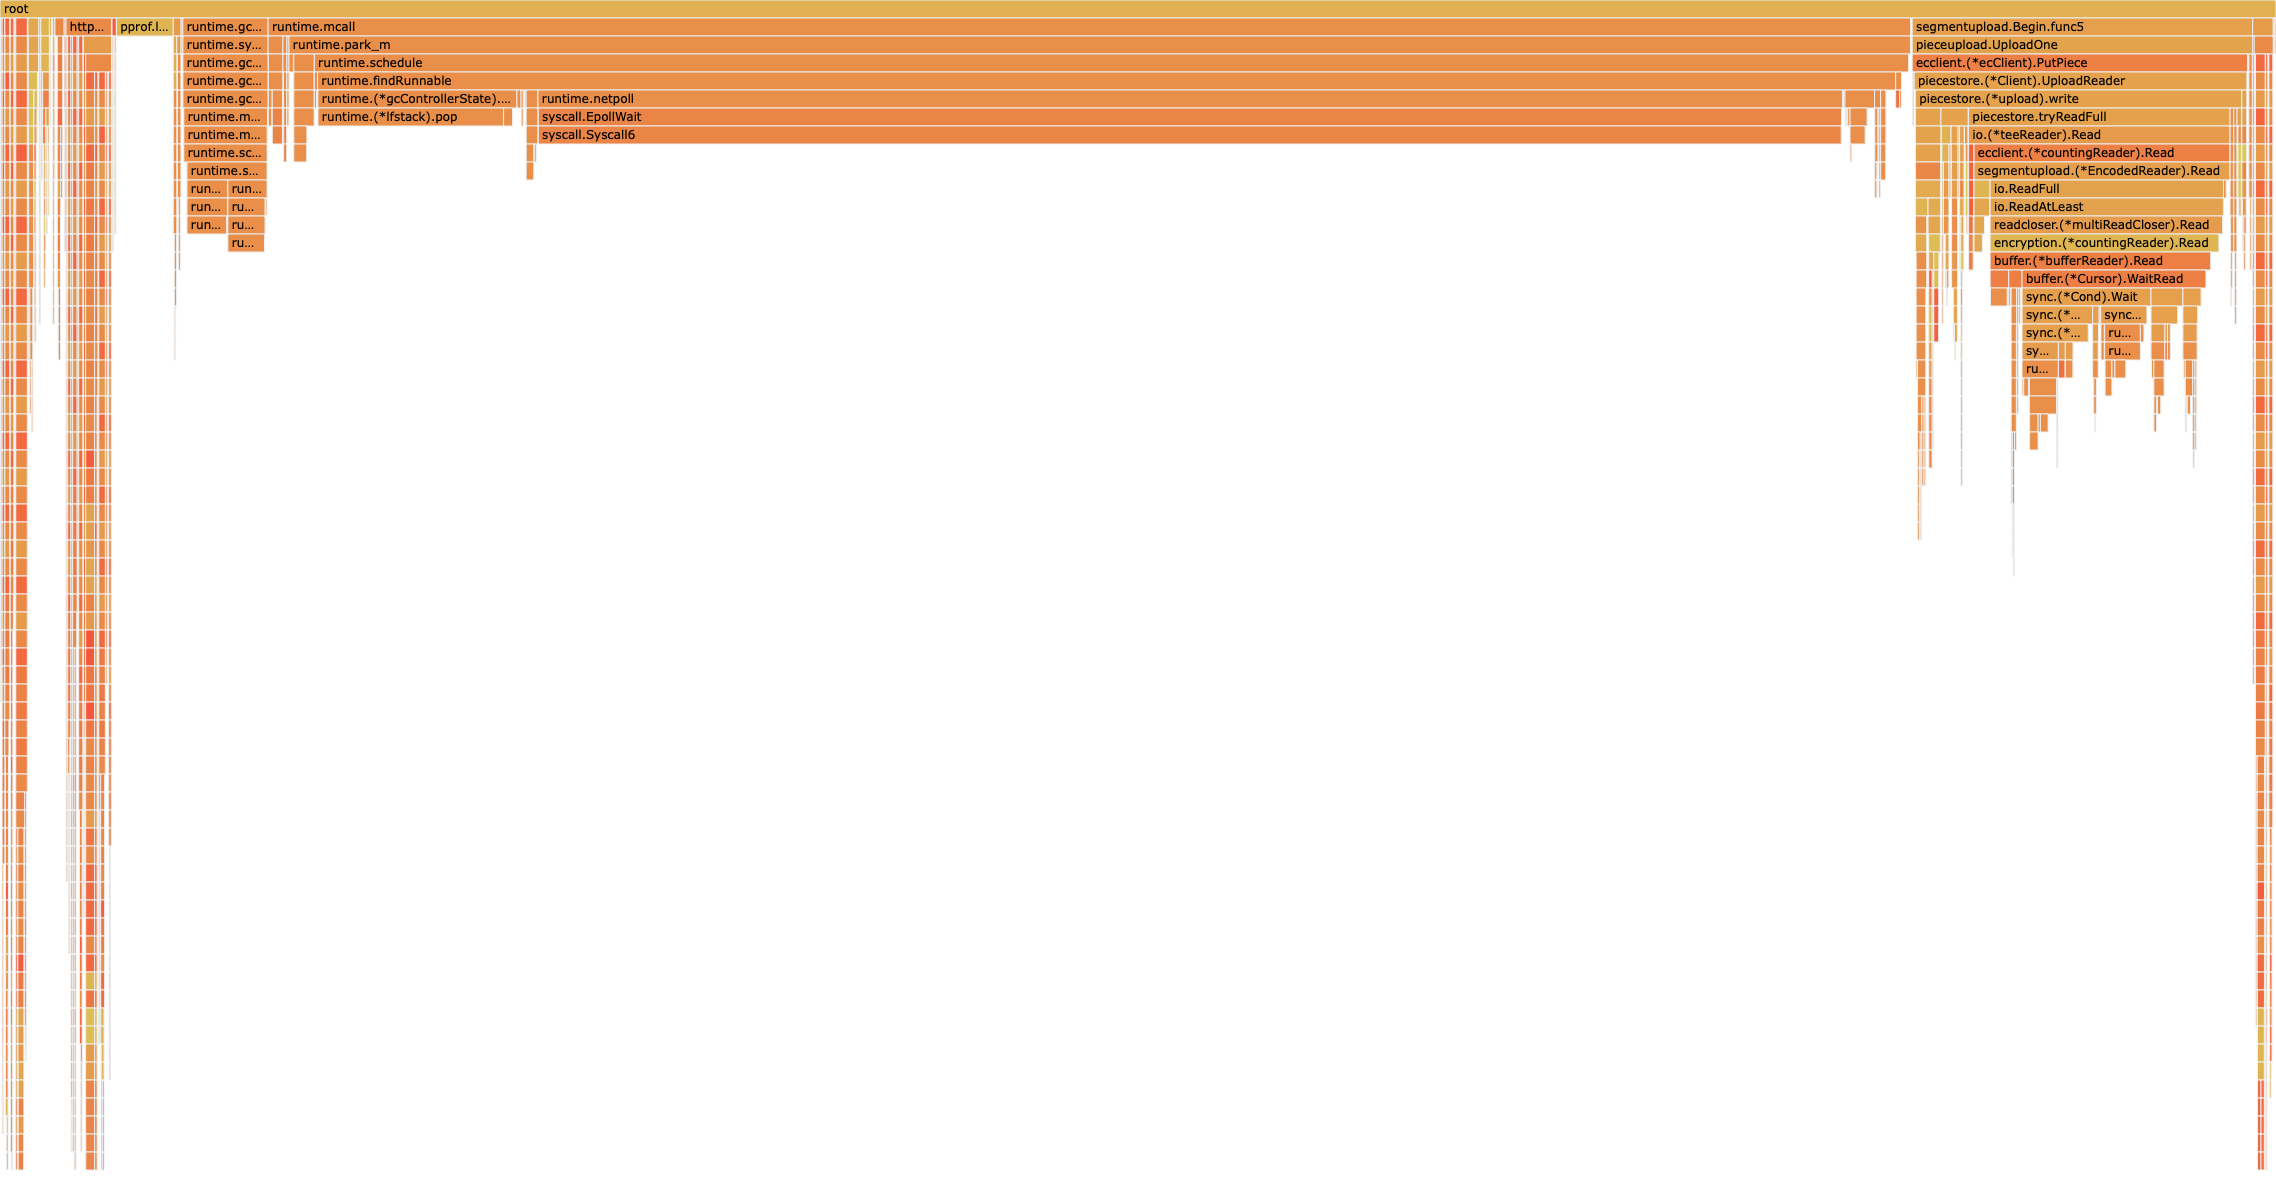
@aclements here's a stack sample with the main func at the top:
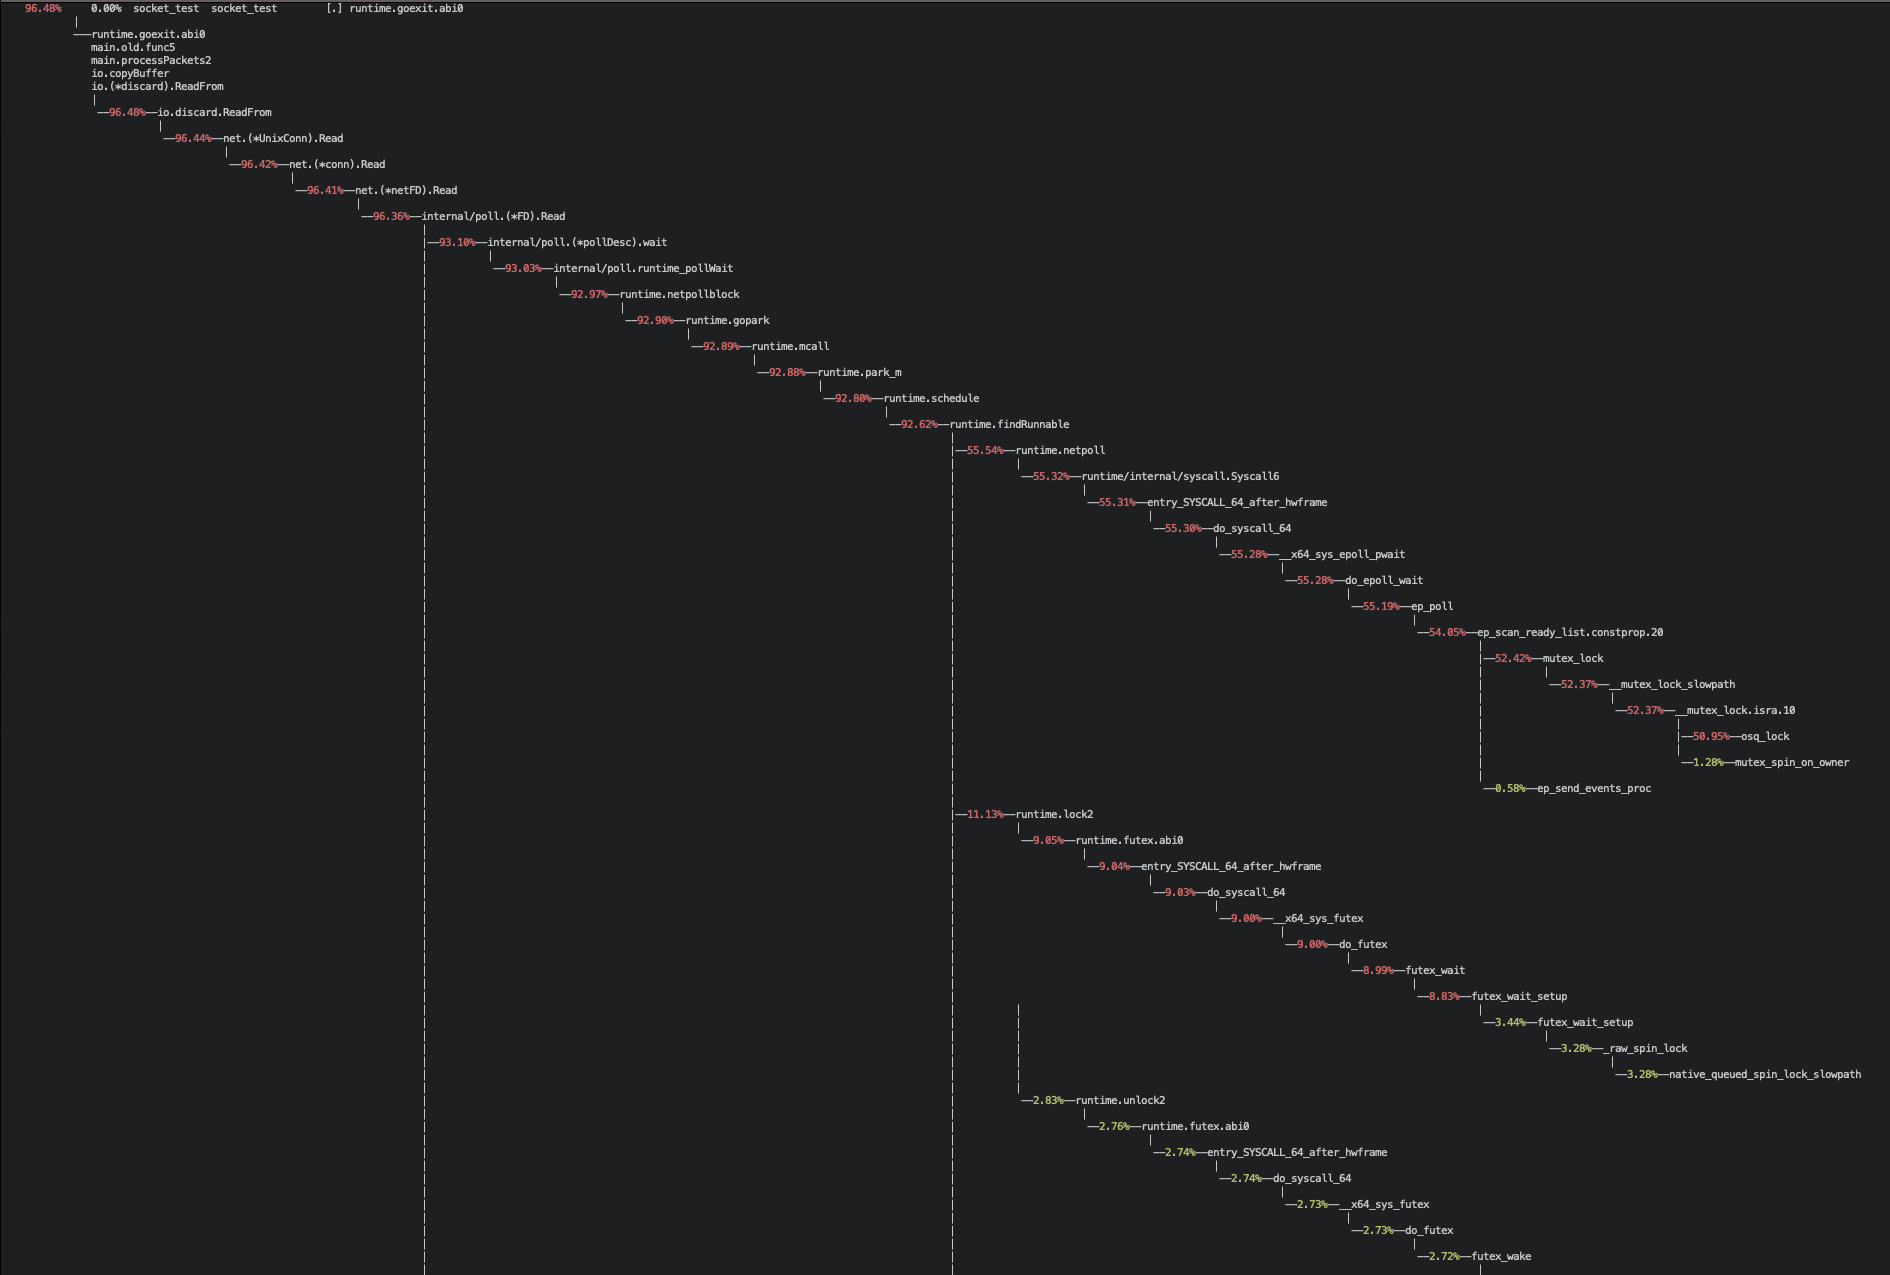
profile from FlameScope:
blanks on the left and right are when the profile stopped and started.

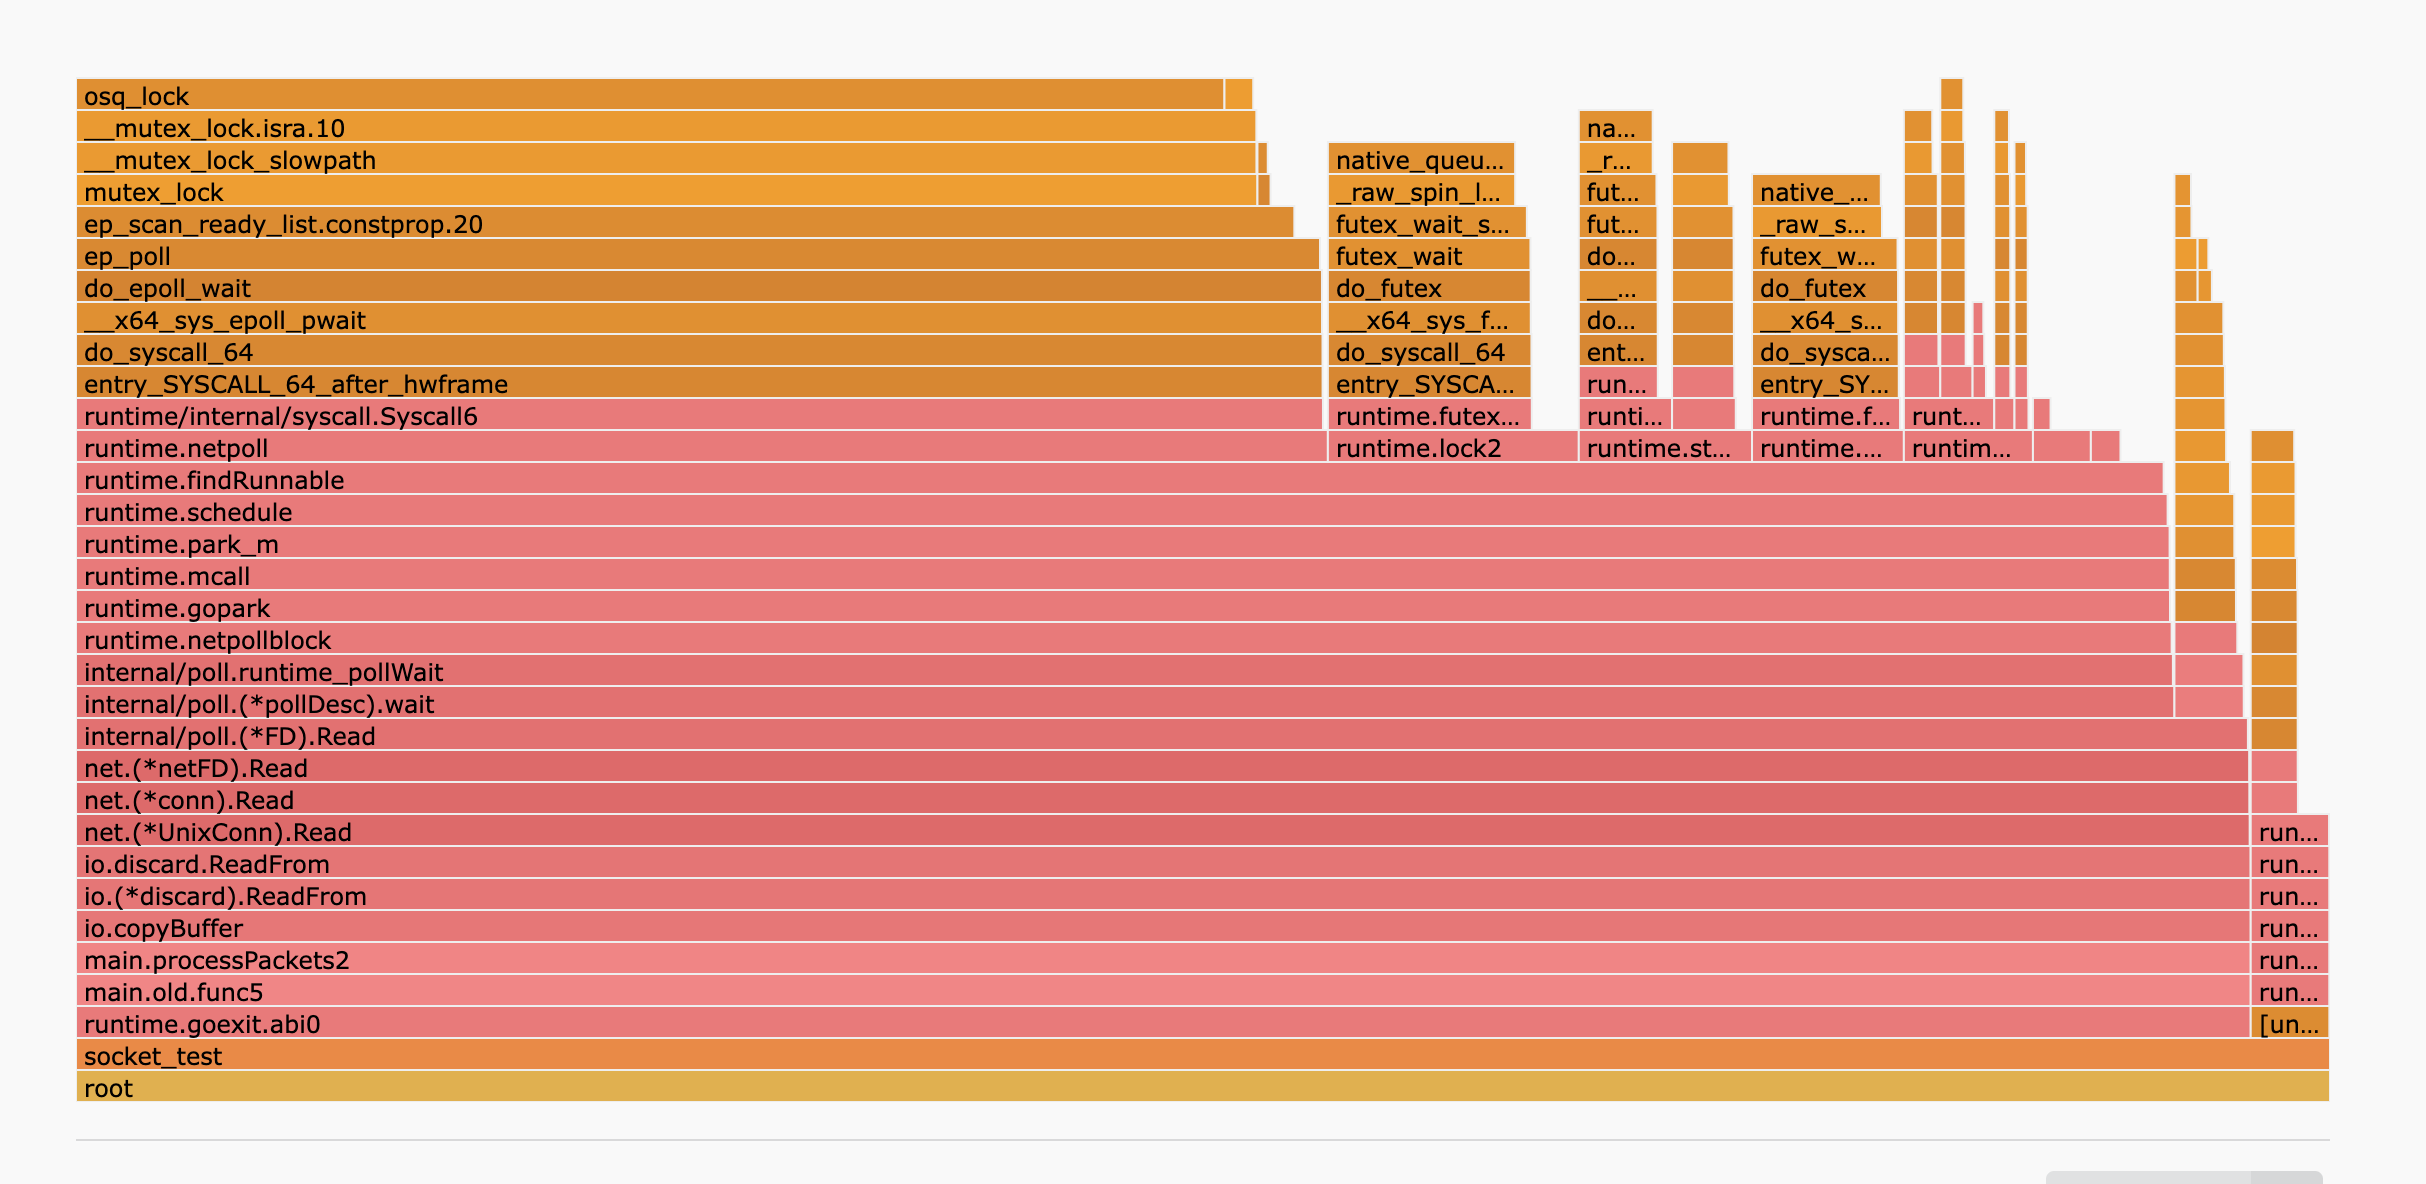
Flamegraph:
Comment From: bwerthmann
I'd love to see where the
osq_lockcall is coming from to confirm the hypothesis.
@aclements what are your thoughts on the profiles?
Comment From: prattmic
@bwerthmann Thanks for the detailed profile! This seems to confirm my suspicion in https://github.com/golang/go/issues/65064#issuecomment-1887902738.
The mutex being taken appears to be https://elixir.bootlin.com/linux/v5.10.209/source/fs/eventpoll.c#L696 [1]. This is held around a loop over the ready list (https://elixir.bootlin.com/linux/v5.10.209/source/fs/eventpoll.c#L1722), which double-checks that events are still ready (ep_item_poll) and then copies them to the userspace output buffer (__put_user). This loop exits when it reaches the end of the ready list or when it has written the max events that fit in the userspace output buffer, whichever is sooner.
With a very long ready list, we're probably hitting the 128 event limit specified by netpoll. It's possible shrinking this could actually help by making the critical section shorter, but probably not nearly as much as reducing concurrent calls to epoll_wait (either directly, or sharding across multiple epoll FDs).
As an aside, I also see a fair amount of contention on runtime locks in your profile (probably sched.lock), so that bottleneck would likely come up next.
[1] ep_scan_ready_list was removed completely in 2020 in Linux v5.11 in a fairly large epoll refactor: https://git.kernel.org/pub/scm/linux/kernel/git/torvalds/linux.git/commit/?id=1a825a6a0e7eb55c83c06f3c74631c2eeeb7d27f, but the lock simply moved to the caller and seems to protect a similar critical section. https://github.com/golang/go/issues/65064#issuecomment-1887729630 noted Linux v5.15, so presumably it has similar issues.
Comment From: ianlancetaylor
It seems to me that we can partially mitigate the immediate issue by just limiting the number of P's that do a non-blocking epoll call in findRunnable. We get no advantage from having multiple P's call netpoll(0) simultaneously. And if we prevent that from happening, then we seem likely to avoid the contention in the kernel. We'll still have contention in userspace, but we have that anyhow, and that will continue until we are able to do a major overhaul of the scheduler for NUMA support.
If anybody who can easily recreate the issue has time for experimentation, it might be interesting to see whether https://go.dev/cl/564197 makes any difference. Thanks.
Comment From: gopherbot
Change https://go.dev/cl/564197 mentions this issue: runtime: only poll network from one P at a time in findRunnable
Comment From: ianlancetaylor
Is anybody interested in seeing whether https://go.dev/cl/564197 fixes the problem? To be clear, I'm not going to submit it unless I have some reason to think that it helps. Thanks.
Comment From: panjf2000
Is anybody interested in seeing whether go.dev/cl/564197 fixes the problem? To be clear, I'm not going to submit it unless I have some reason to think that it helps. Thanks.
Is there any chance you could apply CL 564197 in production? Or maybe do it in the dev/test environment to which you replay the live traffic using some tool like goreplay? @ericvolp12 @whyrusleeping
Comment From: bwerthmann
I might have some cycles this week to test my reproducer.
Comment From: panjf2000
I might have some cycles this week to test my reproducer.
Great! Thanks! @bwerthmann
Comment From: bwerthmann
I might have some cycles this week to test my reproducer.
Great! Thanks! @bwerthmann
Are there any instructions or easy buttons for checking out the changes needed in https://go-review.googlesource.com/c/go/+/564197/ to my GOROOT?
Comment From: ouvaa
i was testing with 192 cores and just found all the issues you guys mentioned using gnet, fasthttp etc. all the high perf writers' messages are here.
kind of sad none of the high perf golang packages can fully utilize all the cores. seems "sweet" spot is around 8 cores for now.
Comment From: bwerthmann
I might have some cycles this week to test my reproducer.
Great! Thanks! @bwerthmann
I've had other priorities, I'd like to get back to this in a few weeks or so. Sorry for the delay.
Comment From: harshavardhana
Looks like we have hit the same problem
Comment From: ldemailly
For reproducing (I don't have a 192 core machine to check) you could probably use https://github.com/fortio/fortio
Happy to help using it/if it helps but something like a large -c and talking to itself; on my local Mac it does >90k qps easily over 32 to 128 sockets but you can make it do 10,000 sockets and it gets slower ~ 60k qps
Comment From: sprappcom
will this be solved with io_uring? epoll is obsolete with io_uring around.
Comment From: ianlancetaylor
io_uring is #31908.
Comment From: harshavardhana
Is anybody interested in seeing whether https://go.dev/cl/564197 fixes the problem? To be clear, I'm not going to submit it unless I have some reason to think that it helps. Thanks.
I have some cycles to test this out, as we have a reproducer of sort that generates random latencies.
Comment From: amwolff
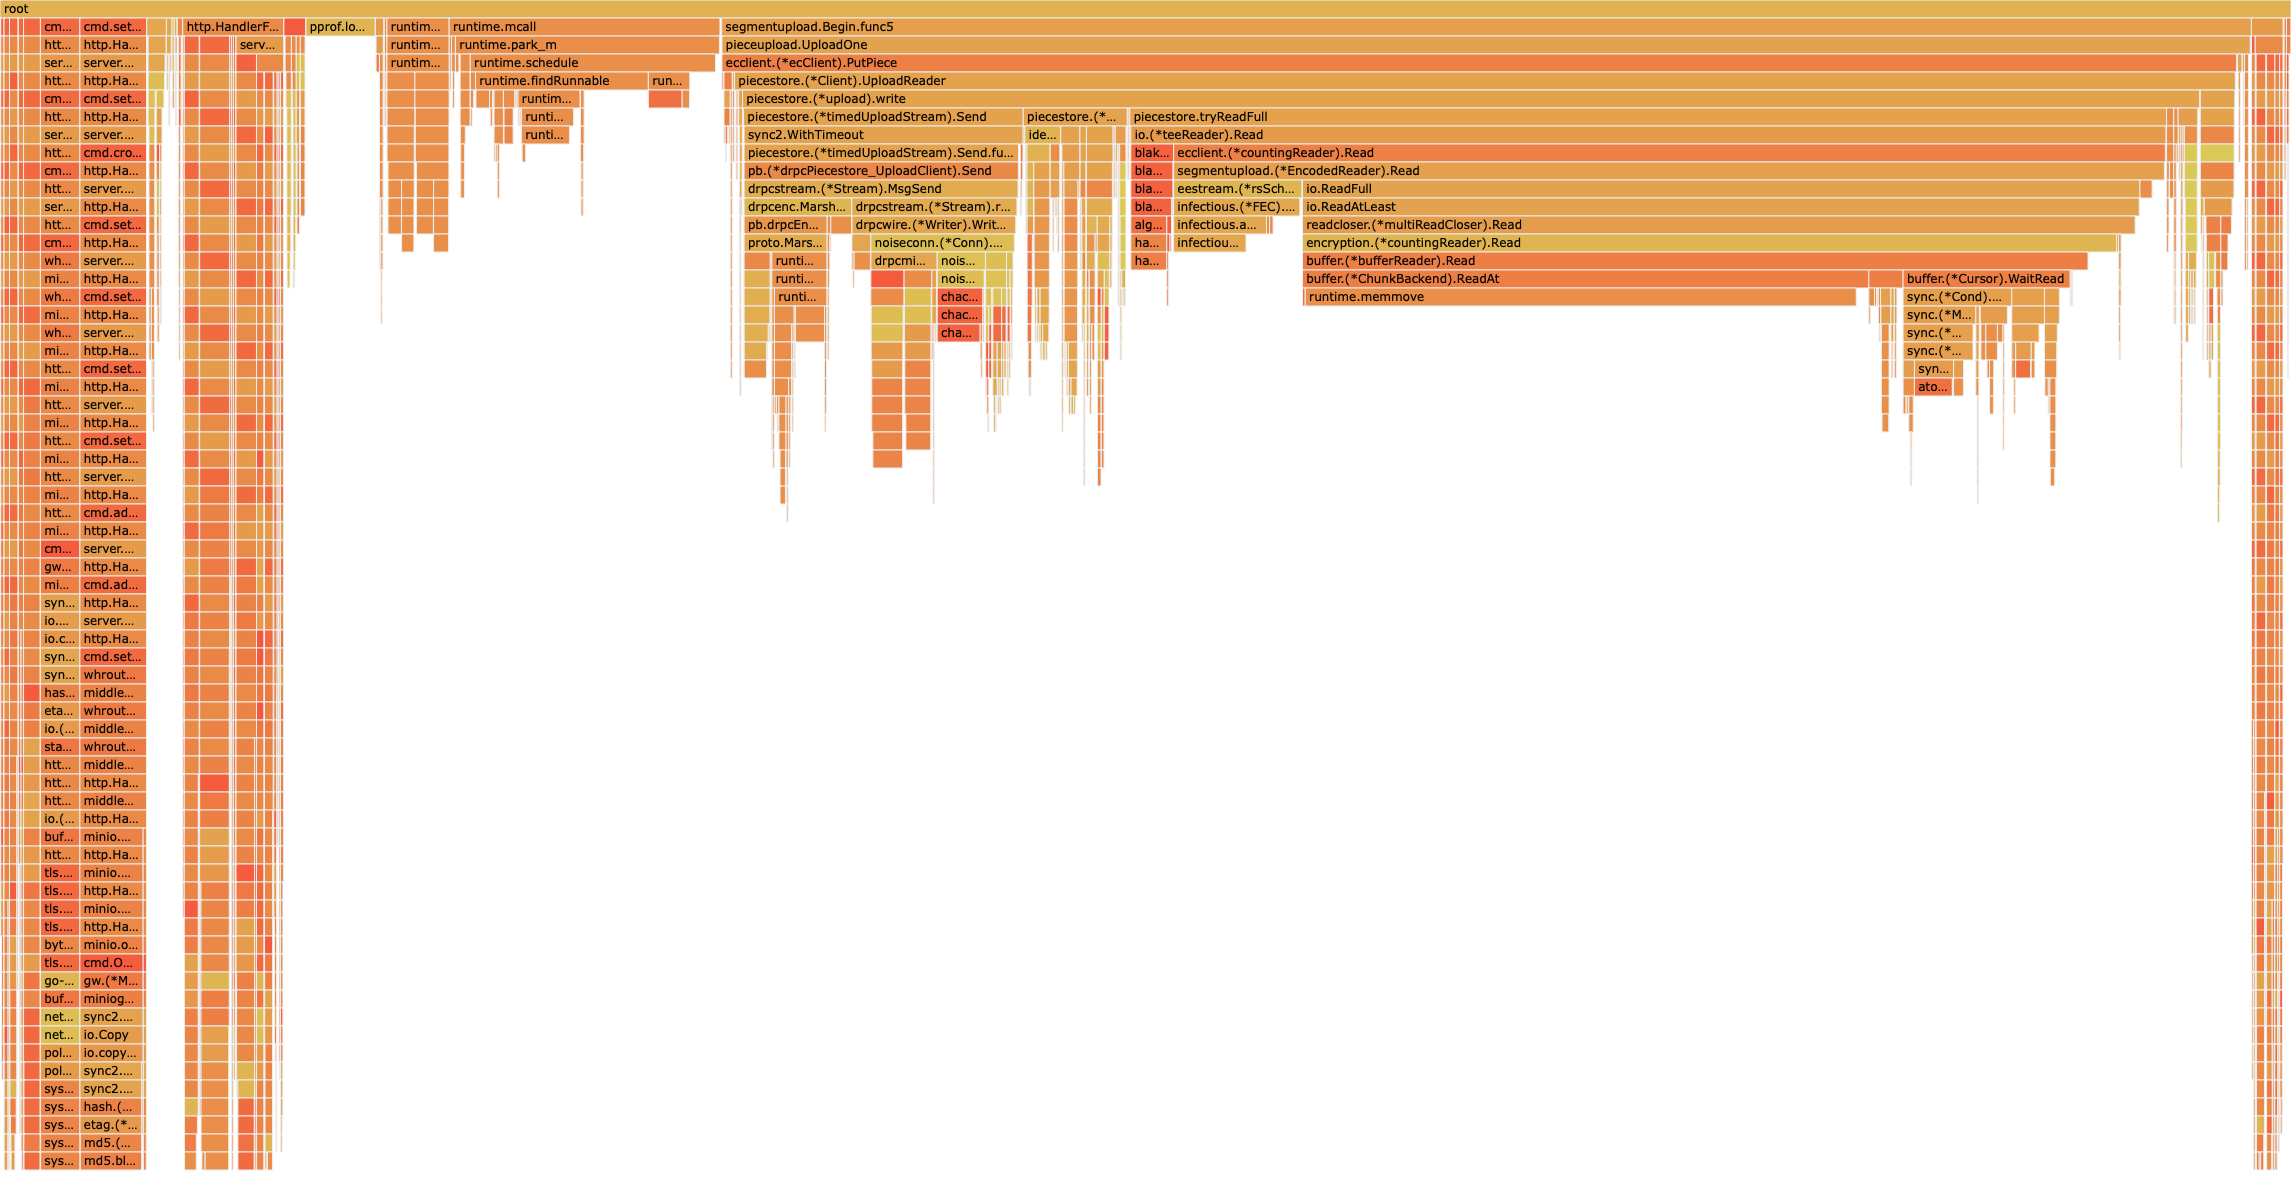
okay, I found a reliable though somewhat clunky reproducer and tested with EPYC 7443P and EPYC 9754 and go1.23.5 and go1.23.5+https://go.dev/cl/564197.
Reproducer: random-socket-reader
EPYC 9754 (128 cores, 256 threads)
$ uname -srvmpio
Linux 5.15.0-130-generic #140-Ubuntu SMP Wed Dec 18 17:59:53 UTC 2024 x86_64 x86_64 x86_64 GNU/Linux
go1.23.5

flamegraph image | profile (pprof.host | download)
go1.23.5+564197

flamegraph image | profile (pprof.host | download)
EPYC 7443P (24 cores, 48 threads)
$ uname -srvmpio
Linux 5.15.0-124-generic #134-Ubuntu SMP Fri Sep 27 20:20:17 UTC 2024 x86_64 x86_64 x86_64 GNU/Linux
go1.23.5

flamegraph image | profile (pprof.host | download)
go1.23.5+564197

flamegraph image | profile (pprof.host | download)
testing "process"
I haven't done this in a while now, so if anyone wants to double-check if I compiled go1.23.5+564197 correctly, here's a list of steps:
$ git clone https://go.googlesource.com/go
$ cd go/
$ git checkout go1.23.5
$ git fetch https://go.googlesource.com/go refs/changes/97/564197/1 && git cherry-pick FETCH_HEAD
$ cd src/
$ ./make.bash
… (go to https://github.com/amwolff/swiss/tree/main/cmd/golang/go/issue65064/random-socket-reader and build the binary using $GOROOT/bin/go build)
It seems like CL 564197 does help in some way, but I'm unsure whether the CPU time spent on locks in findRunnable is now just a proxy for latency and that the program waits for more work. The CPU usage is ~30-40% less while running the updated program on EPYC 9754 and more time spent on the task indicates we don't poll as much, so even though we're slower, we have the capacity to take on more work (?).
$ time ./random-socket-reader_go1.23.5 1000 100 10485760

real    0m24.475s
user    1m37.741s
sys     95m7.423s
$ time ./random-socket-reader_go1.23.5+564197 1000 100 10485760

real    0m33.903s
user    7m28.396s
sys     86m5.832s
@prattmic @ianlancetaylor if it would be helpful, I'm happy to give you access to the test machines. Also let me know if these pprof profiles are enough or if perf profiles going down to the kernel calls are more helpful here.
Comment From: amwolff
I was able to test CL 564197 with my colleagues today on one of our prod services. Here's the result:
Before:
After:
(30s) pprof.host | (90s) pprof.host
It looks like that CL fully alleviates the epoll issue. I don't know what to think about the runtime still taking up 40% of the CPU time, but there's a good chance this is just an inefficiency of our code and excessive allocations, as it looks like it's mostly GC.
While it seems effective here, I'm still concerned about the potential side effect of slower network I/O. It likely won't matter for most cases, aside from highly intensive I/O workloads like the synthetic test I mentioned earlier, but I'm unsure how to confirm it won't impact Go programs more broadly.
Comment From: prattmic
@amwolff Thank you for the reproducer and production experiment! If you don't mind, could you share a bit more about the scale of this production workload? How many cores/GOMAXPROCS? How many QPS it is handling (assuming that is a relevant metric)?
Comment From: amwolff
@prattmic Yes, of course. To explain the scale of the production workload a little better, a bit more context: one of services we run is a program that takes the inbound traffic, which is usually a large file(s), processes it and sends the processed data (expended by a constant factor) to many smaller servers we call storage nodes. In short: an upload to a machine like the one I took a profile on results in many (100+) connections and uploads to other machines in different locations. I suspect this characteristic is why the scalability problem shows up so well there.
Profiles in my previous comment are from a EPYC 9754 (128 cores, 256 vCPUs=GOMAXPROCS) machine, which we're testing in one of our locations. We typically run a fleet of 7443Ps (24 cores) but would love to see Go scale to higher core count ones for various reasons.
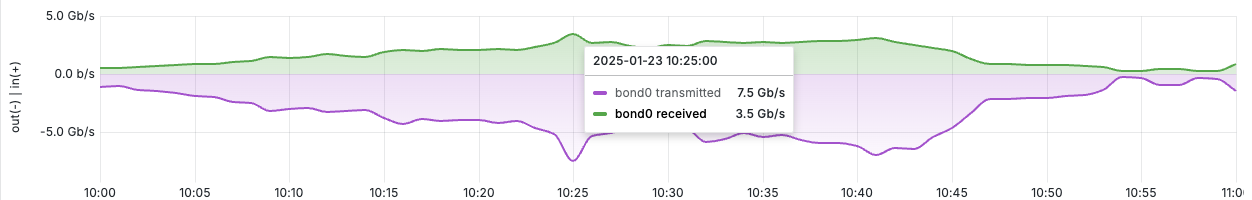
Some data from the time of the experiment:
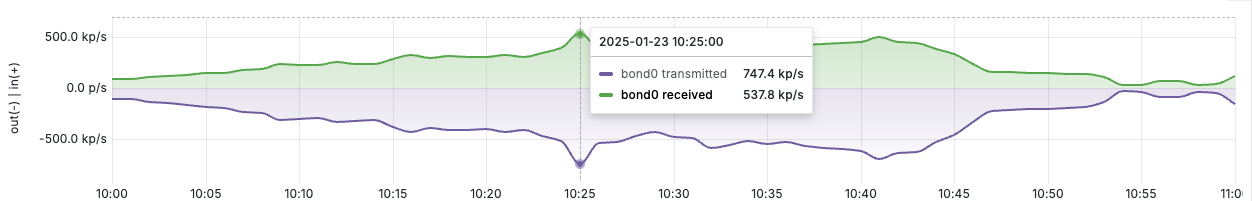
Network traffic:
Network packets:
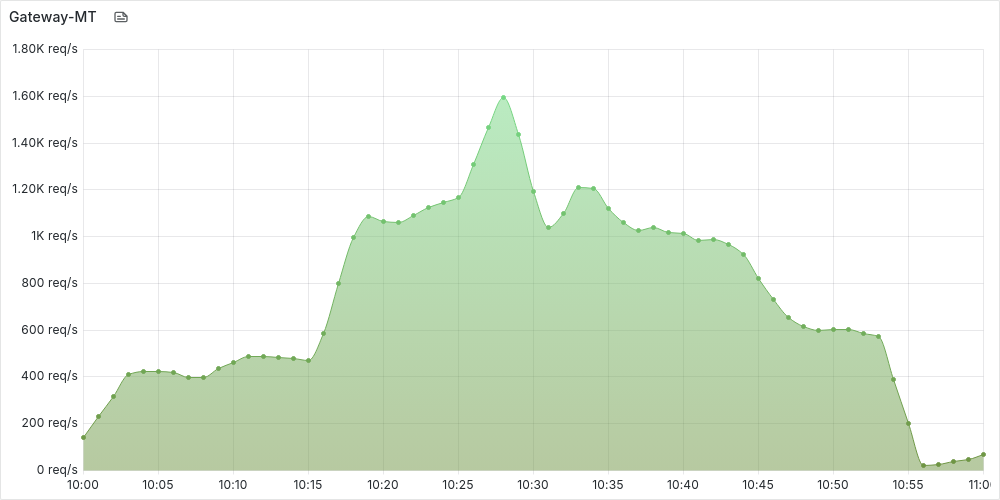
QPS:
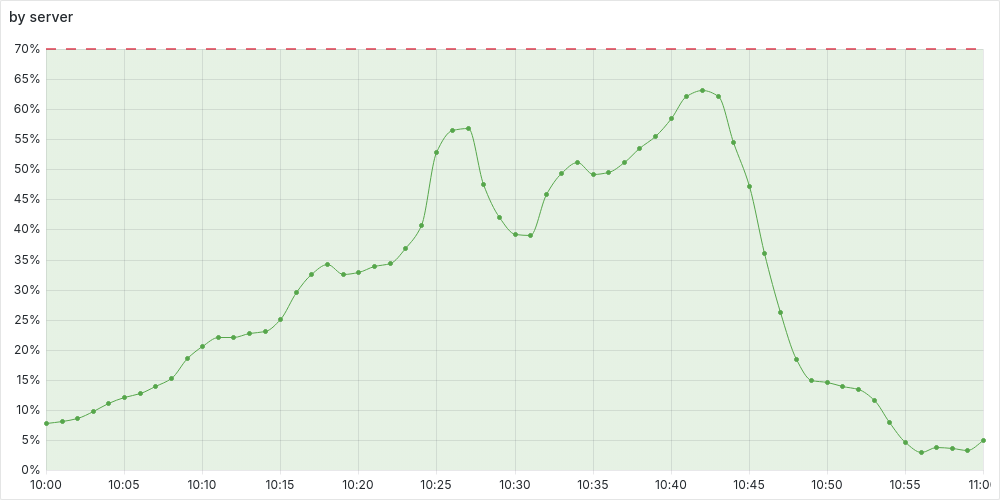
CPU:
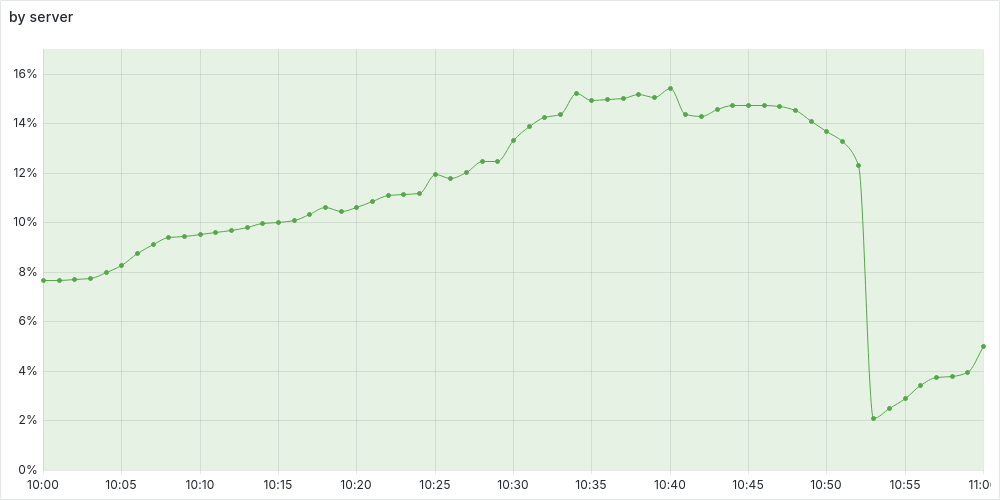
RAM:
Profiles were taken somewhere around the peaks. Let me know if you would like to see anything additional.
For comparison, here's a profile from a 7443P machine (without CL 564197): https://pprof.host/vc40/flamegraph
Comment From: prattmic
Thanks @amwolff, that's great. The GOMAXPROCS=24 profile is a nice comparison as well.
I don't know what to think about the runtime still taking up 40% of the CPU time, but there's a good chance this is just an inefficiency of our code and excessive allocations, as it looks like it's mostly GC.
Actually, most of this is the scheduler, not the GC. The GC is primary in runtime.gcBgMarkWorker (see the GC Guide for tips on identifying the GC in profiles), which is only 6.6% of time (vs 4.7% in the GOMAXPROCS=24 profile, so still up a little).
The time under runtime.schedule (~32%) is the Go scheduler. You probably got tripped up by runtime.(*gcControllerState).findRunnableGCWorker, which is related to scheduling the GC workers. This poor scaling is tracked by #68399. Per https://github.com/golang/go/issues/68399#issuecomment-2264258044, we think we've actually fixed this primary problem with https://go.dev/cl/602477, which is in 1.24. So I recommend trying out 1.24rc2 + https://go.dev/cl/564197, or just patch https://go.dev/cl/602477 into 1.23.
Other parts under runtime.schedule, such as runtime.lock and runtime.resetSpinning look like scaling issues as well. That said, even the GOMAXPROCS=24 profile is spending a lot of time in the scheduler, so I suspect that this application is entering the scheduler very often.
If you are willing to share a short (~1-5s) execution trace from the application that could better show the scheduling behavior. You can email me privately if you don't want to share publicly.
Comment From: amwolff
Thanks so much @prattmic. I compiled our application with 1.24rc2+564197 and compared it with 1.23.5+564197 and 1.23.5 compilations in a brief load test. Some observations:
- We can immediately serve 2-3x more traffic with 1.24rc2+564197 than with 1.23.5
- With the average CPU usage being 60-70% (thoughts on this in the next paragraph)
- GC pauses with default GC settings become much more visible
- However, this is likely expected and can be tuned and/or optimized
One phenomenon we couldn't explain during the load test is we couldn't get past certain CPU usage and GBit/s of traffic served, but since our testing setup is still a bit ad-hoc, afterward I realized we started to hit some limits (like conntrack's) that would explain all of that. We need to review those, make sure they won't be limiting factors and retest again, but 1.24rc2 + CL 564197 is immediately useful to us. Thank you!
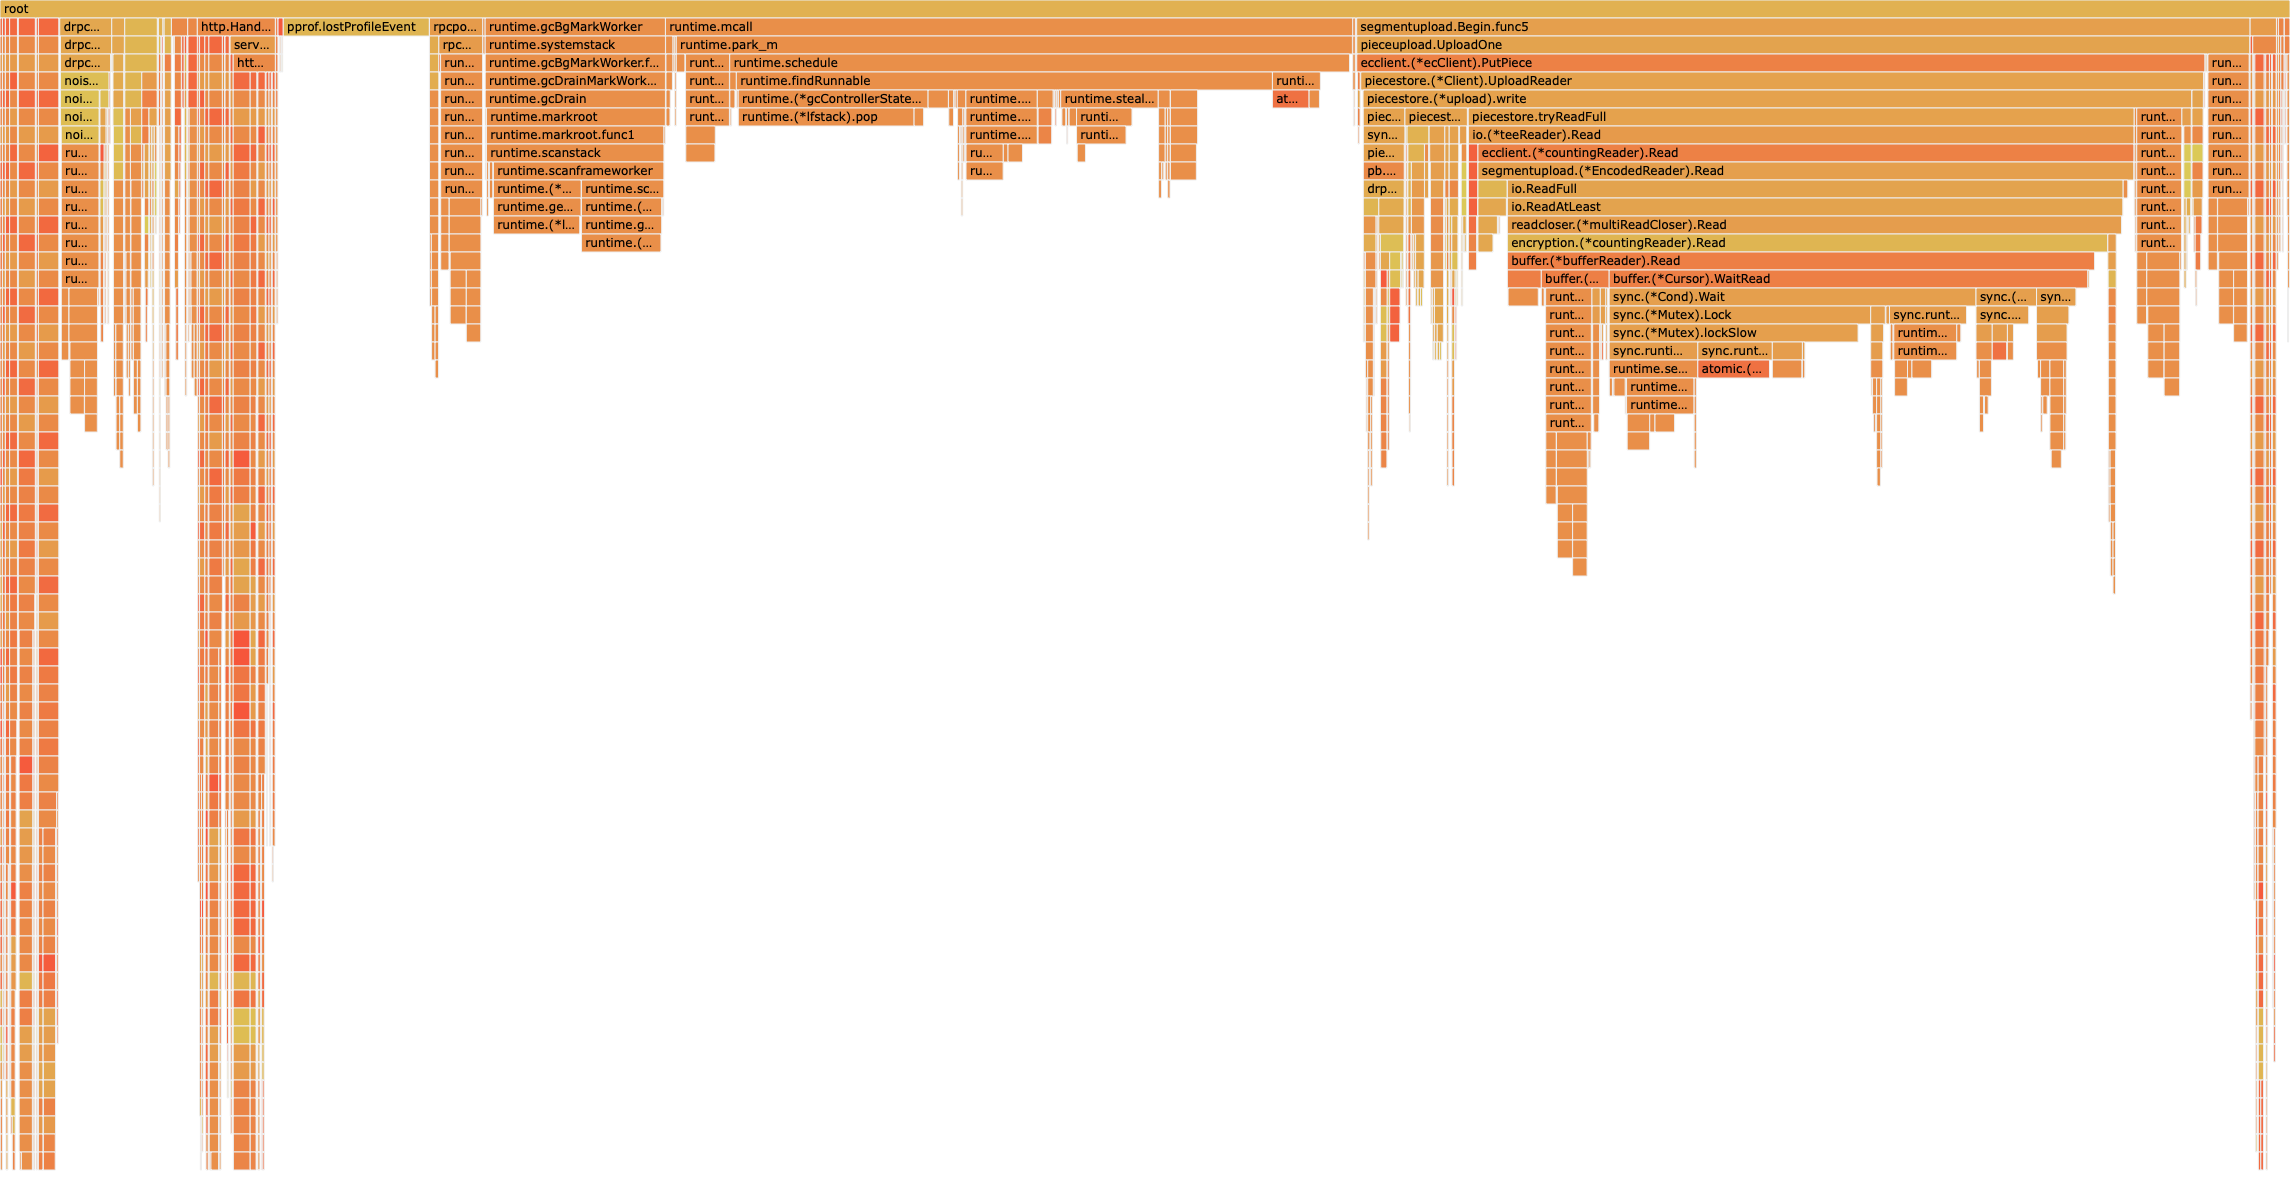
I emailed you with a spreadsheet of traces and profiles. For others, this is the matrix that I sent:

For now, I will limit myself to just posting 1.24rc2+564197 CPU profiles here:
- GOGC=off & GOMEMLIMIT=226215MiB (preview above): https://pprof.host/x440/flamegraph
- GOMEMLIMIT=226215MiB: https://pprof.host/x840/flamegraph
- no GOMEMLIMIT: https://pprof.host/xc40/flamegraph
Comment From: prattmic
Thanks, this is very useful!
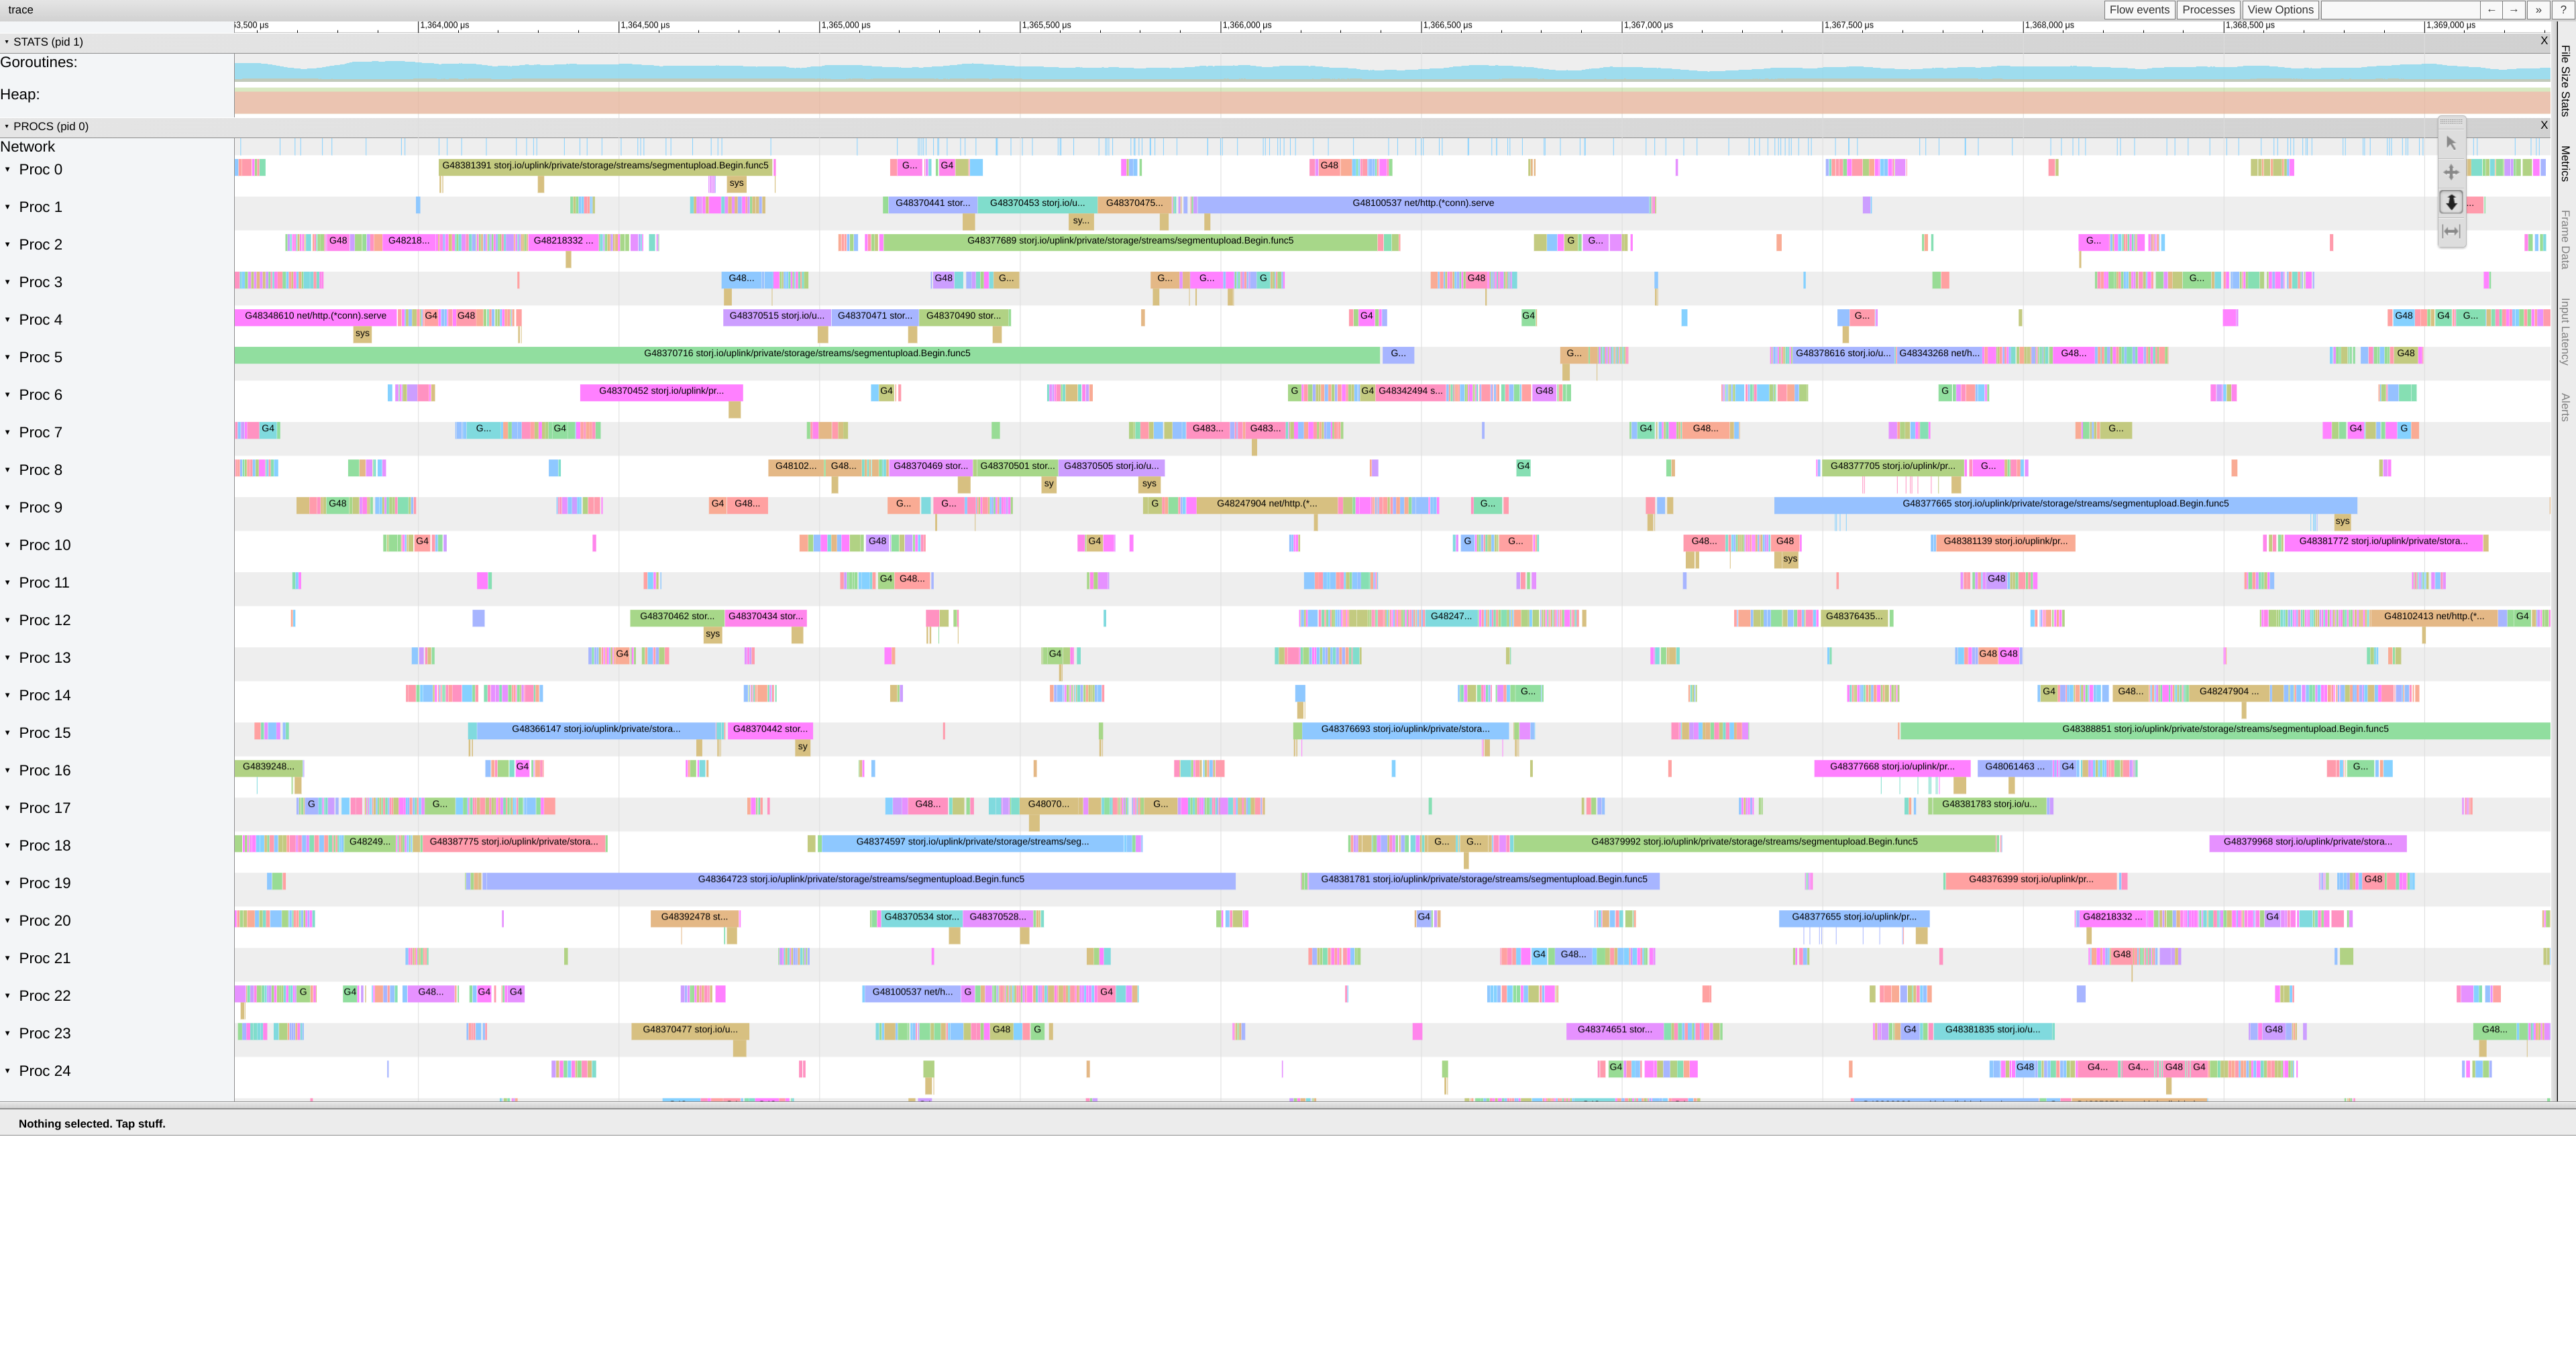
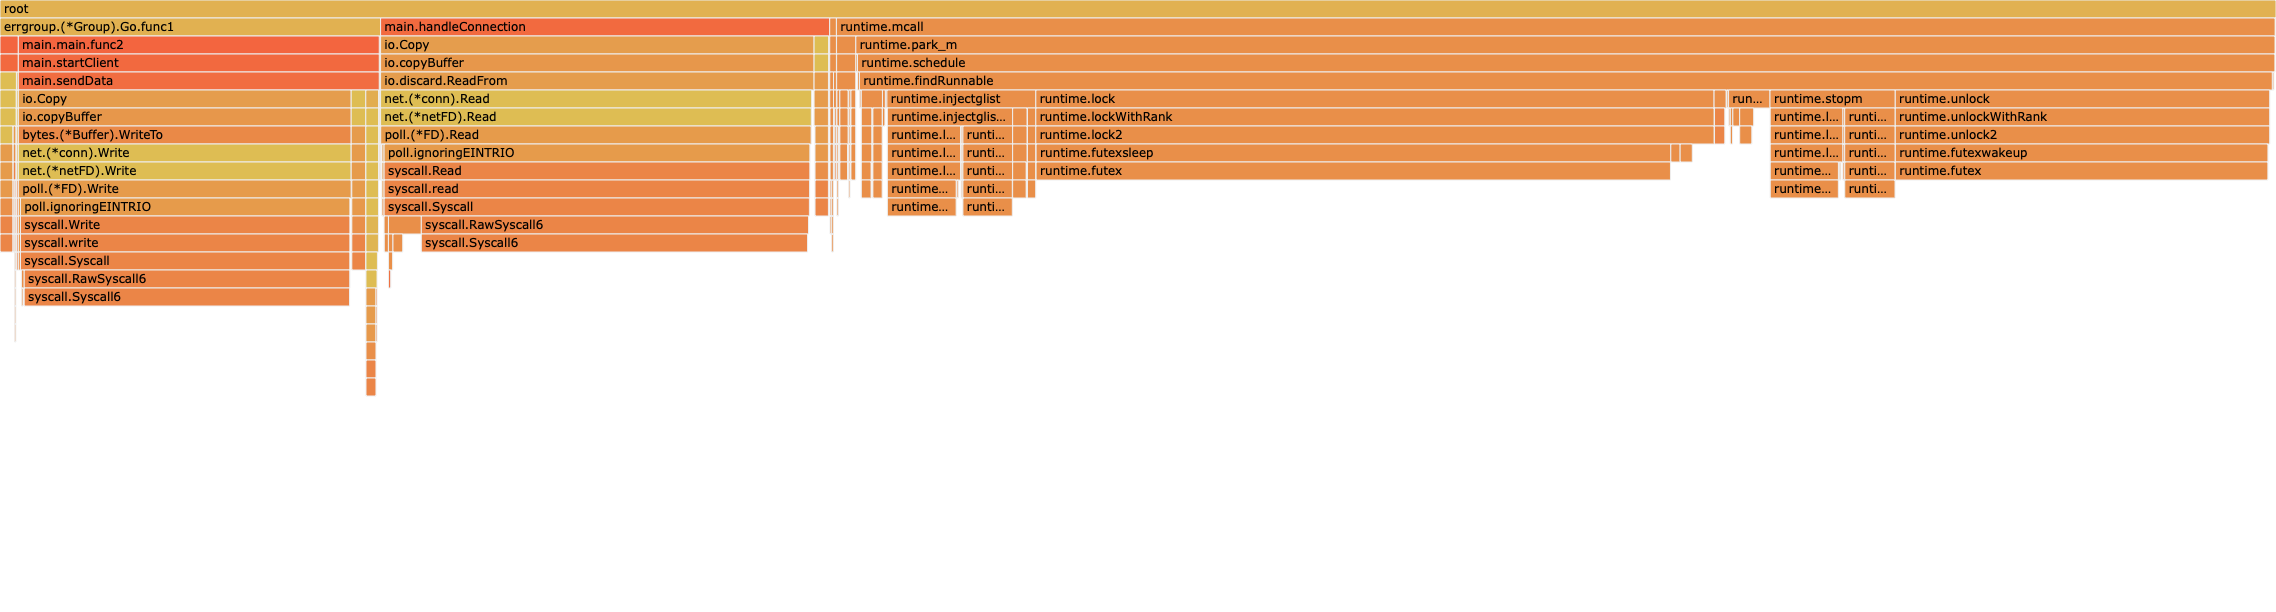
Here are two views from ~5ms of the traces.
go1.23.5:
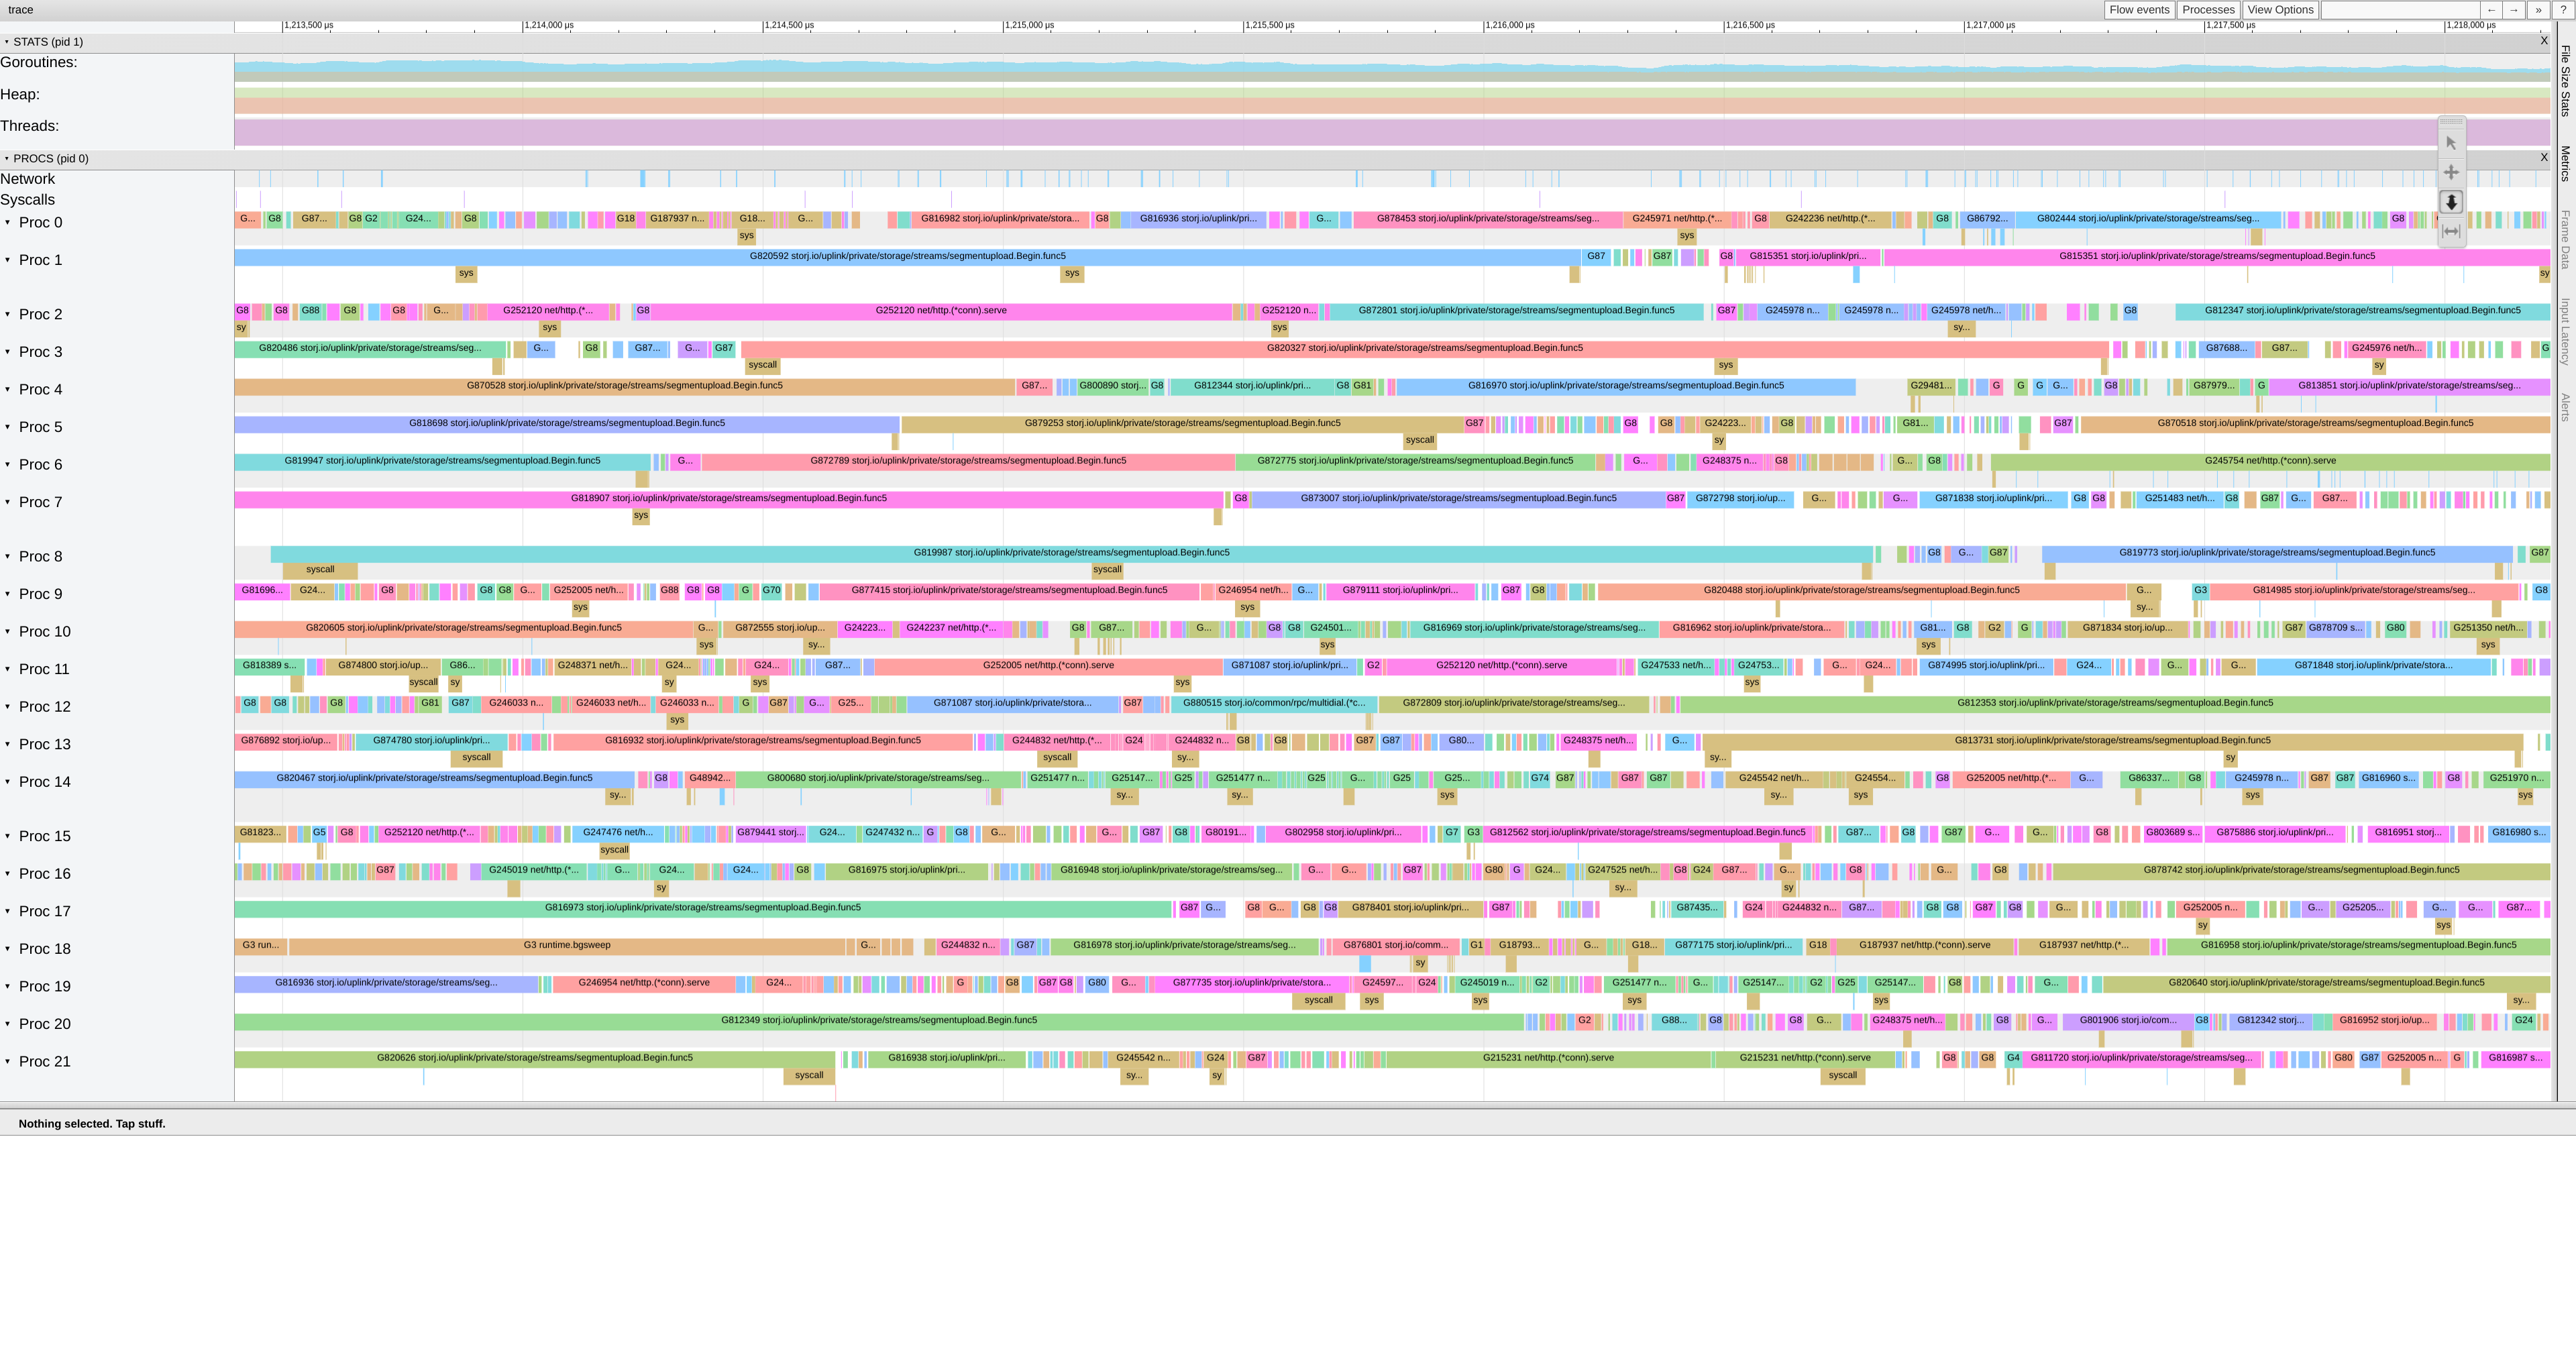
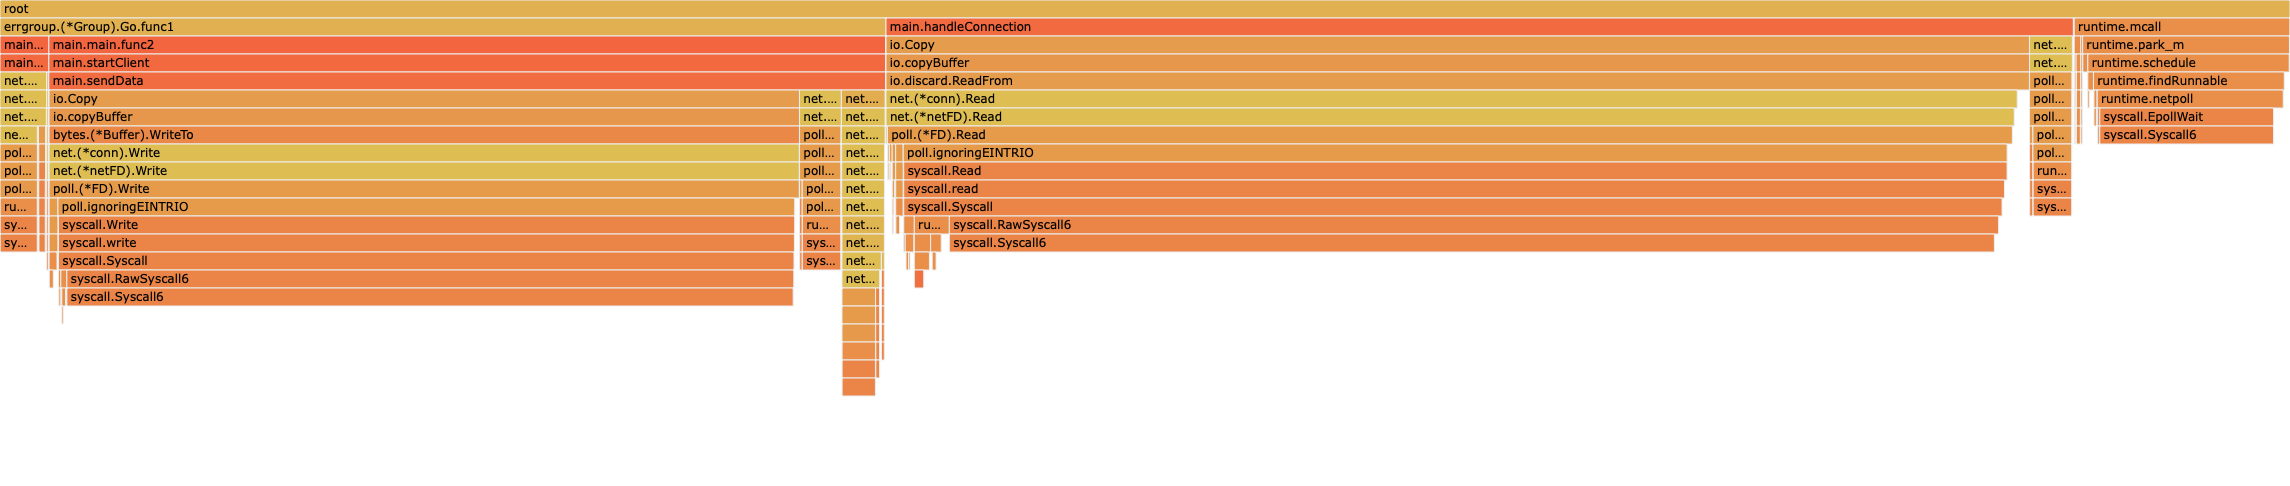
go1.24rc2+564197
In the 1.23.5 trace, all the blank spaces are times when that P is in the scheduler instead of running a goroutine, presumably spending way way too much time in epoll. The trace is actually very interesting because you can see each P run a clump of short-running goroutines between each gap. I think that is the P running all of the things in its local run queue before it needs to go look for more work.
There are lots of goroutines that run for very short periods (1-5us). Those are probably contributing to the epoll probably by entering the scheduler very frequently.
The go1.24rc2+564197 trace looks much better. Densely packed and spending most time running goroutines, even though there are still very short running goroutines around.
From the go1.24rc2+564197 profiles above, I would say that 1.24 + CL 564197 completely solves the scheduling scalability issues for this application. Only 6% of time is in runtime.schedule, which is in range for a normal Go program.
There is definitely still a scalability problem in the GC around managing work buffers. I think that is most related to #21056, so I will post discussion of those symptoms there.
Comment From: harshavardhana
Will CL 564197 be merged anytime soon? Will this be backported to go1.23.x?
Comment From: prattmic
We will likely merge CL 564197 (or something similar) for Go 1.25.
I don't expect that we will backport to 1.23 or 1.24 [1], as this is primarily a performance improvement.
[1] I know 1.24 isn't released yet, but it is mere days away!
Comment From: harshavardhana
I don't expect that we will backport to 1.23 or 1.24 [1], as this is primarily a performance improvement.
Okay we will keep back relevant backports for this locally.
Comment From: gopherbot
Change https://go.dev/cl/668735 mentions this issue: sweet/harnesses: update the version of Cockroachdb benchmarked
Comment From: gopherbot
Change https://go.dev/cl/669235 mentions this issue: runtime: only poll network from one P at a time in findRunnable
Comment From: gopherbot
Change https://go.dev/cl/670416 mentions this issue: sweet/harnesses: update the version of CockroachDB benchmarked
Comment From: cagedmantis
@amwolff Now that Go 1.25RC1 has been released. Would you be willing and able to test your workloads with it since it includes the CL 669235?
Comment From: cagedmantis
Closing this issue as we think we have an adequate solution.