Go version
go version 1.24.4 on linux
Output of go env in your module/workspace:
AR='ar'
CC='gcc'
CGO_CFLAGS='-O2 -g'
CGO_CPPFLAGS=''
CGO_CXXFLAGS='-O2 -g'
CGO_ENABLED='1'
CGO_FFLAGS='-O2 -g'
CGO_LDFLAGS='-O2 -g'
CXX='g++'
GCCGO='gccgo'
GO111MODULE=''
GOAMD64='v1'
GOARCH='amd64'
GOAUTH='netrc'
GOBIN=''
GOCACHE='/home/tiago/.cache/go-build'
GOCACHEPROG=''
GODEBUG=''
GOENV='/home/tiago/.config/go/env'
GOEXE=''
GOEXPERIMENT=''
GOFIPS140='off'
GOFLAGS=''
GOGCCFLAGS='-fPIC -m64 -pthread -Wl,--no-gc-sections -fmessage-length=0 -ffile-prefix-map=/tmp/go-build3237773918=/tmp/go-build -gno-record-gcc-switches'
GOHOSTARCH='amd64'
GOHOSTOS='linux'
GOINSECURE=''
GOMOD='/dev/null'
GOMODCACHE='/home/tiago/work/go/pkg/mod'
GONOPROXY='gitlab.nereides.weborama.com'
GONOSUMDB='gitlab.nereides.weborama.com'
GOOS='linux'
GOPATH='/home/tiago/work/go'
GOPRIVATE='gitlab.nereides.weborama.com'
GOPROXY='https://proxy.golang.org,direct'
GOROOT='/usr/local/go1.24.4'
GOSUMDB='sum.golang.org'
GOTELEMETRY='on'
GOTELEMETRYDIR='/home/tiago/.config/go/telemetry'
GOTMPDIR=''
GOTOOLCHAIN='auto'
GOTOOLDIR='/usr/local/go1.24.4/pkg/tool/linux_amd64'
GOVCS=''
GOVERSION='go1.24.4'
GOWORK=''
PKG_CONFIG='pkg-config'
What did you do?
while I was trying to analyse a 5s trace from my application, using the snipped presented on https://pkg.go.dev/net/http/pprof
curl -o trace.out http://localhost:6060/debug/pprof/trace?seconds=5
go tool trace trace.out
What did you see happen?
the tool open my default browser in the trace page
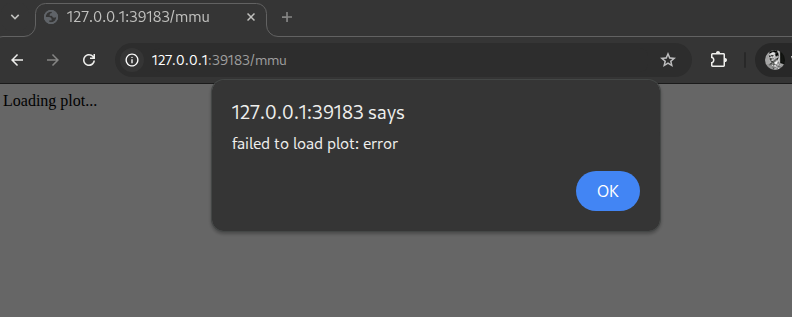
When I click on the link Minimum mutator utilization that uses endpoint /mmu I got a modal with an error (see screenshot below) and I can see the following panic stack trace:
2025/06/13 14:43:05 http: panic serving 127.0.0.1:44114: runtime error: index out of range [0] with length 0
goroutine 77 [running]:
net/http.(*conn).serve.func1()
    net/http/server.go:1947 +0xbe
panic({0x9324c0?, 0xc000028330?})
    runtime/panic.go:792 +0x132
internal/trace/traceviewer.(*mmu).HandlePlot(0xc000236030, {0xcbf2f8, 0xc002a40460}, 0xc002a3e140)
    internal/trace/traceviewer/mmu.go:140 +0x9a6
main.main.MMUHandlerFunc.func21({0xcbf2f8, 0xc002a40460}, 0xc002a3e140)
    internal/trace/traceviewer/mmu.go:52 +0x67
net/http.HandlerFunc.ServeHTTP(0xc0002320c0?, {0xcbf2f8?, 0xc002a40460?}, 0x761436?)
    net/http/server.go:2294 +0x29
net/http.(*ServeMux).ServeHTTP(0x474d79?, {0xcbf2f8, 0xc002a40460}, 0xc002a3e140)
    net/http/server.go:2822 +0x1c4
net/http.serverHandler.ServeHTTP({0xc0000c9c80?}, {0xcbf2f8?, 0xc002a40460?}, 0x6?)
    net/http/server.go:3301 +0x8e
net/http.(*conn).serve(0xc002a60090, {0xcbfa30, 0xc0002361b0})
    net/http/server.go:2102 +0x625
created by net/http.(*Server).Serve in goroutine 1
    net/http/server.go:3454 +0x485
To be honnest, this is not a big issue, but it is annoying
By check go source code, I find the possible root cause
https://cs.opensource.google/go/go/+/refs/tags/go1.24.4:src/internal/trace/traceviewer/mmu.go;l=140
I believe the mu slice is empty, then when try to fetch mu[0] it panics.
probably some basic length check can be done to prevent it. I could try to send a Pull Request however I have no idea what should be the output (perhaps a 404 ?)
What did you expect to see?
No panic and perhaps a nice message about "having no data to show"
Comment From: peczenyj
this is the trace file, in case it is needed: trace.out.zip
Comment From: gabyhelp
Related Issues
- cmd/pprof: runtime error: slice bounds out of range on "view source" #46636 (closed)
- net/http/pprof, cmd/internal/objfile: panic: runtime error: slice bounds out of range in disasm.go #36621 (closed)
- runtime: slice bounds out of range: panic during panic #44075 (closed)
- reflect: slice index out of range #31801 (closed)
- cmd/pprof: index out of bounds crash #33802 (closed)
- x/pkgsite: panic in localdatasource #44704 (closed)
- net/http: panic: runtime error: slice bounds out of range #12339 (closed)
- runtime: crash in MSpan_Sweep with Go 1.4 #15769 (closed)
- cmd/godoc: panics when attempting to serve a pkg doc page with empty ExampleXXX #3092 (closed)
Related Discussions
(Emoji vote if this was helpful or unhelpful; more detailed feedback welcome in this discussion.)
Comment From: cherrymui
cc @golang/runtime @mknyszek @cagedmantis
Comment From: mknyszek
Huh. I'm slightly worried there's a deeper bug here, that a simple length check would just end up hiding. I'll take a look at the trace file and try to see what the appropriate behavior here should be based on the trace data.
Comment From: mknyszek
I think I'm finding multiple UI issues with this trace. 😅 This is a useful test case. I'll send some fixes.
Comment From: peczenyj
Huh. I'm slightly worried there's a deeper bug here, that a simple length check would just end up hiding. I'll take a look at the trace file and try to see what the appropriate behavior here should be based on the trace data.
The program that generates this trace is quite old (compiled with go 1.20.6), not sure if it matters