A clear and concise description of what the bug is.
How to reproduce the bug
Create a stacked bar chart having metrics like the ones of the third image Set logarithmic scale
Expected results
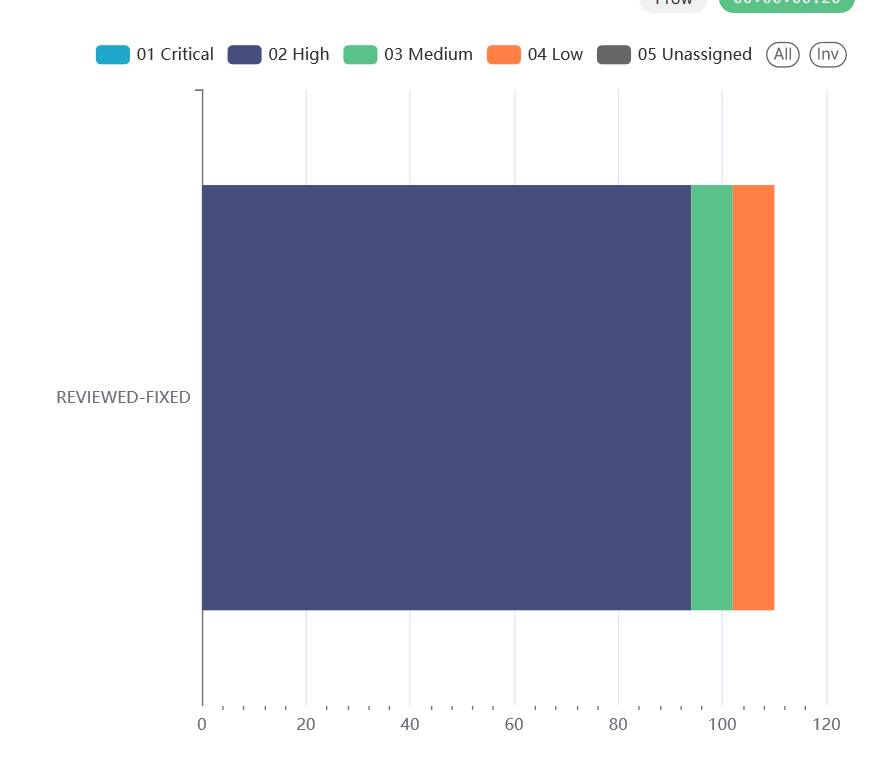
I expected to see the rectangles for the 3 available values ( High, Medium, Low)
Actual results
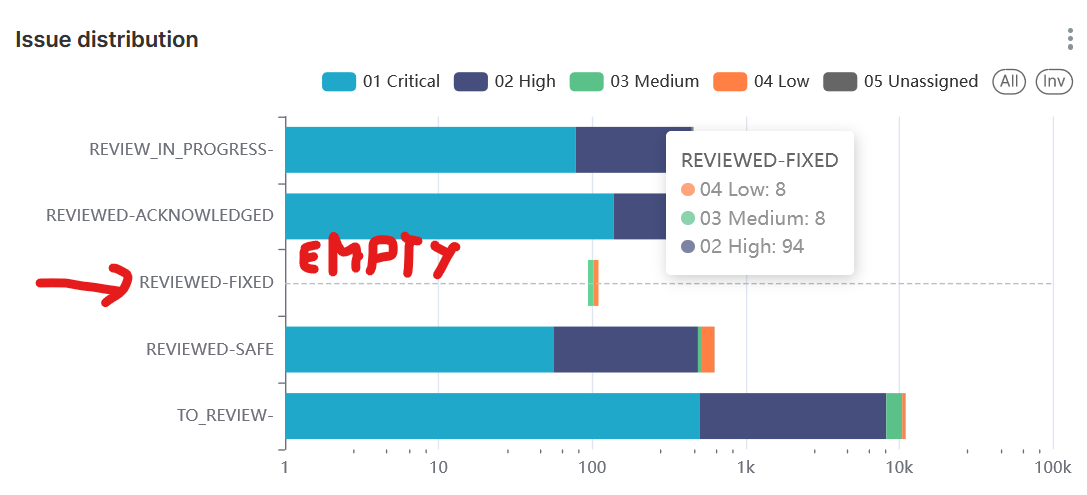
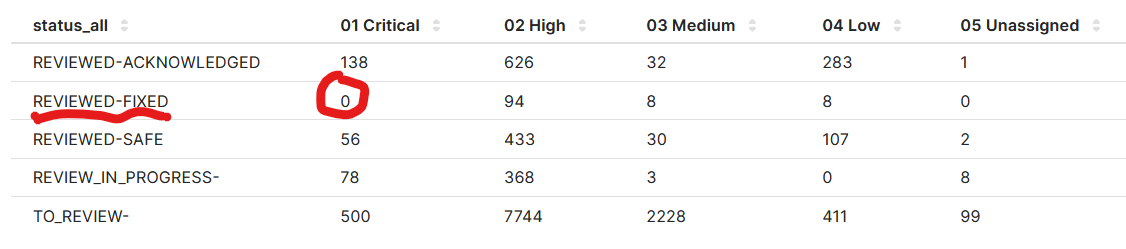
Only 2 of 3 rectangles are displayed ( High is missing, see first image), using linear scale no issues in the visualization ( see second image) is it possible that the problem is related to the fact that critical value is zero ( see third image) ?
Screenshots
Logarithmic scale chart
Same chart in linear scale
Data to be visualized in chart
Environment
(please complete the following information):
- browser type and version: Firefox
- superset version: latest commit
- python version: 3.9.18
- node.js version:
node -v - any feature flags active:
Checklist
Make sure to follow these steps before submitting your issue - thank you!
- [X] I have checked the superset logs for python stacktraces and included it here as text if there are any.
- [X] I have reproduced the issue with at least the latest released version of superset.
- [X] I have checked the issue tracker for the same issue and I haven't found one similar.
Additional context
Comment From: rusackas
Quite right, still happening in 4.0
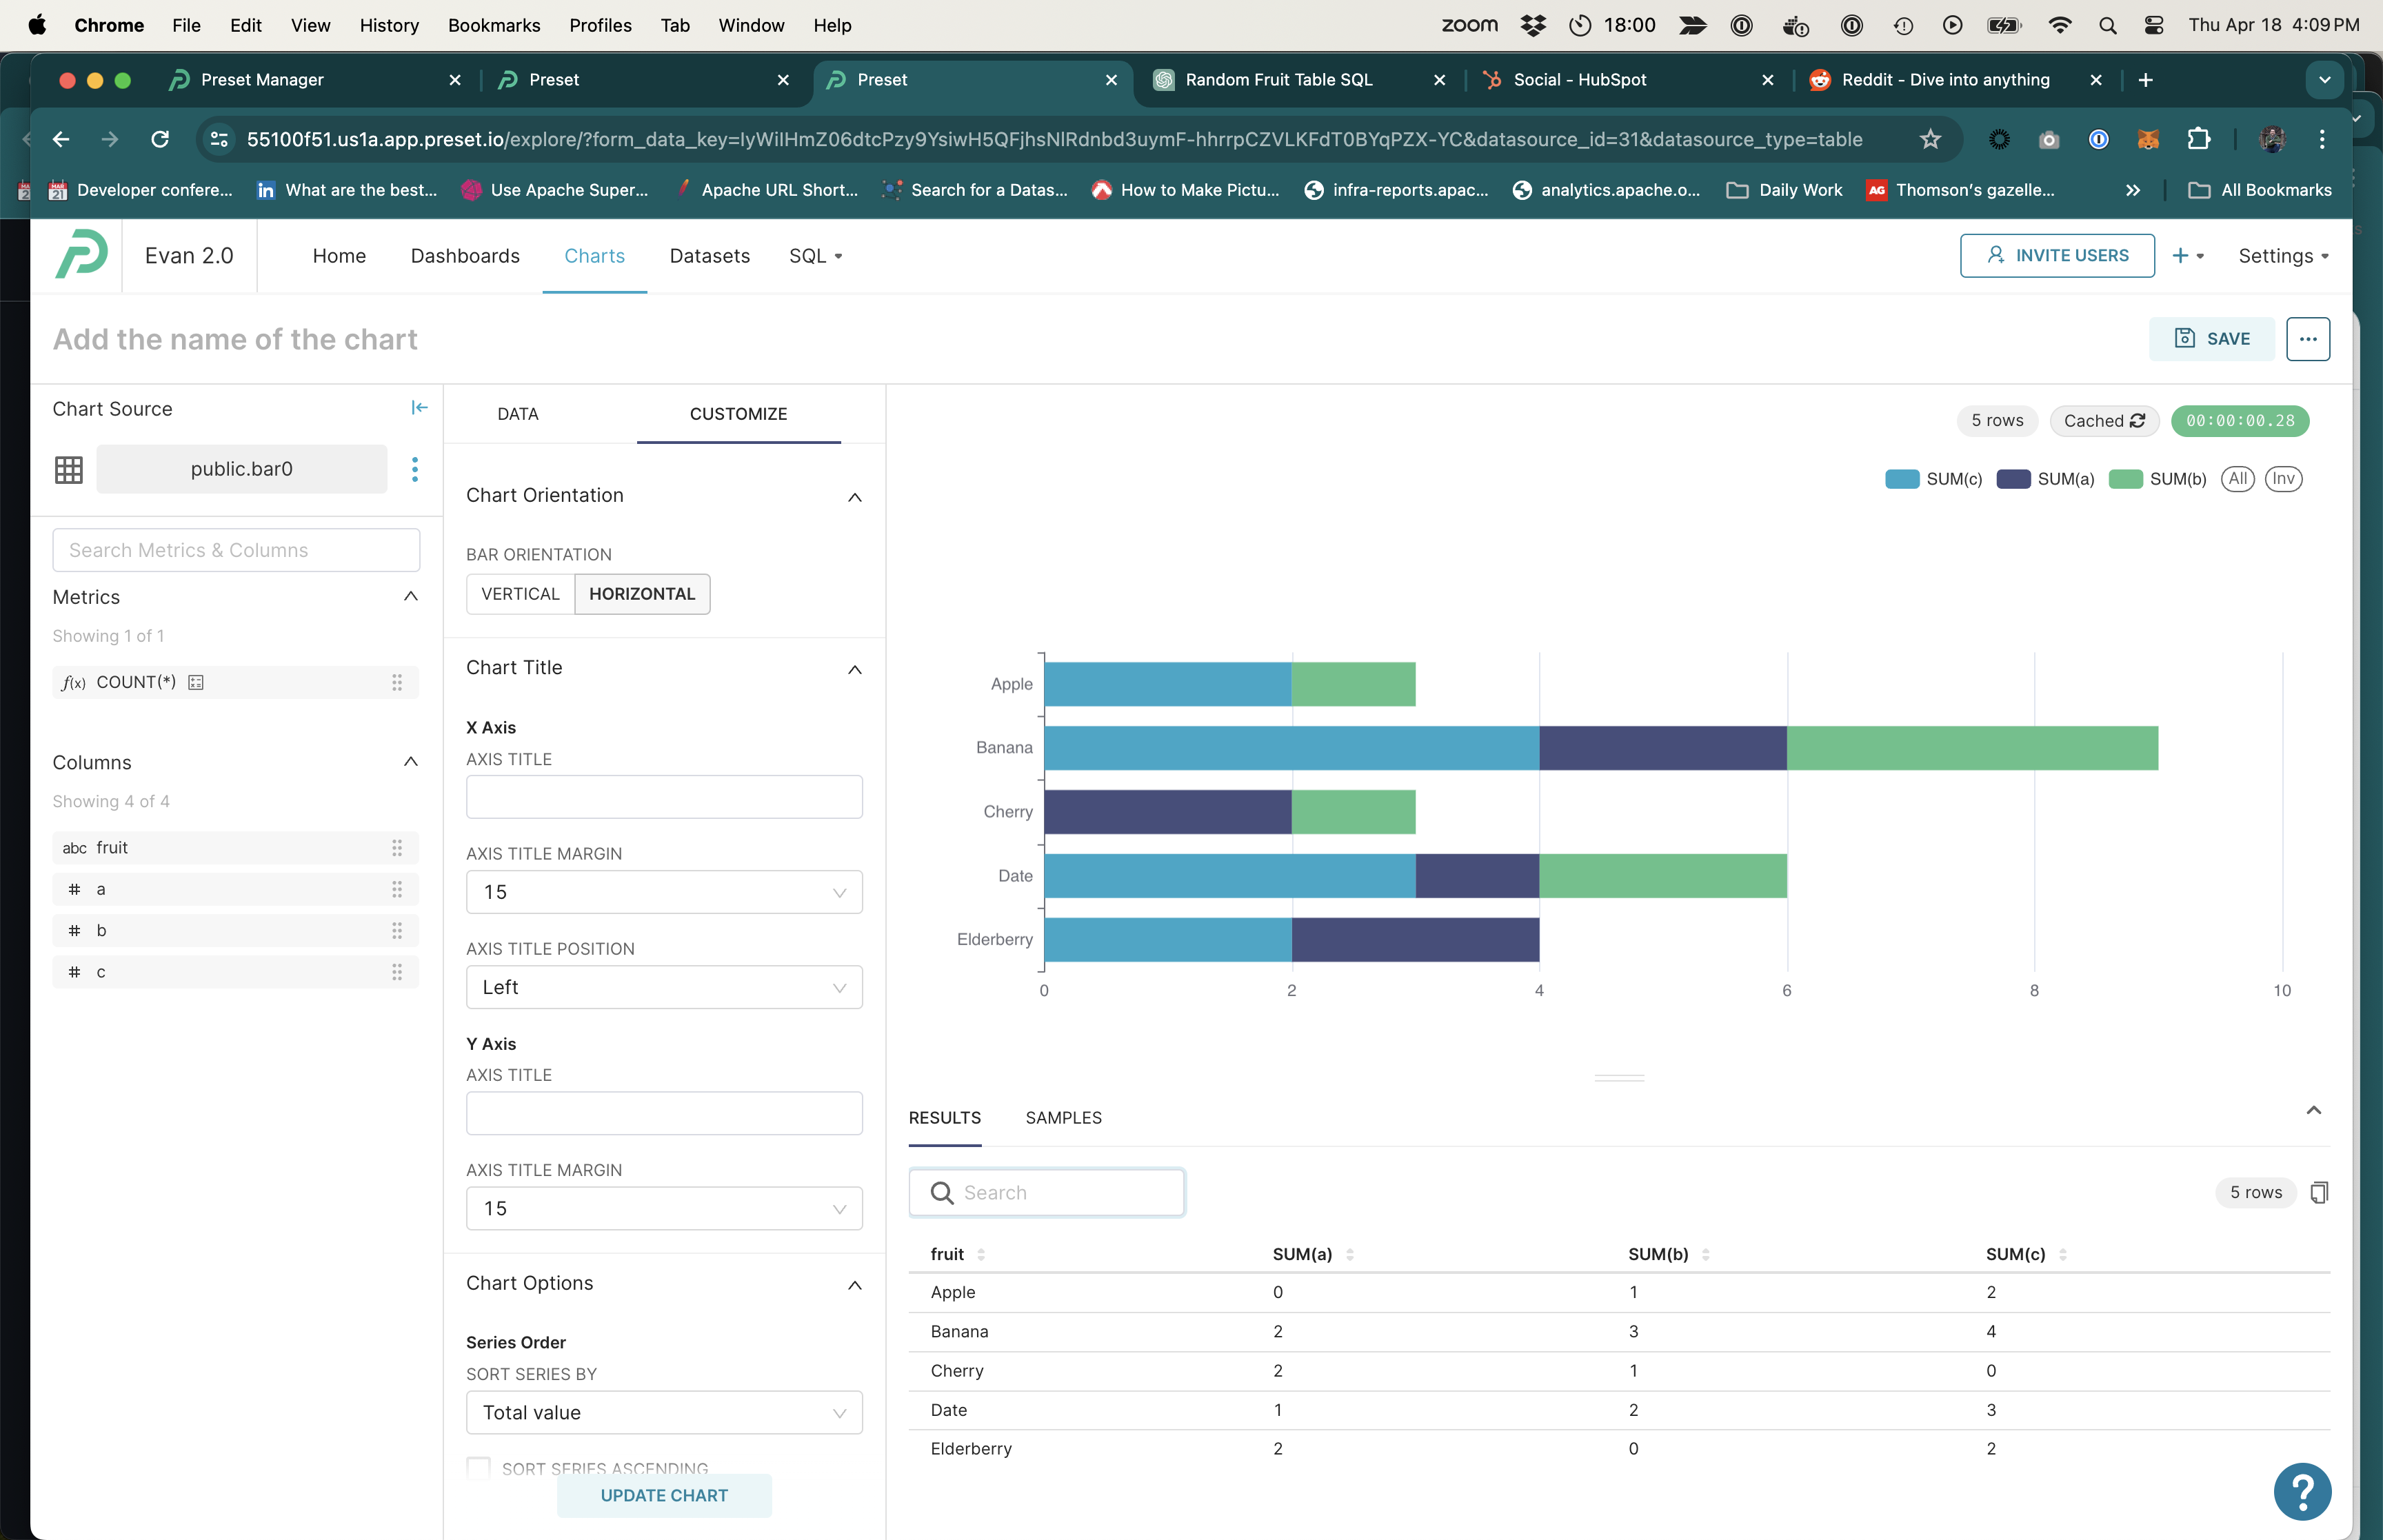
Log axis off (fine):
Log axis on (problem):
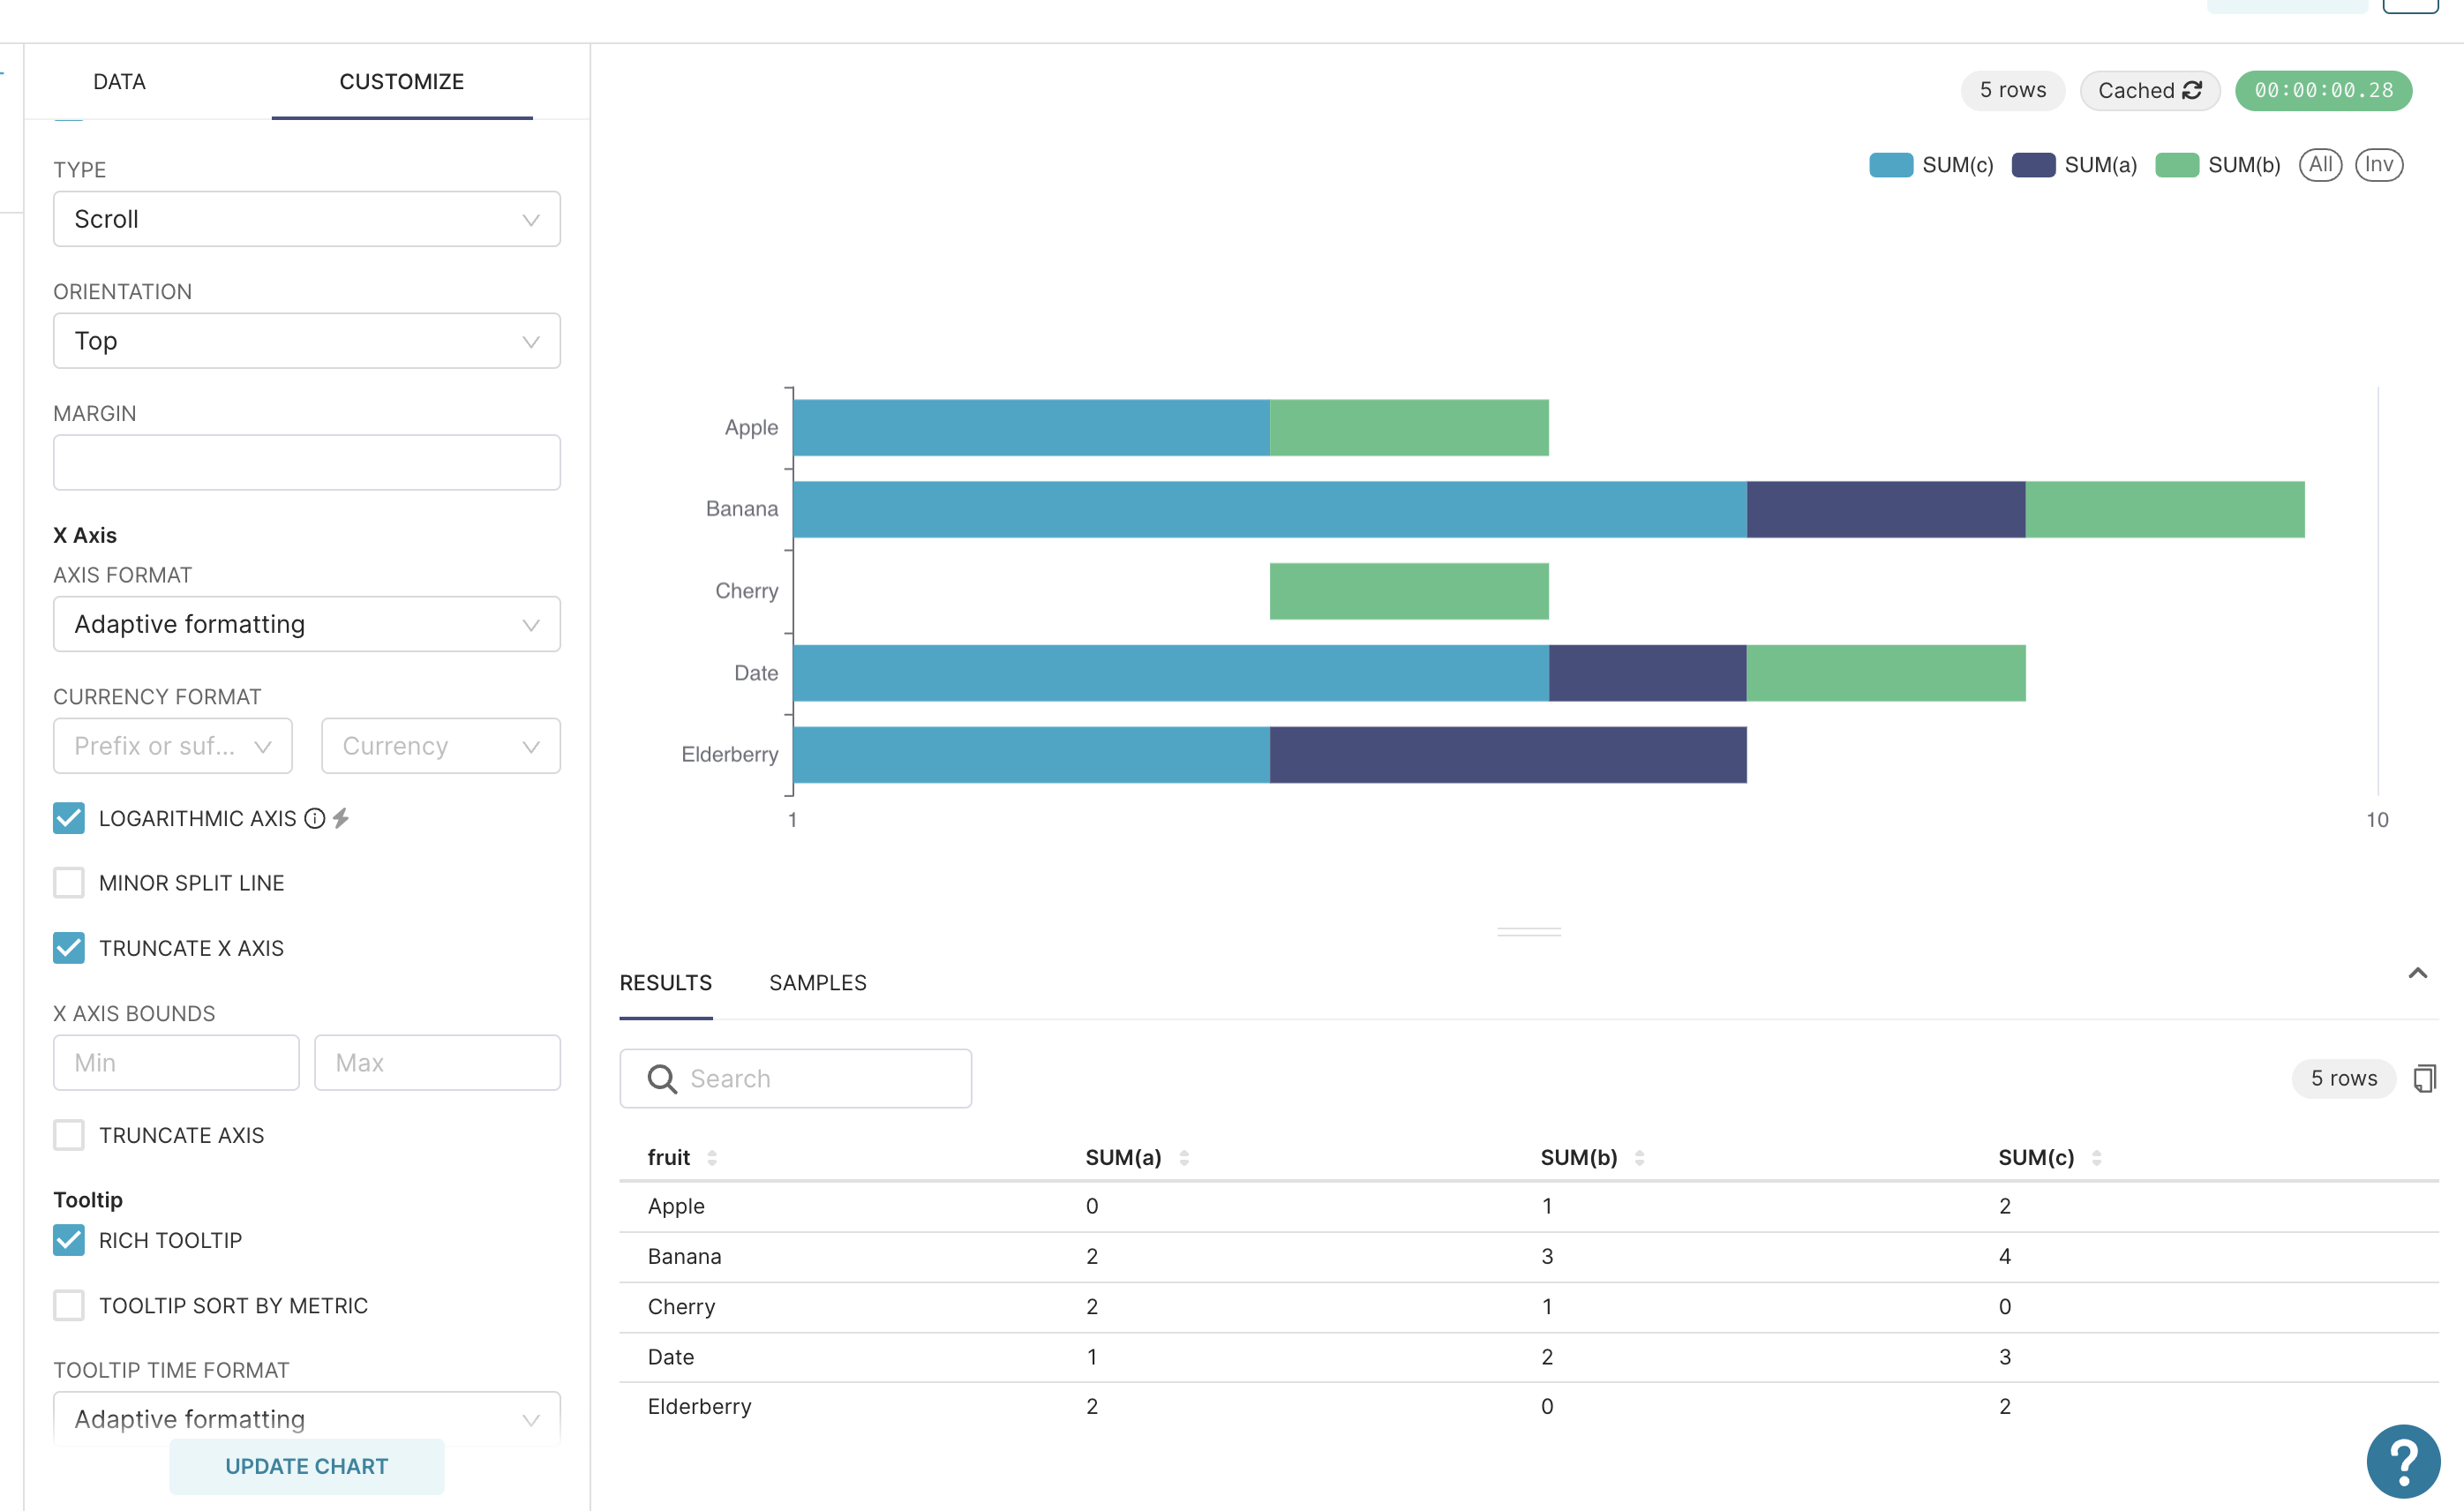
Note that there are 0 values in columns, a, b, and c, but for some reason only a seems to be a problem.
The chart does this in vertical AND horizontal mode.
Here's a query if anyone wants some mock data:
SELECT fruit, a, b, c FROM (
    VALUES
    ('Apple', 0, 1, 2),
    ('Banana', 2, 3, 4),
    ('Cherry', 2, 1, 0),
    ('Date', 1, 2, 3),
    ('Elderberry', 2, 0, 2)
) AS temp_table (fruit, a, b, c);
Comment From: rusackas
This has been quiet for upward of a year again. I'm assuming it's still happening, but would appreciate if someone has time to confirm.
Comment From: shexiaobin

mee too
Comment From: rusackas
This one is still present in Superset/Preset as of today.