Go version
go version go1.24.1 linux/amd64
Output of go env in your module/workspace:
go env Output
AR='ar'
CC='gcc'
CGO_CFLAGS='-O2 -g'
CGO_CPPFLAGS=''
CGO_CXXFLAGS='-O2 -g'
CGO_ENABLED='1'
CGO_FFLAGS='-O2 -g'
CGO_LDFLAGS='-O2 -g'
CXX='g++'
GCCGO='gccgo'
GO111MODULE=''
GOAMD64='v1'
GOARCH='amd64'
GOAUTH='netrc'
GOBIN=''
GOCACHE='/home/.../.cache/go-build'
GOCACHEPROG=''
GODEBUG=''
GOENV='/home/.../.config/go/env'
GOEXE=''
GOEXPERIMENT=''
GOFIPS140='off'
GOFLAGS=''
GOGCCFLAGS='-fPIC -m64 -pthread -Wl,--no-gc-sections -fmessage-length=0 -ffile-prefix-map=/tmp/go-build1182549097=/tmp/go-build -gno-record-gcc-switches'
GOHOSTARCH='amd64'
GOHOSTOS='linux'
GOINSECURE=''
GOMOD='/dev/null'
GOMODCACHE='/home/.../go/pkg/mod'
GONOPROXY=''
GONOSUMDB=''
GOOS='linux'
GOPATH='/home/.../go'
GOPRIVATE=''
GOPROXY='https://proxy.golang.org,direct'
GOROOT='/home/.../sdk/go1.24.1'
GOSUMDB='sum.golang.org'
GOTELEMETRY='local'
GOTELEMETRYDIR='/home/.../.config/go/telemetry'
GOTMPDIR=''
GOTOOLCHAIN='auto'
GOTOOLDIR='/home/.../sdk/go1.24.1/pkg/tool/linux_amd64'
GOVCS=''
GOVERSION='go1.24.1'
GOWORK=''
PKG_CONFIG='pkg-config'
What did you do?
I saw @felixge report in Gopher Slack:
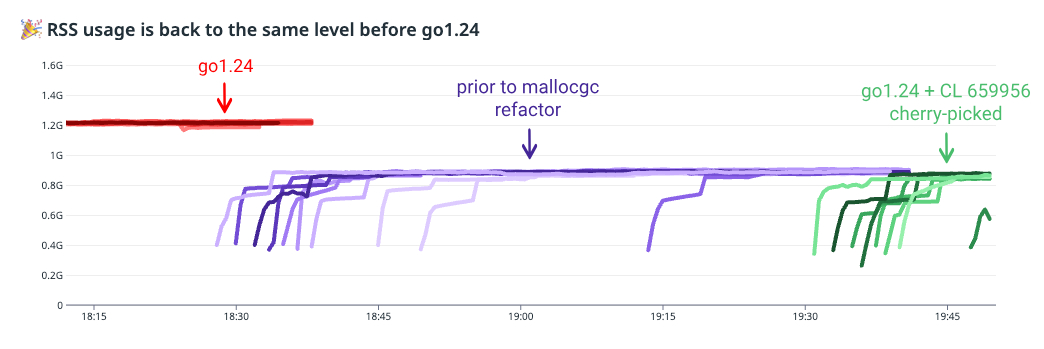
After upgrading to go1.24, we have one service that saw its RSS memory usage increase from 1 GiB to 1.2 GiB.
Interestingly, the Go-reported accounting did not seem to change.
I have a simple GC benchmarking utility that has been useful in the past to illustrate some Go runtime problems (or to illustrate something is just expected behavior and rule out bad behavior by the runtime).
I did a quick-and-dirty edit to it to have it run through various permutations of "interesting" memory properties that might be related to the issue @felixge reported, and then tested it via a few nested bash loops that ran through different flag combinations.
Sample run:
$ go install golang.org/dl/go1.23.7@latest && go1.23.7 download
$ go install golang.org/dl/go1.24.1@latest && go1.24.1 download

$ go1.23.7 run github.com/thepudds/heapbench@669420526 -livekind=nodechannel -livesize=large \
  -baseheap=512 -garbagerate=128 -leakrate=0 -jobrate=100 -worktime=20ms -stats=2s

$ go1.24.1 run github.com/thepudds/heapbench@669420526 -livekind=nodechannel -livesize=large \
  -baseheap=512 -garbagerate=128 -leakrate=0 -jobrate=100 -worktime=20ms -stats=2s
Note this is on an Ubuntu 22.04.5 LTS VM. (Given this seemingly hasn't been reported yet, I wonder if it might depend on the distro or a OS config).
What did you see happen?
                               RSS (MiB)
                               mean    stdev   count
nodechannel-large   go1.23    688.8     89.3    44.0
nodechannel-large   go1.24   1263.9     81.0    44.0
-----------------------------------------------------
nodechannel-medium  go1.23    899.5    64.0     44.0
nodechannel-medium  go1.24    889.1    79.7     44.0
-----------------------------------------------------
nodechannel-small   go1.23   2945.7    283.3    43.0
nodechannel-small   go1.24   2955.0    300.7    43.0
-----------------------------------------------------
intchannel-large    go1.23    698.2    71.3     44.0
intchannel-large    go1.24    697.5    76.0     44.0
-----------------------------------------------------
intchannel-medium   go1.23    868.4    56.3     44.0
intchannel-medium   go1.24    867.0    56.4     44.0
-----------------------------------------------------
intchannel-small    go1.23   2923.1   247.2     43.0
intchannel-small    go1.24   2926.6   280.6     43.0
-----------------------------------------------------
Here, we can see nodechannel-large has a much higher RSS in go1.24 compared to go1.23, whereas the other experiments above have basically the same RSS between go1.24 and go1.23.
- The "large" suffix represents individual allocations should in theory be over 32KiB at a time (so beyond the allocator size classes, and what the allocator calls a large object).
- The "medium" and "small" are below 32KiB.
- The "nodechannel" prefix represents allocations of
chan node, where thenodetype contains pointers. - The "intchannel" prefix represents allocations of
chan int64, whereint64of course does not have pointers.
The node type:
type node struct {
    pointers [3]*node
    next     *node
    _        [4]int
}
I ran a git bisect, which pointed to https://go.dev/cl/614257. That's part of the big mallocgc refactor and at least in the neighborhood of plausible:
8730fcf88531152c42de9ff1e80d9b3c762d9944 is the first bad commit
Date:   Wed Sep 18 21:17:03 2024 +0000

runtime: refactor mallocgc into several independent codepaths
The measured RSS results from the bisect:
                                RSS (MiB)
                                  mean
20250131-085043-37f27fbecd.out: 1209.3
20241023-151814-3cb0c039e9.out: 1217.0
20240903-222652-f90f7e90b3.out:  650.7
20240925-235600-80143607f0.out:  636.4
20241007-191201-7e2487cf65.out:  633.2
20241021-133902-0492d936c5.out:  636.5
20241021-184247-971ab11ee2.out: 1211.1
20241021-155625-8730fcf885.out: 1209.3
20241021-151809-e3d372aea8.out:  644.1
20241021-154815-8df6413e11.out:  669.9
20241021-154820-6686edc0e7.out:  640.4
20241021-155537-60ee99cf5d.out:  639.3
What did you expect to see?
Ideally, similar RSS values.
CC @mknyszek, @prattmic
Comment From: thepudds
Note that @felixge might of course have been observing some other phenomena, but this seemed worth reporting given it seems to be reproducible.
Also, note that the RSS difference does not seem to be limited to channels:
                               RSS (MiB)
                              mean    stdev  count
nodemap-large    go1.23   1066.6    212.6   44.0
nodemap-large    go1.24   2151.8    214.5   44.0
------------------------------------------------
intmap-large     go1.23   1224.6    230.3   44.0
intmap-large     go1.24   1225.9    239.4   44.0
------------------------------------------------
nodeslice-large  go1.23    628.0     91.9   44.0
nodeslice-large  go1.24   1265.1     82.3   44.0
------------------------------------------------
intslice-large   go1.23    627.0     77.6   44.0
intslice-large   go1.24    629.5     69.8   44.0
------------------------------------------------
The naming conventions there are similar to those explained above.
I have more data, but maybe that's enough of a thread to tug on.
Finally, this does seem to be reproducible (e.g., see the go run commands above), but there's a non-zero chance I made a mistake in my quick-and-dirty edit to thepudds/heapbench, so some chance my description of when it does and does not happen is off... but if it's reproducible, hopefully we can tease it apart even if my description is off.
Comment From: gabyhelp
Related Issues
- runtime: excessive memory use between 1.21.0 -> 1.21.1 due to hugepages and the linux/amd64 `max_ptes_none` default of 512 #64332 (closed)
- runtime.malg: memory leak #66564 (closed)
- runtime/cgo: Memory RSS has been growing abnormally when call cgo and go #43160 (closed)
- runtime: Go RSS memory does not decrease, memory not returned to OS #39779 (closed)
- all: resident set size keeps on increasing, but no memory leaks #38257 (closed)
- runtime: performance degradation in high-load long running applications #32398
- runtime: heap fragmentation leads to high HeapInUse usage #18896 (closed)
- runtime: RSS keeps on increasing, suspected scavenger issue #36398 (closed)
- x/net/http2: Memory leak regression introduced in window updates change #56315 (closed)
- runtime: RSS creeps over 1GB even though heap is 4MB #13552 (closed)
(Emoji vote if this was helpful or unhelpful; more detailed feedback welcome in this discussion.)
Comment From: mknyszek
One thing to be careful of is that faster allocation can naturally lead to more memory use, if you're explicitly trying to allocate as fast as possible in a benchmark. The GC did not get faster in these changes, so more memory gets allocated black, and you end up with more floating garbage.
There's no increase in memory and it's a pure resource win if memory allocation is not your bottleneck, which is the case in most programs. In general, I'm skeptical of memory increases that also result in a larger heap size (indicating more floating garbage).
I'll try to reproduce and check these numbers with GODEBUG=gctrace=1. IIRC, @felixge's issue explicitly does not involve more floating garbage, which is more likely to seem like a real issue (specifically, something like I accidentally added a new touch to non-needzero memory in my malloc refactoring changes).
Comment From: mknyszek
Hm, I can't seem to reproduce. For nodechannel-large I see ~1.2 GiB in Go 1.23 and Go 1.24.
Can you run with GODEBUG=gctrace=1?
Comment From: thepudds
One other bit of data maybe worth posting is the heap goals reported by gctrace are a bit different in the "bad" vs. "good" cases, but at least at first blush, seem reasonably close.
Commit 60ee99cf5d
For example, if we look at the gctrace from running against commit 60ee99cf5d, a "good" commit from 2024-10-21 (20241021-155537-60ee99cf5d.out):
gc 15 @33.958s 0%: 0.14+108+0.033 ms clock, 0.56+1.1/104/36+0.13 ms cpu, 1223->1241->640 MB, 1254 MB goal, 0 MB stacks, 0 MB globals, 4 P
gc 16 @38.472s 0%: 0.10+92+0.035 ms clock, 0.42+54/92/0+0.14 ms cpu, 1256->1281->646 MB, 1281 MB goal, 0 MB stacks, 0 MB globals, 4 P
gc 17 @42.913s 0%: 0.12+70+0.025 ms clock, 0.50+8.8/69/64+0.10 ms cpu, 1244->1260->638 MB, 1293 MB goal, 0 MB stacks, 0 MB globals, 4 P
and the heapbench self-reported stats from the same time interval:
heapbench: @30.148s rss: 711.1 MiB, virt: 2944.7, cpu: 194.1%
heapbench: @32.152s rss: 711.1 MiB, virt: 2944.7, cpu: 199.3%
heapbench: @34.147s rss: 713.9 MiB, virt: 2944.9, cpu: 224.4%
heapbench: @36.148s rss: 713.9 MiB, virt: 2944.9, cpu: 209.5%
heapbench: @38.148s rss: 713.9 MiB, virt: 2944.9, cpu: 217.9%
heapbench: @40.150s rss: 755.4 MiB, virt: 3009.5, cpu: 225.7%
heapbench: @42.148s rss: 755.4 MiB, virt: 3009.5, cpu: 185.5%
Commit 8730fcf885
We can compare that to commit 8730fcf885, the first "bad" indicated by bisect and also from 2024-10-21 (20241021-155625-8730fcf885.out):
gc 17 @31.876s 0%: 0.069+61+0.039 ms clock, 0.27+7.0/61/88+0.15 ms cpu, 1230->1239->631 MB, 1256 MB goal, 0 MB stacks, 0 MB globals, 4 P
gc 18 @36.189s 0%: 0.051+67+0.031 ms clock, 0.20+0.57/67/85+0.12 ms cpu, 1238->1247->631 MB, 1263 MB goal, 0 MB stacks, 0 MB globals, 4 P
gc 19 @40.845s 0%: 0.11+70+0.014 ms clock, 0.44+2.2/70/81+0.059 ms cpu, 1238->1245->629 MB, 1263 MB goal, 0 MB stacks, 0 MB globals, 4 P
and the corresponding heapbench self-reported stats:
heapbench: @30.407s rss: 1276.3 MiB, virt: 2944.9, cpu: 205.7%
heapbench: @32.408s rss: 1276.8 MiB, virt: 2945.0, cpu: 219.8%
heapbench: @34.407s rss: 1276.8 MiB, virt: 2945.0, cpu: 187.2%
heapbench: @36.421s rss: 1279.1 MiB, virt: 2945.0, cpu: 247.8%
heapbench: @38.408s rss: 1279.1 MiB, virt: 2945.0, cpu: 180.1%
heapbench: @40.407s rss: 1279.1 MiB, virt: 2945.0, cpu: 188.6%
heapbench: @42.408s rss: 1279.1 MiB, virt: 2945.0, cpu: 216.4%
Comment From: thepudds
Hm, I can't seem to reproduce. For nodechannel-large I see ~1.2 GiB in Go 1.23 and Go 1.24.
Hi @mknyszek, I'm curious what distro and version?
Can you run with GODEBUG=gctrace=1?
I have that as well, including recorded during the bisect. Just posted an example above.
Comment From: mknyszek
Thanks @thepudds. I think it's safe to say you reproduced the issue.
I think I found the culprit to @felixge's original issue and the issue you're seeing here. Try out https://go.dev/cl/659956.
Comment From: gopherbot
Change https://go.dev/cl/659956 mentions this issue: runtime: prevent unnecessary zeroing of large !noscan objects
Comment From: thepudds
That CL hopefully addresses it! 🎉
Re-running nodechannel-large just now for go1.23, go1.24, and your fix:
                     RSS (MiB)
                  mean    stdev   count
go1.23.out:      683.8     94.5    44.0
go1.24.out:     1269.9     93.9    44.0
cl-659956.out:   706.8    102.6    44.0
The small remaining difference in the mean might just be noise. I'll re-run for longer.
Comment From: thepudds
One thing to be careful of is that faster allocation can naturally lead to more memory use, if you're explicitly trying to allocate as fast as possible in a benchmark.
FWIW, the heapbench utility isn't trying to allocate as fast as possible.
It lightly tries to look like a real application, with "jobs" coming in that include some CPU work (calculating hashes or decoding varints or similar) and some allocation work with a few dials to allow different scenarios, like a different baseline live heap, or slowly increasing live heap, different rate of garbage generation, etc. It has some variability built in (including because one of the early targets were some runtime scheduler-related glitches), but the variability averages out such that you can still look at averages across ~minutes and get reasonably consistent results. It's not super sophisticated, but it tries to keep putting the requested load on the allocator and GC while doing its work, or wait for more work. (Even if it's averaging ~2 cores of CPU usage as reported every 1 or 2 seconds, if you were to hypothetically zoom in on a small enough time scale, there are moments where it isn't doing anything, assuming you haven't set the dials to overload the machine its running on).
In any event, that's probably more than you wanted to know!
Regarding possibly having more floating garbage, if you look at the GC traces from the tests, does that seem to hint close to the same amount of floating garbage between the "good" and "bad" cases?
Comment From: mknyszek
@thepudds Thanks! That's all good to know. I intended to get this across in an earlier message but yes, your program definitely reproduces the issue and there aren't any subtleties around floating garbage happening. The heap goal was the same before and after.
Comment From: Gandem
👋 We tested https://go.dev/cl/659956 with the workload which had increased memory usage in 1.24, and we can confirm the CL addresses the issue! 🎉
Thank you 🙏 !
Comment From: felixge
Wow, fantastic work everybody! Thank you @thepudds for figuring out how to reproduce this issue. Thanks @mknyszek for finding the issue and fixing it. And thanks @Gandem for doing all the work on our end to analyze the situation and try out the various mitigation ideas as well as confirming that Michael's fix works for our prod issue. 🙇
Comment From: mknyszek
@gopherbot Please open a backport issue for Go 1.24.
This is a regression in 1.24 only. Unfortunately the fix uncovered some subtly wrong and scary things about asynchronous preemption. The changes include a fix, but given how subtle it is, we have decided to let it soak for a little bit before actually committing to the backport. Apologies to those waiting. There's a risk of introducing random crashes into programs not affected by this issue.
Comment From: gopherbot
Backport issue(s) opened: #73800 (for 1.24).
Remember to create the cherry-pick CL(s) as soon as the patch is submitted to master, according to https://go.dev/wiki/MinorReleases.
Comment From: mknyszek
I'll add that the fix to this bug is actually fairly small and simple and safe if you don't consider asynchronous preemption.
Comment From: gopherbot
Change https://go.dev/cl/682356 mentions this issue: [release-branch.go1.24] runtime: prevent unnecessary zeroing of large objects with pointers
Comment From: moogacs
Hey everyone,
I know this issue is closed, but I wanted to share my reproduction attempt and observations.
I've attempted to reproduce the memory leak issue described in this ticket using our internal load simulation environment. Here are my observations:
Test Setup
- Tested with Go 1.23 vs Go 1.24, linux/arm64
- Used internal load simulation to stress the system
- Monitored Kubernetes memory metrics
Key Metrics Observed
-
container_memory_working_set_bytes- Used by Kubernetes for OOM decisions -
RSS calculation:
container_memory_rss + container_memory_mapped_file
Results
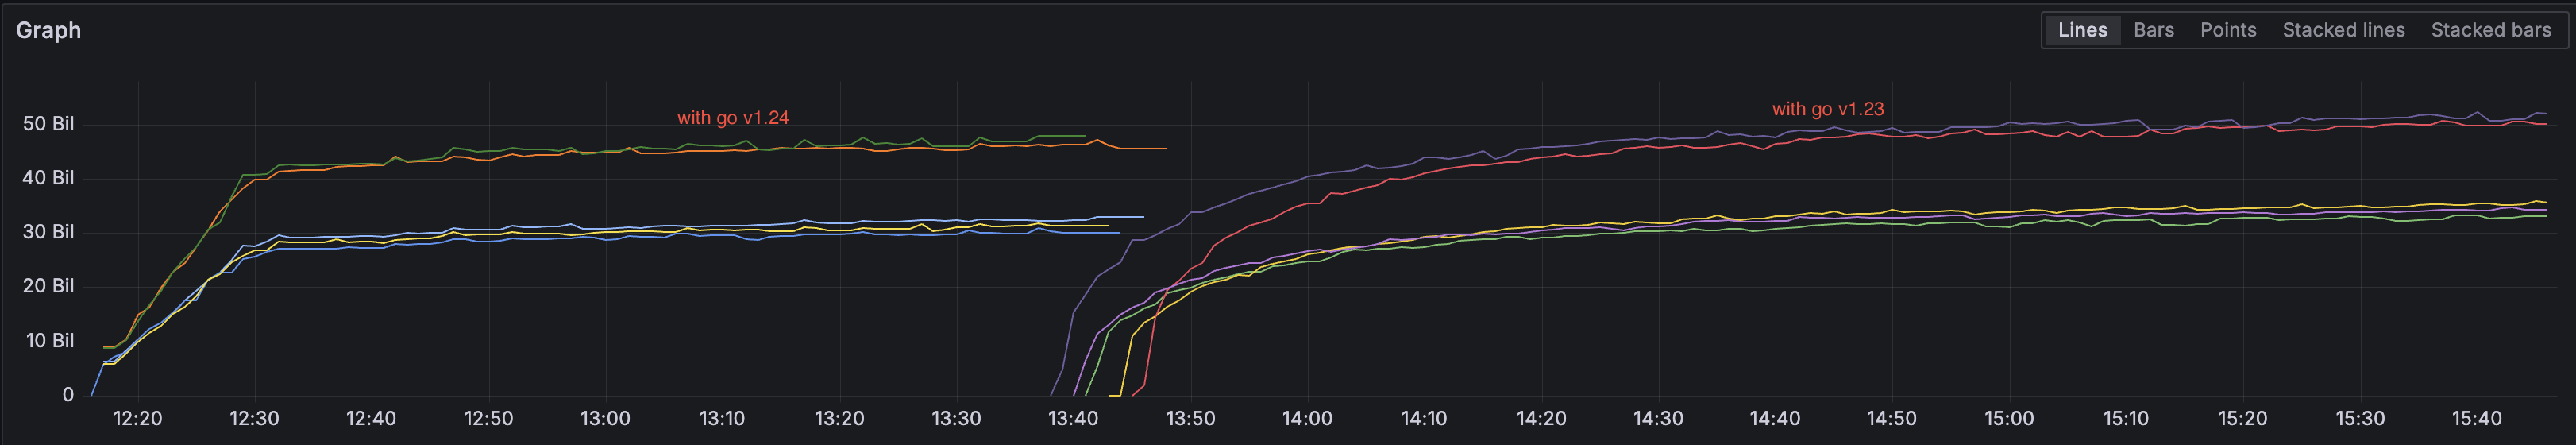
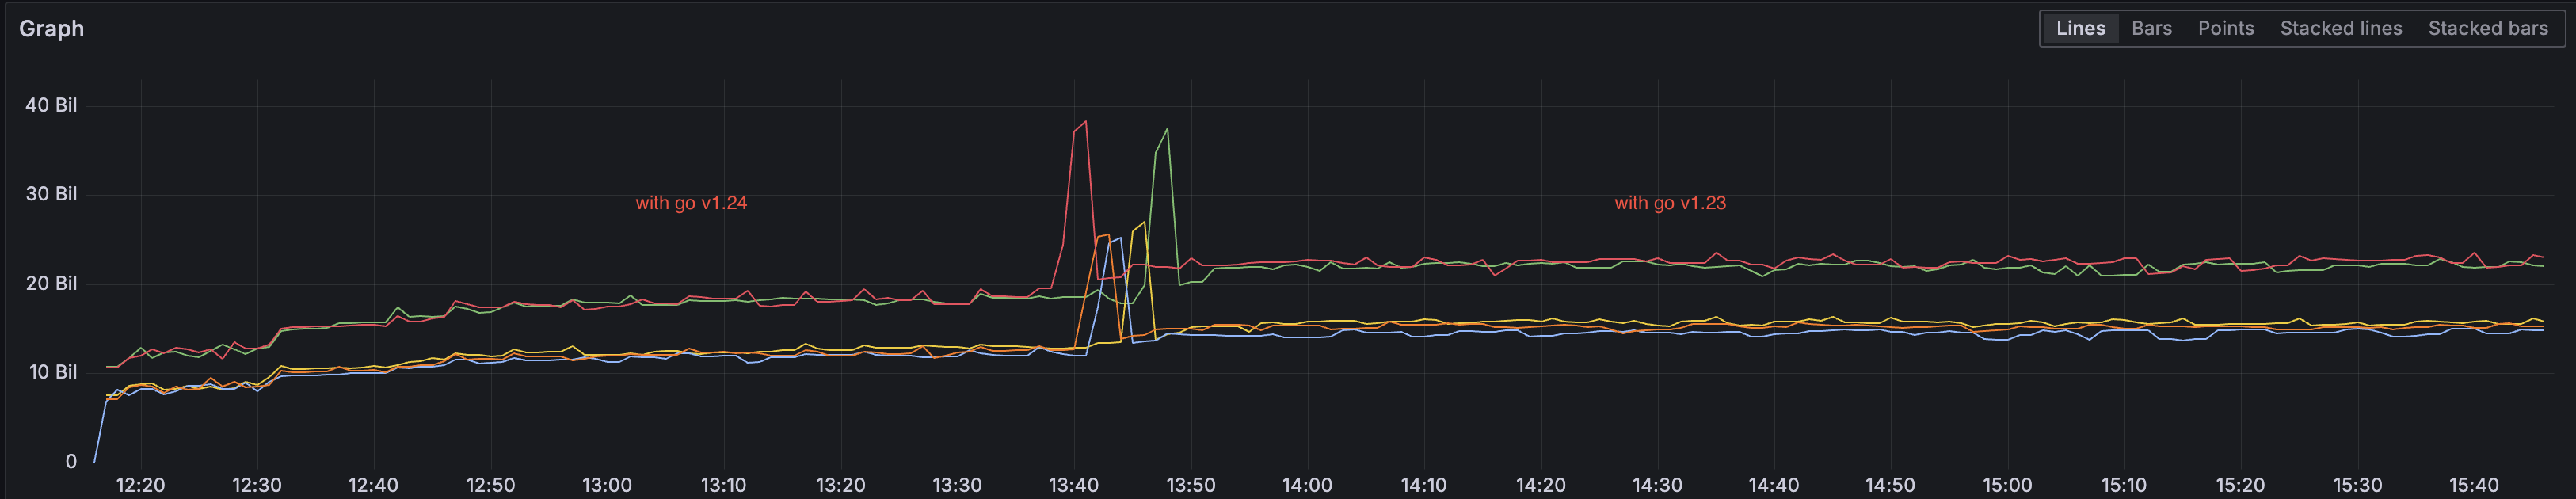
From the memory graphs, I observed that Go 1.23 shows higher memory usage compared to Go 1.24 (not the opposite as described in the issue).
The graphs show clear differences in memory behavior between the versions, but I want to ensure I'm capturing the right signals to properly identify the described leak.
Question: Am I missing something in my monitoring approach, Should I be looking at different memory metrics beyond
Comment From: Gandem
Hey @moogacs, if your service was impacted you would indeed see an increase in RSS and WSS (working set size).
This issue only impacts binaries doing allocations of large objects (>32KiB) containing pointers, meaning you wouldn't necessarily see it on all services if they're not doing such allocations. It's hard to say without looking at live heap profiles, and potentially runtine metrics, for the service you're load testing (though I believe this would be off-topic for this issue).
Comment From: moogacs
Hey @Gandem , thanks for the response. that's exactly what i was trying to investigate because had recent OOMs .
doing allocations of large objects (>32KiB)
i think this what made it not appearing in my tests.
Comment From: thepudds
Hi @moogacs, yes, for this particular problem, it needed to be over 32KiB in a single allocation (so beyond the allocator size classes, and what the allocator calls a "large object").
FWIW, my first "hello world" attempt at reproducing this did not reproduce it.
Based on the reported symptoms, though, I then took a couple of minutes to jot down some possible factors that I thought might influence the reported behavior based on my understanding of how Go's GC & allocator work.
I posted that list of possible factors to Gopher Slack at the time, but I'll post it here now as well in case useful in the future or mildly interesting to someone else:
Potentially interesting properties:

1. allocated size is <32 KiB vs. >32 KiB.
2. small enough for the tiny allocator vs. not.
3. allocated object contains pointers vs. not.
4. is a plain object vs. a slice.
5. is a typical user-defined struct, vs. some ~special-ish object like a channel
   or map (or something really special like a defer struct or profile memory or ...).
6. the memory is live across at least one GC, vs. alive longer,
   vs. usually dead by the time the GC looks (object lifetime).
7. has something else pointing to it vs. not.
8. whether it is living inside of a channel buffer.
9. is the memory touched/written by the user code vs. not.
Once I had that list, I was then able to relatively easily automate running through various combinations of almost all of those properties, which then caused the reproducer to pop out.
From that list, I think the most important factors for reproducing the problem ended up being: * factor 1 -- needed to be large objects. * factor 3 -- allocated objects needed to contain pointers. * factor 6 -- object lifetime needed to be long enough. * factor 9 -- most of the memory of the allocated objects should not written by the user code.
One other thing not written in that list but which I alluded to in the opening comment above is this behavior might depend on which distro is used or OS config, or possibly even HW specific, but I didn't really chase that.
Finally, looking at the list now, I'll add there's also a breakpoint in allocator behavior near 512 bytes, which I covered in my small automated test at the time, but I didn't include that in the quick list I had posted. (That list of possible factors turned out to be useful, but was not perfect 😅).