Hi everyone,
I'm working with Apache Superset 4.1.1, and I'm trying to build a Bar Chart that displays the number of students by gender (sexo), broken down by belt color (cinta_general), based on a dataset of student evaluations.
What I’m trying to achieve: Assign specific colors to each cinta_general category: "black" → #000000 "blue" → #0000FF "yellow" → #FFD700 "white" → #FFFFFF
Display these categories in a fixed custom order:
black, blue, yellow, white
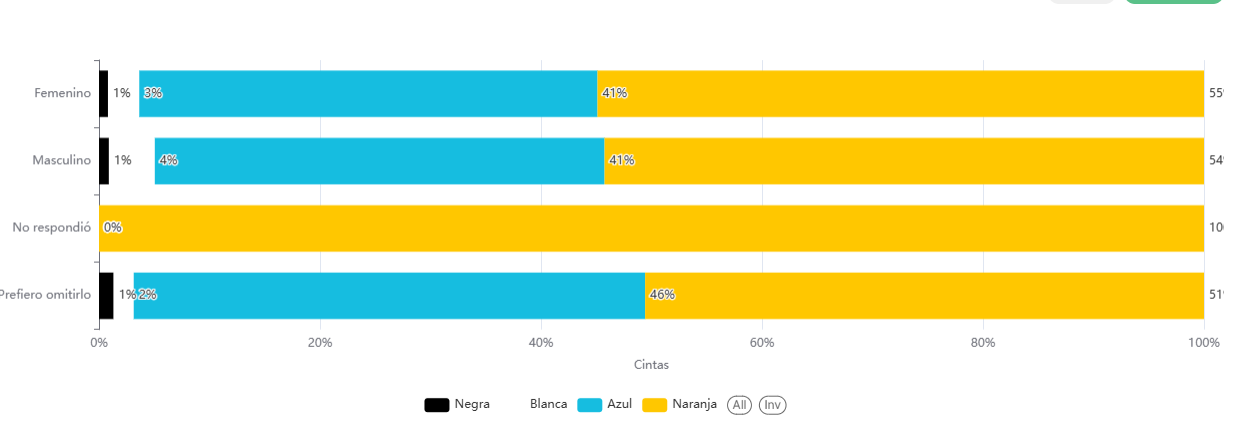
What I’ve done so far: I'm currently using the Bar Chart visualization (likely the ECharts version). In the Data panel: Dimensions: sexo Breakdowns: cinta_general Metrics: count(*) In the Customize panel, I see options like: Color Scheme, Stacked Bars, Sort Bars, Legend, Tooltip, Y Axis Format, etc. I do not see options for: Customize Series (to assign individual colors)
Other things I’ve tried: I created a field called orden_cinta in the SQL query (using CASE WHEN) to represent the desired sort order, but I can't use this to control the visual order in the chart. Switching chart types to Pie, Line, or Mixed doesn’t help. I also tried selecting what’s labeled as “Bar Chart (Legacy)”, but it appears to be the same modern ECharts chart, with the same fields and limitations — no Group by, no Columns, no Customize Series. Series Order (to define a custom order for the breakdown categories) My question: How can I assign custom colors by category and define a specific display order for those categories in a Bar Chart in Superset 4.1.1?
Do I need to use a specific chart type (like a real Legacy chart), adjust Superset feature flags or config files, or is there a workaround using the current ECharts bar chart?
Any help, examples, or links would be greatly appreciated! Thanks in advance
Comment From: dosubot[bot]
Directly setting custom colors and a fixed category order for ECharts Bar Charts in Superset 4.1.1 isn’t fully supported through the UI. The “Color Scheme” option lets you pick a palette, but not assign specific colors to specific values. Similarly, category order is controlled by sorting options (like alphabetical or by value), but not by a manual list.
If you have admin access and can edit config files, you can define a custom color scheme in your EXTRA_CATEGORICAL_COLOR_SCHEMES in superset/config.py to match your desired colors. However, this will only set the color sequence, not map colors to specific values. For per-value color mapping, Superset’s codebase uses the CategoricalColorNamespace.setColor() method, but this isn’t exposed in the UI—using it would require a code change or a custom plugin. More details on this approach are in the source code and config example.
For category order, the ECharts Bar Chart plugin supports sorting by value or name, but not by a custom list. Workarounds include manipulating your dataset or using a CASE statement to prefix values for sorting, but there’s no UI field for explicit order. The relevant logic is in the series sorting code.
If you need full control, consider the Plotly plugin for Superset, which lets you write Python code for custom charts—including explicit color and order mapping. See this discussion for details.
For more on customizing chart colors, check out the Customizing Chart Colors with Superset & Preset blog post.
Let me know if you want more details on any of these approaches!
To reply, just mention @dosu.
How did I do? Good | Irrelevant | Incorrect | Verbose | Hallucination | Report 🐛 | Other 

Comment From: msyavuz
Dosu's recommendation of creating a colorscheme and using that to set colors for the chart seems reasonable, as far as i know there is no way to directly set individual colors.