Go version
1.22.3
Output of go env in your module/workspace:
---

Not sure how to get it from env where docker image is built and where service is executed.
What did you do?
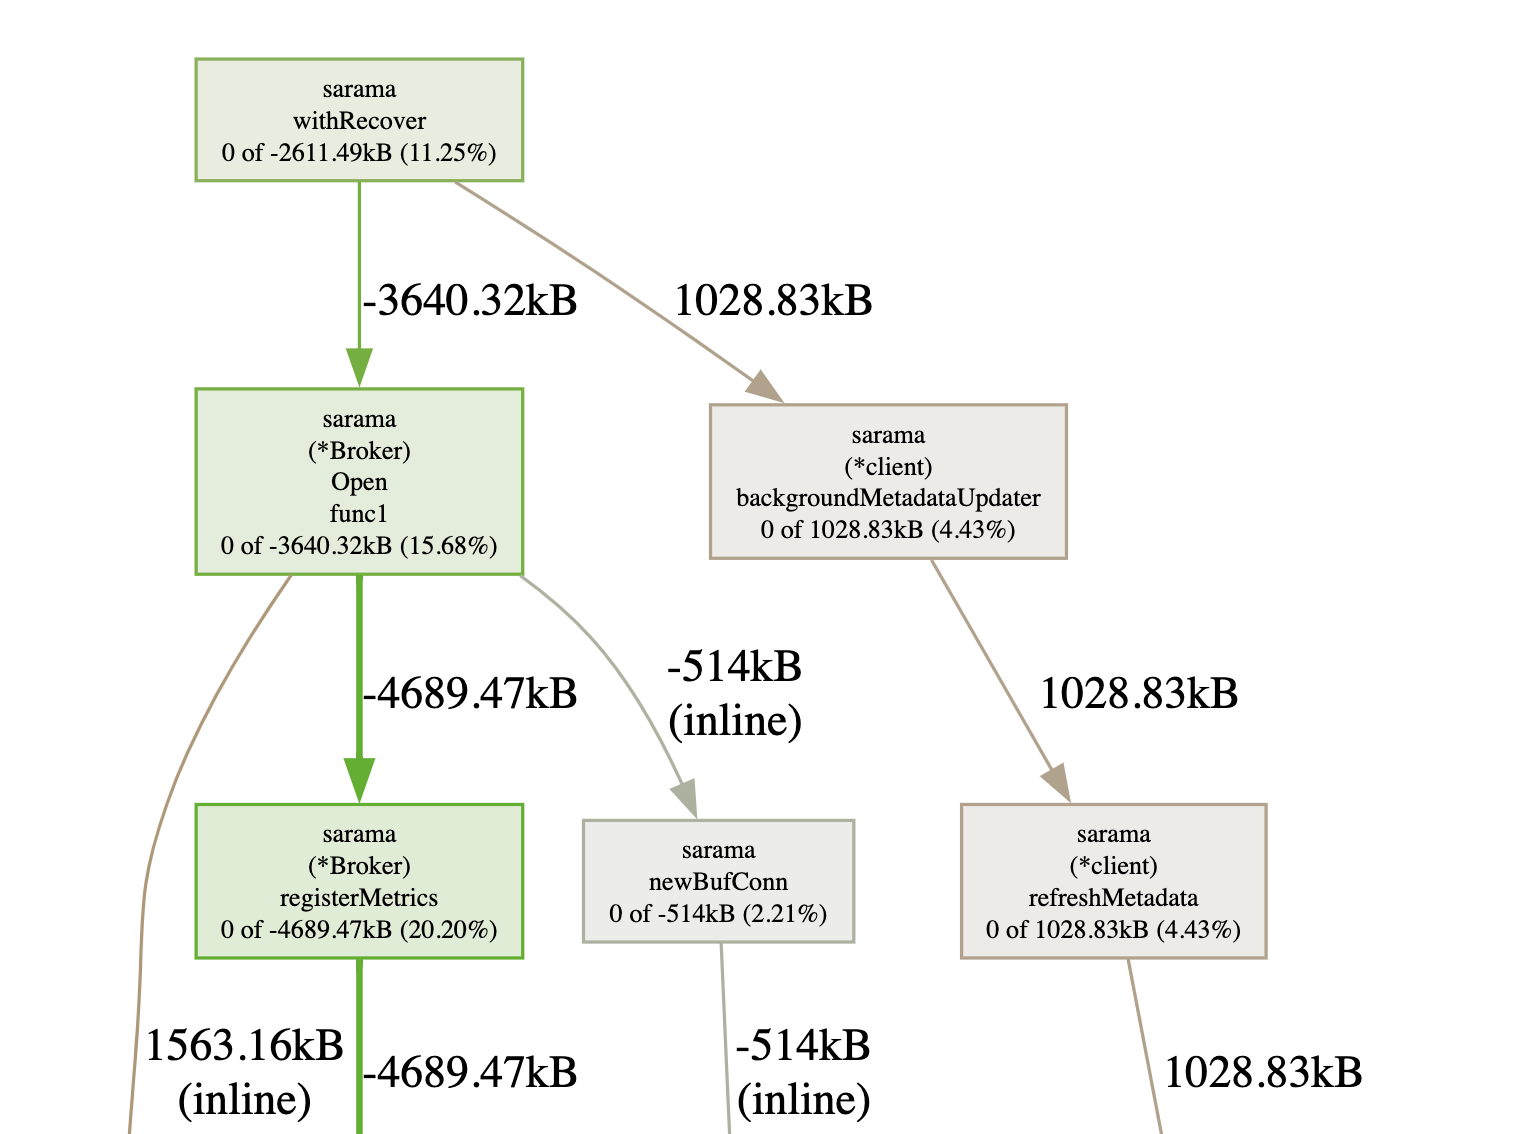
Took a heap profile from a running service (docker/k8s/linux) using instrumentation server opened on a dedicated port with built in pprof handlers. The service was built with 1.22.3. As far as I know all allocations tracking settings are at default values. Opened the profile using go tool pprof 1.22.3 on mac os. Got negatives all over, see screenshot.
Restarted service. Repeated experiment. Same result.
Built the service with 1.22.2. No negatives in the report.
In all experiments used 1.22.3 to view profiles.
Not sure I can provide more details, hope that it's easy to track regression in allocations tracking code.
What did you see happen?
allocation report contained a lot of negative numbers
What did you expect to see?
report without negative "memory in use" numbers
Comment From: seankhliao
is it possible for you to show the profile?
Comment From: ruz
I've tried to reproduce with a simple script that leaks goroutines and memory, but failed.
Hope somebody realize problem without me spending more time. If not then I will try to get around to it and cook some reproducible example. Not sure that I can publish profile as it is from a closed source project.
Comment From: nsrip-dd
Are you using the seconds query parameter? Something like /debug/pprof/heap?seconds=30? If so, it's possible to see negative values for the live heap sample values (inuse_space and inuse_objects). The seconds parameter gives the difference of two profiles collected that many seconds apart. If some memory was freed between when the profiles were collected, the values associated with some call stacks can be negative. Going off the example you shared, if there were open Broker connections when the first profile was collected, and they closed and their associated resources were freed by the time the second one was collected, it would be reasonable to see negative values for inuse_space and inuse_objects since there are fewer live allocations associated with the connections. As for the difference between 1.22.2 and 1.22.3, that could just be a coincidence. Perhaps memory usage happened to be increasing while you collected a profile running 1.22.2.
Comment From: gopherbot
Timed out in state WaitingForInfo. Closing.
(I am just a bot, though. Please speak up if this is a mistake or you have the requested information.)