Bug description
The stacking functionality for bar charts was introduced recently, but it broke the option to show bar values.
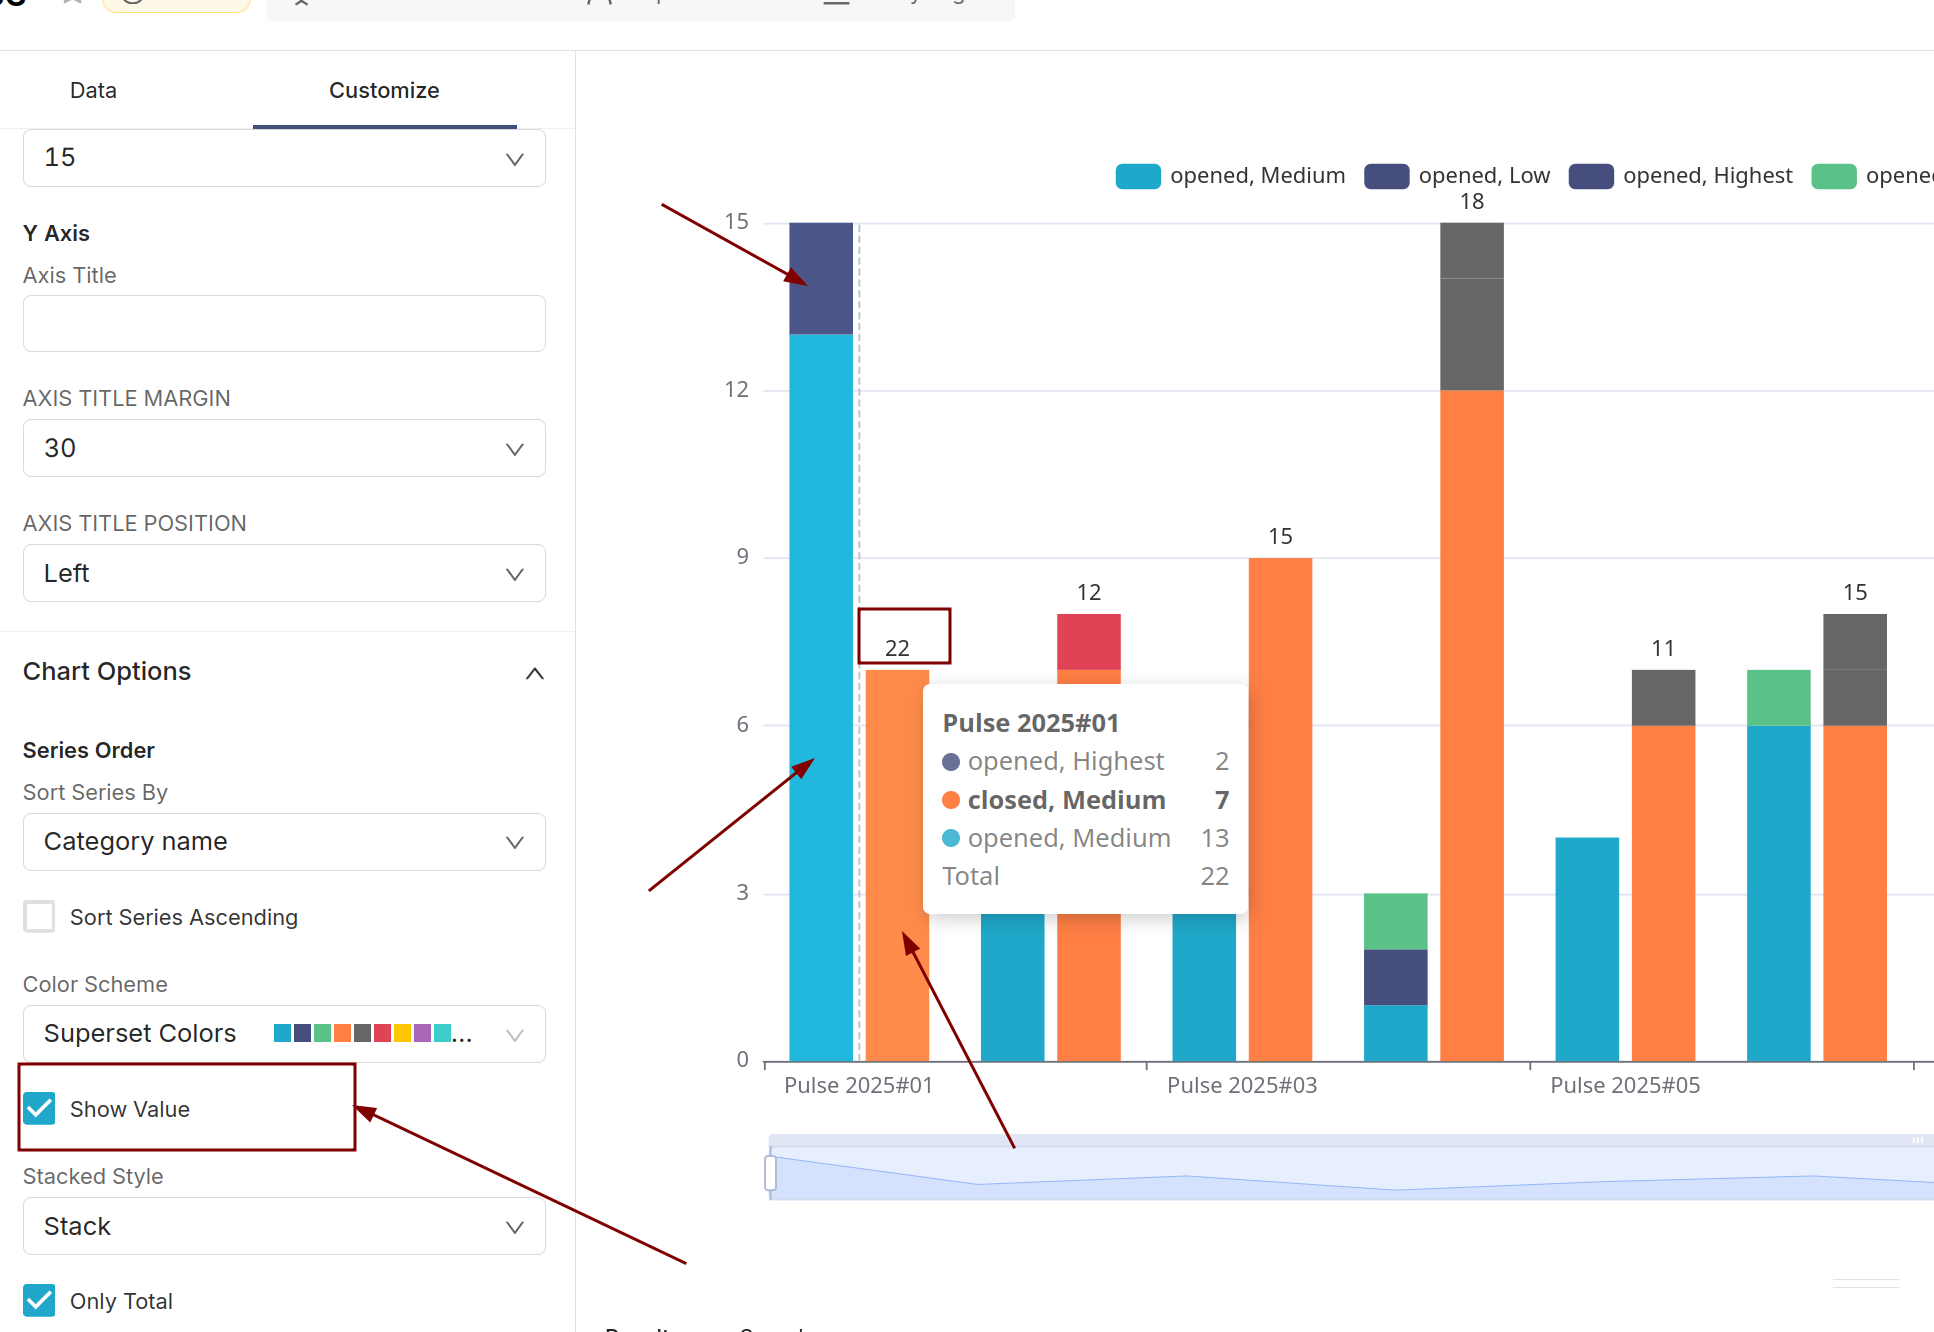
When selecting Only Total, then Instead of displaying the number for each bar, it now shows a single value for the entire cluster. In the example below, it should show two separate numbers, not just one.
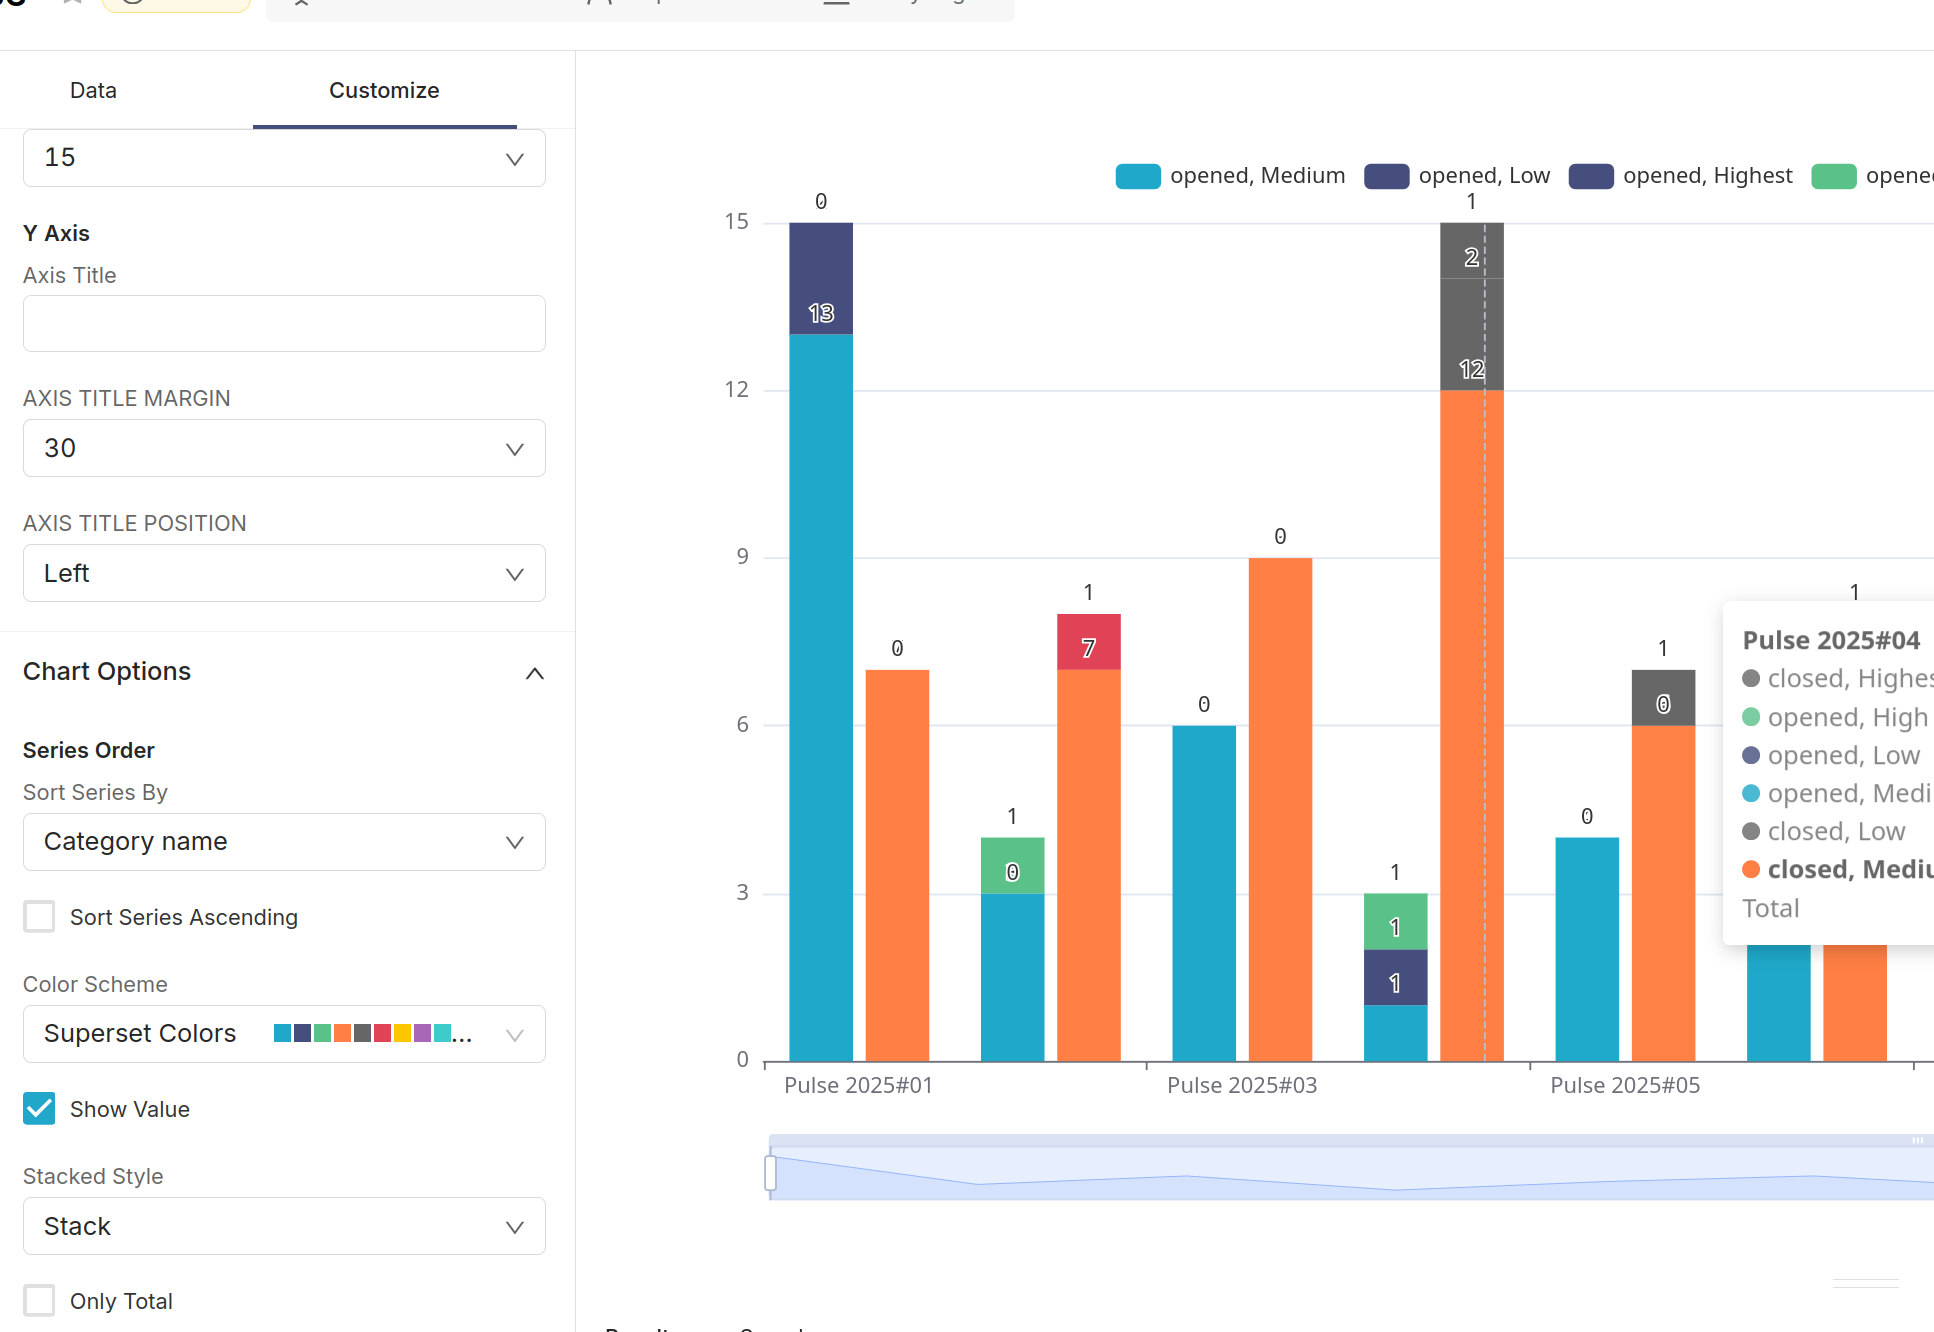
When Only Total is unselected, it is completely broken
Superset version
master / latest-dev
Python version
3.9
Node version
16
Browser
Chrome
Additional context
No response
Checklist
- [x] I have searched Superset docs and Slack and didn't find a solution to my problem.
- [x] I have searched the GitHub issue tracker and didn't find a similar bug report.
- [x] I have checked Superset's logs for errors and if I found a relevant Python stacktrace, I included it here as text in the "additional context" section.
Comment From: dosubot[bot]
This issue is likely related to recent changes in the stacking and value display logic for bar charts. The "Show Value" and "Only Total" options are controlled by logic in the frontend code, specifically in the functions that determine which bar segments display values and how those values are rendered. The "Only Total" option should show the total for each bar, not just a single value for the entire cluster, and when unselected, all segment values should appear.
Recent updates—especially the introduction and modification of the onlyTotal option—may have introduced a bug in how these values are calculated and displayed. The relevant logic lives in the extractShowValueIndexes and transformSeries functions, which determine where and how values are shown on stacked bars. Any regression here could cause the symptoms you're seeing, such as only one value per cluster or missing values entirely. You can review the technical details and recent changes in this pull request and see related discussion in this issue.
If you want to debug or patch this, focus on the logic in extractShowValueIndexes and the label formatter in transformSeries in the ECharts plugin code. No merged fix or workaround for this specific display bug was found as of now.
To reply, just mention @dosu.
How did I do? Good | Irrelevant | Incorrect | Verbose | Hallucination | Report 🐛 | Other 

Comment From: rusackas
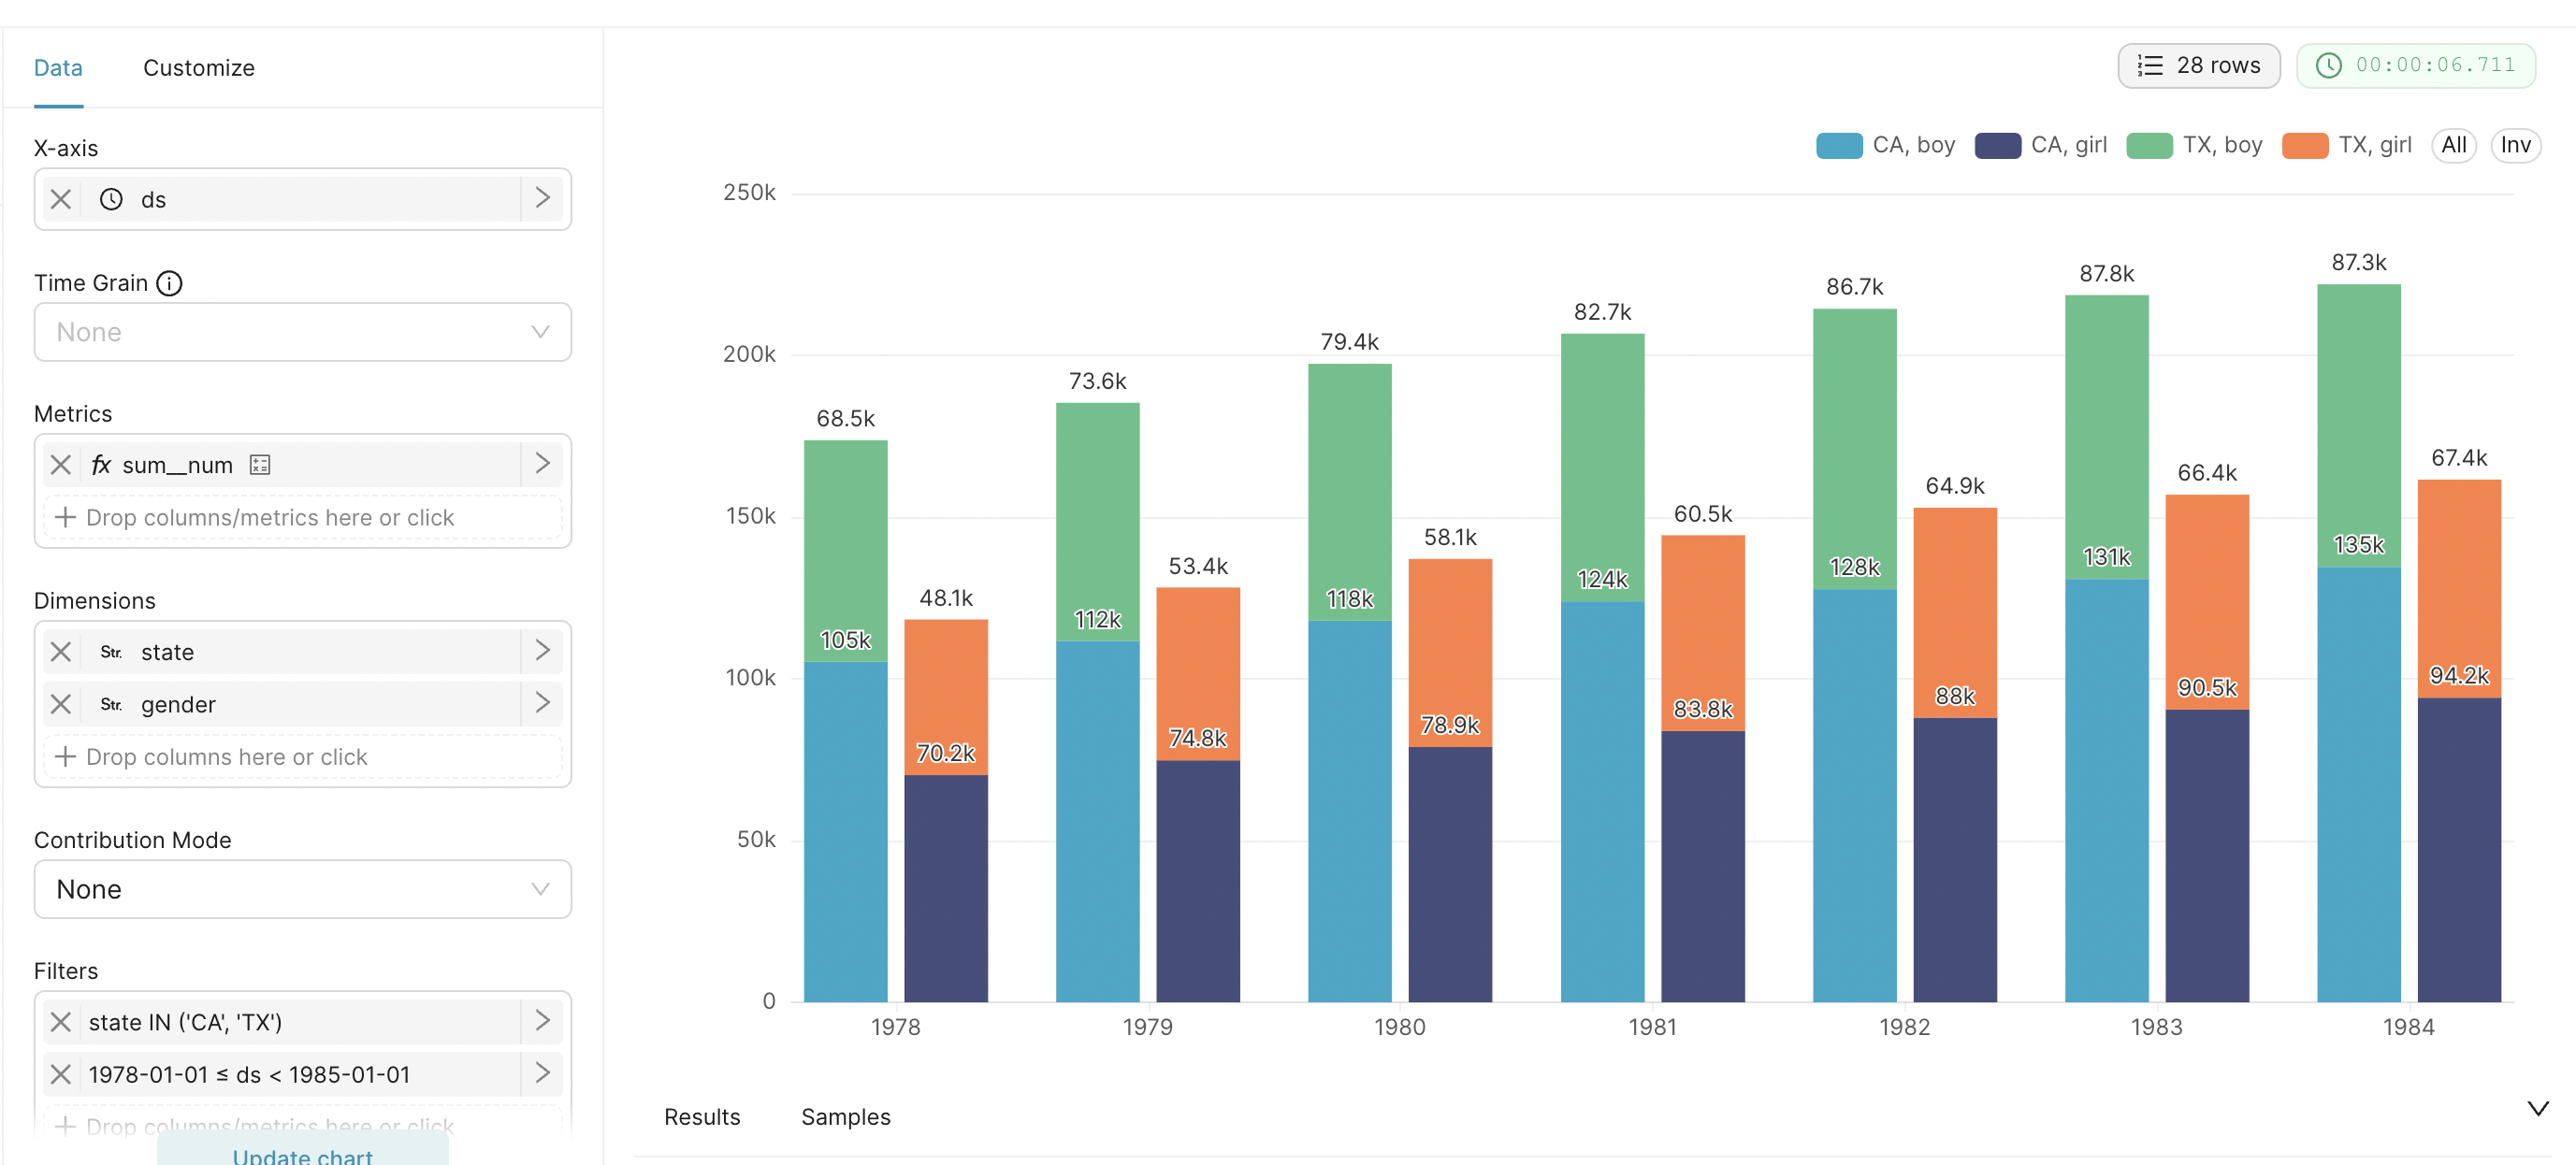
I created a test chart on an ephemeral environment here. It may disappear at any time, but I see that when "Only Total" is NOT selected, it looks OK to me:
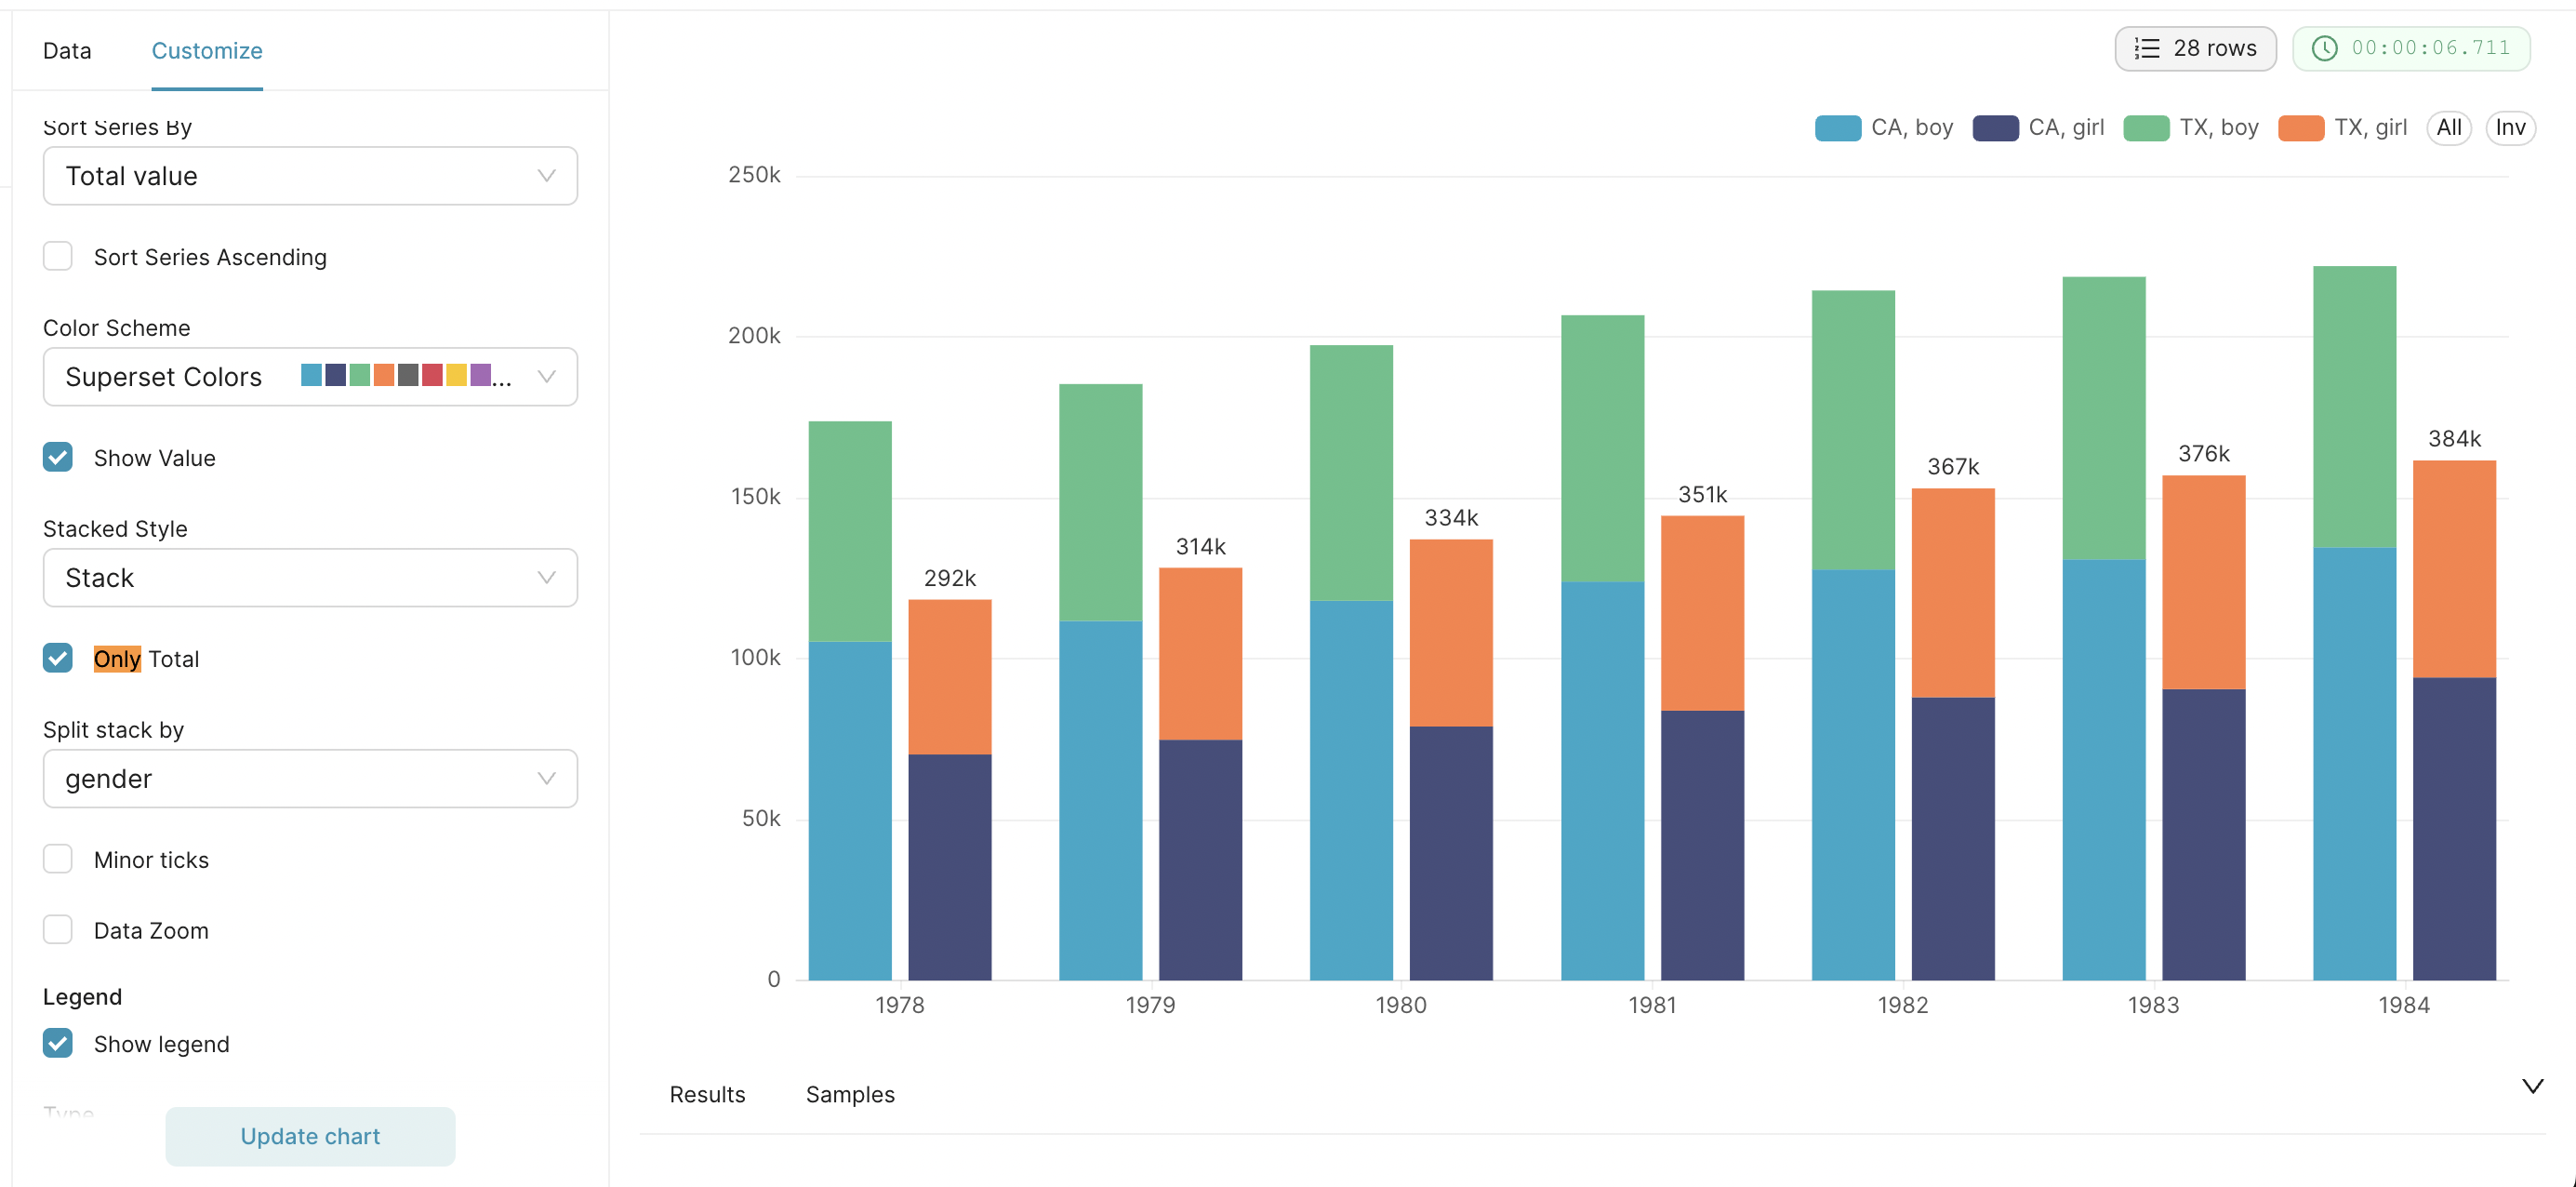
When I select "Only Total" I do see the issue that the total (for both stacks) is shown on the last stack, rather than being split for each stack.
CC @jpchev who worked on the feature, in case he knows a quick solution for this.
Comment From: rusackas
Here's the PR in case it helps.