Bug description
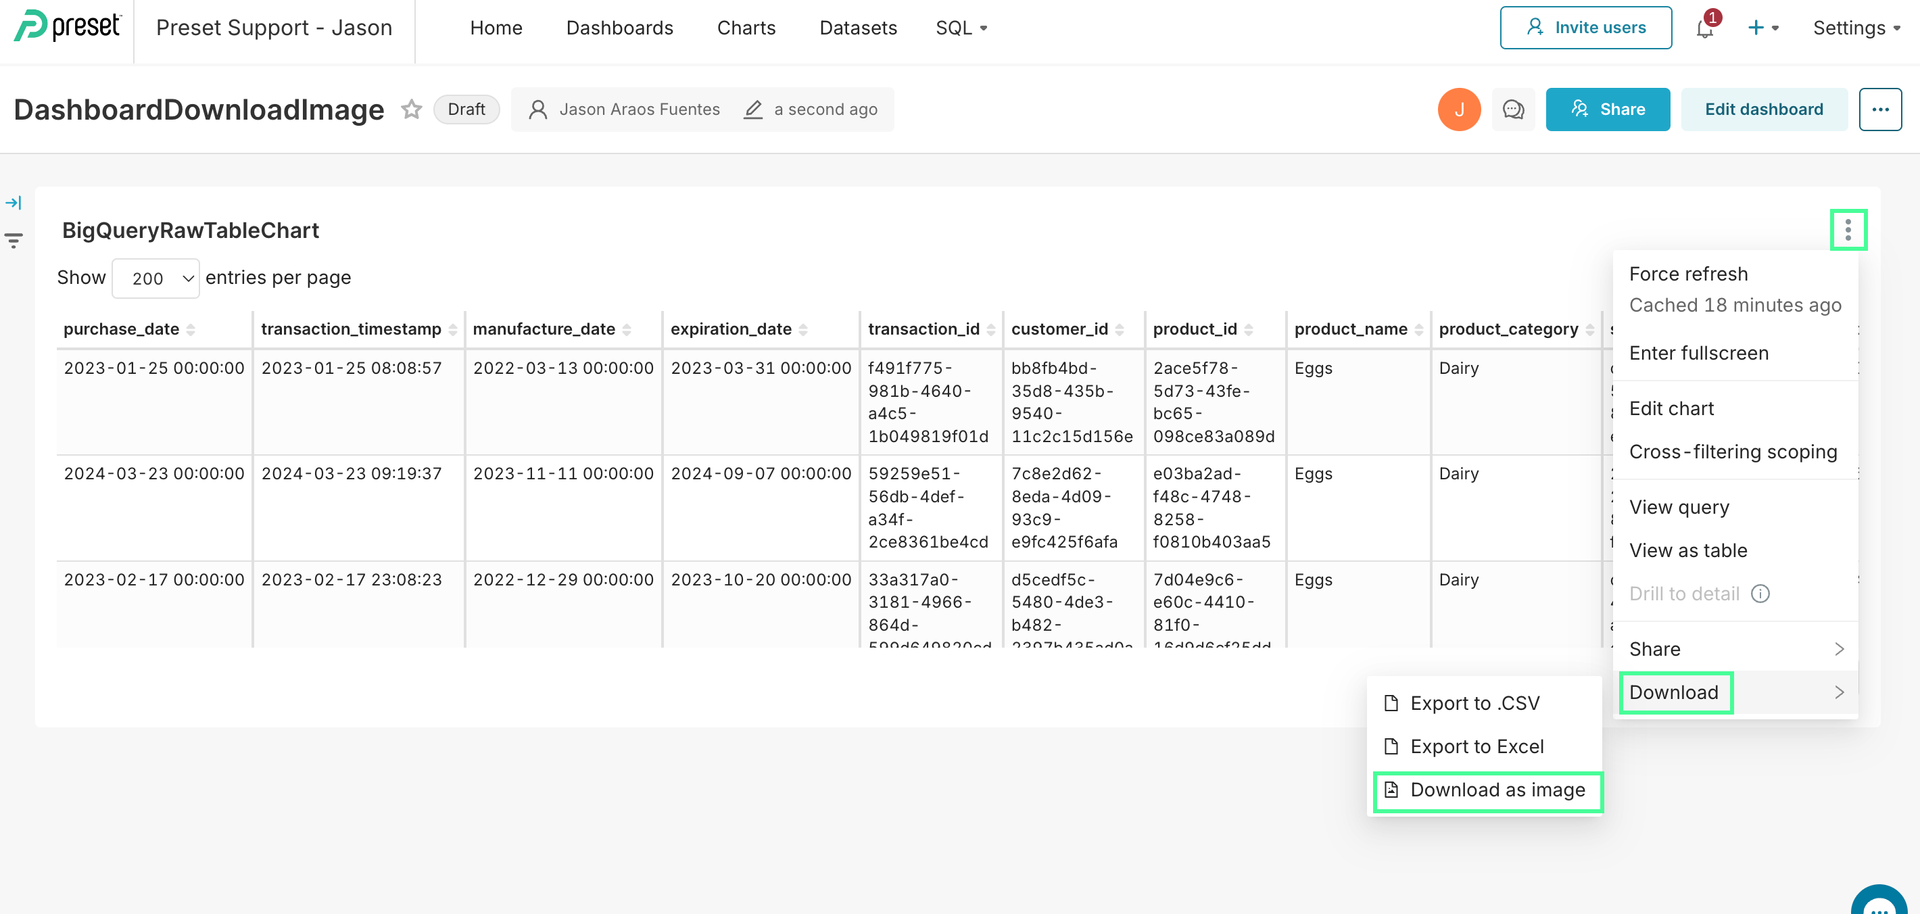
When you have a table chart or a handlebar chart (This one simulating the table UI) inside a dashboard, if you use the Download as Image option of that chart, the downloaded image only considers the visual section shown in the dashboard and not the full chart.
- Create a regular table chart.
- Add to a dashboard, so that it doesn’t show up entirely (it shows the scroll bar).
- Download the table chart from the dashboard as an image.
Expected results
The downloaded image considers all the information that the table chart has
Actual results
The downloaded image only considers the information shown in the dashboard and not the full table
Screenshots/recordings
No response
Superset version
master / latest-dev
Python version
3.11
Node version
18 or greater
Browser
Chrome
Additional context
No response
Checklist
- [x] I have searched Superset docs and Slack and didn't find a solution to my problem.
- [x] I have searched the GitHub issue tracker and didn't find a similar bug report.
- [x] I have checked Superset's logs for errors and if I found a relevant Python stacktrace, I included it here as text in the "additional context" section.
Comment From: dosubot[bot]
This is a known limitation: when you use "Download as Image" on a table or handlebar chart in a dashboard, only the visible portion is exported. This happens because Superset uses the dom-to-image-more library, which captures only what's currently rendered in the DOM—so if the chart/table is scrollable, only the visible section is included in the image export. There is no code in the current implementation to expand the table or render all rows before capturing the image, and no workarounds or enhancements for this have been documented or proposed in recent issues or pull requests [source].
This limitation is specific to table and handlebar charts. Other chart types (like bar, line, or pie charts) that use ECharts can export the full chart regardless of what is visible, because ECharts provides its own export API that isn't limited by the DOM viewport.
Currently, the only alternatives are to export the data as CSV or use a browser extension to capture the full scrollable area, but these are not integrated solutions. If you need the full table as an image, you would need a feature enhancement that temporarily expands the table before capture or stitches together multiple images.
To reply, just mention @dosu.
How did I do? Good | Irrelevant | Incorrect | Verbose | Hallucination | Report 🐛 | Other 

Comment From: geido
🎉 Preset Bounty Available: $150 USD 🎉
To claim this bounty, please carefully follow the steps below.
📋 Steps to Participate
-
Review Guidelines:
Read through the Preset Bounty Program Contribution Guide for complete details on bounty requirements. -
Show Your Interest:
Complete the Preset Bounty Program Survey and comment this issue to express your interest. -
Join the Slack Channel:
After completing the survey, you’ll receive an invitation to the dedicated Apache Superset Slack channel. -
Get Assigned:
To officially start, ensure a Bounty Program Manager has assigned you to this issue. -
Submit Your Solution:
When ready, submit your solution with theFixes #{issue_number}notation in your Pull Request description. -
Claim Your Bounty:
Sign up at GitPay.me and submit your solution via: https://gitpay.me/#/task/1213
💡 Additional Notes
- Only developers assigned by a Bounty Program Manager should start working on this issue to win the bounty.
- Be sure to follow the guide closely to avoid any delays in payment. Please, allow a few days after your PR has been merged for the bounty to be released.
Good luck, and happy coding! 🎉
Comment From: Sameerali0
@msyavuz I would love to work on this.
Comment From: Sameerali0
@dosu I have tried to solve this but it seems that the only way is to make the scrollable content visible on the dom and then only will we be able to capture them can you suggest something and also can i use echart api instead of the dom-to-image-more.
Comment From: dosubot[bot]
You can't use the ECharts API for table or handlebar charts in Superset because these charts are rendered as HTML tables (via React) and not as ECharts visualizations. The ECharts export API only works for ECharts-based charts like bar, line, or pie charts.
For table/handlebar charts, Superset uses dom-to-image-more, which captures only what's currently rendered in the DOM. Since the DataTable component paginates and virtualizes rows, only the visible portion is exported as an image—there's no built-in logic to expand or render all rows before export. To capture the full table, you'd need to programmatically disable pagination and virtualization (e.g., set page size to all rows), wait for the DOM to update, trigger the image export, and then restore the original state. This approach can cause major performance issues for large tables and isn't currently implemented in Superset. See the relevant code for DataTable and downloadAsImage for more details:
downloadAsImage.ts
DataTable.tsx
Any solution will need to balance user experience and performance, especially for large datasets. There are no alternative export methods or workarounds documented in the repo.
To reply, just mention @dosu.
How did I do? Good | Irrelevant | Incorrect | Verbose | Hallucination | Report 🐛 | Other
Comment From: msyavuz
@Sameerali0 dom-to-image has a height setting you might be able to use to render the whole chart before downloading.
Comment From: fardin-developer
I understood the issue and would love to work on this.