Please make sure you are familiar with the SIP process documented here. The SIP will be numbered by a committer upon acceptance.
[SIP] Proposal for Customizable Drill-to-Detail Chart
Motivation
Currently, the Drill-to-Detail chart in Superset displays the full dataset when a drilldown is performed. In my experience users have identified three key pain points while using superset:
-
Selective Data Display: As superset users, we use a single dataset for multiple charts, currently the entire dataset is displayed in the drilldown, we would like the ability to filter and display only the columns that are most relevant to each chart.
-
Custom Labeling: Custom labels can improve readability and contextual understanding, a feature that already exists in both the table chart and the per dataset but is missing here.
-
CSV Export: End users often need to export the exact view presented in the drilldown to CSV for further analysis or reporting.
Enhancing the drill-to-detail functionality to mirror the customization available in the table chart will create a more consistent and user-friendly experience.
Proposed Change
I would be glad for sugestions here.
- Leverage the existing custom labels defined at the dataset level for display in the Drill-to-Detail view.
- Introduce a configuration option within the chart control panel allowing users to specify which dataset columns should appear in the Drill-to-Detail view.
- Incorporate an optional export button within the Drill-to-Detail modal, enabling users to download the currently displayed data as a CSV file.
These configurations could be integrated into a new "Drilldown Options" customize section within the chart control panel.
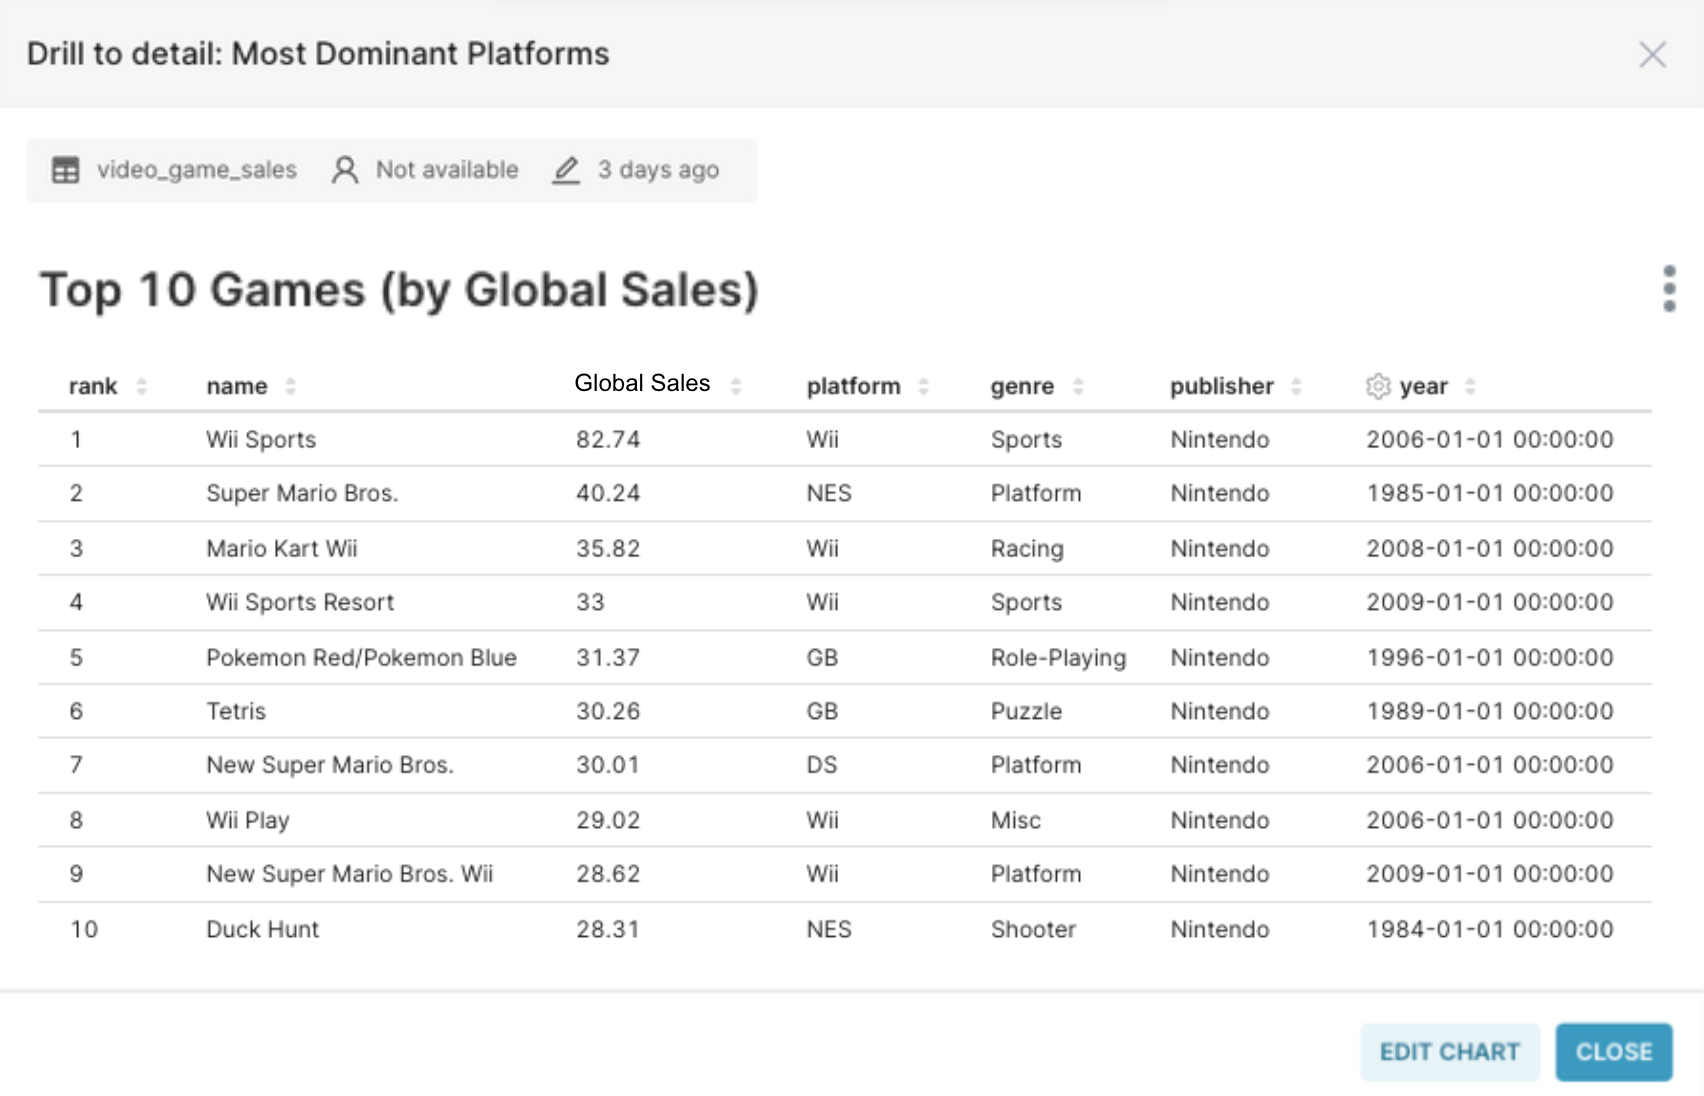
(Mockup of the desired Drill-to-Detail interface)
New or Changed Public Interfaces
As far as I know, no change is needed.
New dependencies
As these enhancements build upon existing functionality, no new dependencies are required.
Migration Plan and Compatibility
Maintain backward compatibility with existing charts by ensuring that if the customization options are not configured, the drilldown behavior remains unchanged.
Rejected Alternatives
An alternative considered was the ability to embed any chart within the Drill-to-Detail view. However, this approach was deemed overly complex due to the unnecessary complexity related to embeeding charts.
Comment From: rusackas
Sounds interesting! Might be useful to see a mockup of the control panel and/or dataset editor mods that would be relevant.
CC @kasiazjc since I know she's had some thoughts about this as well.
Comment From: mistercrunch
SGTM, I believe there are designs somewhere laying around to improve the "Dataset Editor" modal that somewhat relates to this. Some related ideas:
- allow column reordering in the Columns tab of the Dataset Editor, impacting the details view
- add a new checkbox [show in drill-to-details] in the in the Columns tab of the Dataset Editor, (checked by default) allowing people to hide columns from the drill-to-details view
- improve Explore to align the current "Samples" tab in the south-east panel to align / reuse the drill-to-details view. Add similar interaction in explore to "Drill-to-Details", could pop the same modal and/or impact the panel
@kasiazjc ^^^
Comment From: rusackas
Looks like this one is ready for more attention. Holler if you need help opening a [DISCUSS] thread on the mailing list. @kasiazjc we'd still love your opinion(s) here.
Comment From: EMachad0
@rusackas I would appreciate help with opening the thread on the mailing list.
Comment From: kasiazjc
@EMachad0 thanks for the SIP! The changes make sense and are also something that we were thinking about implementing, but never got round to it.
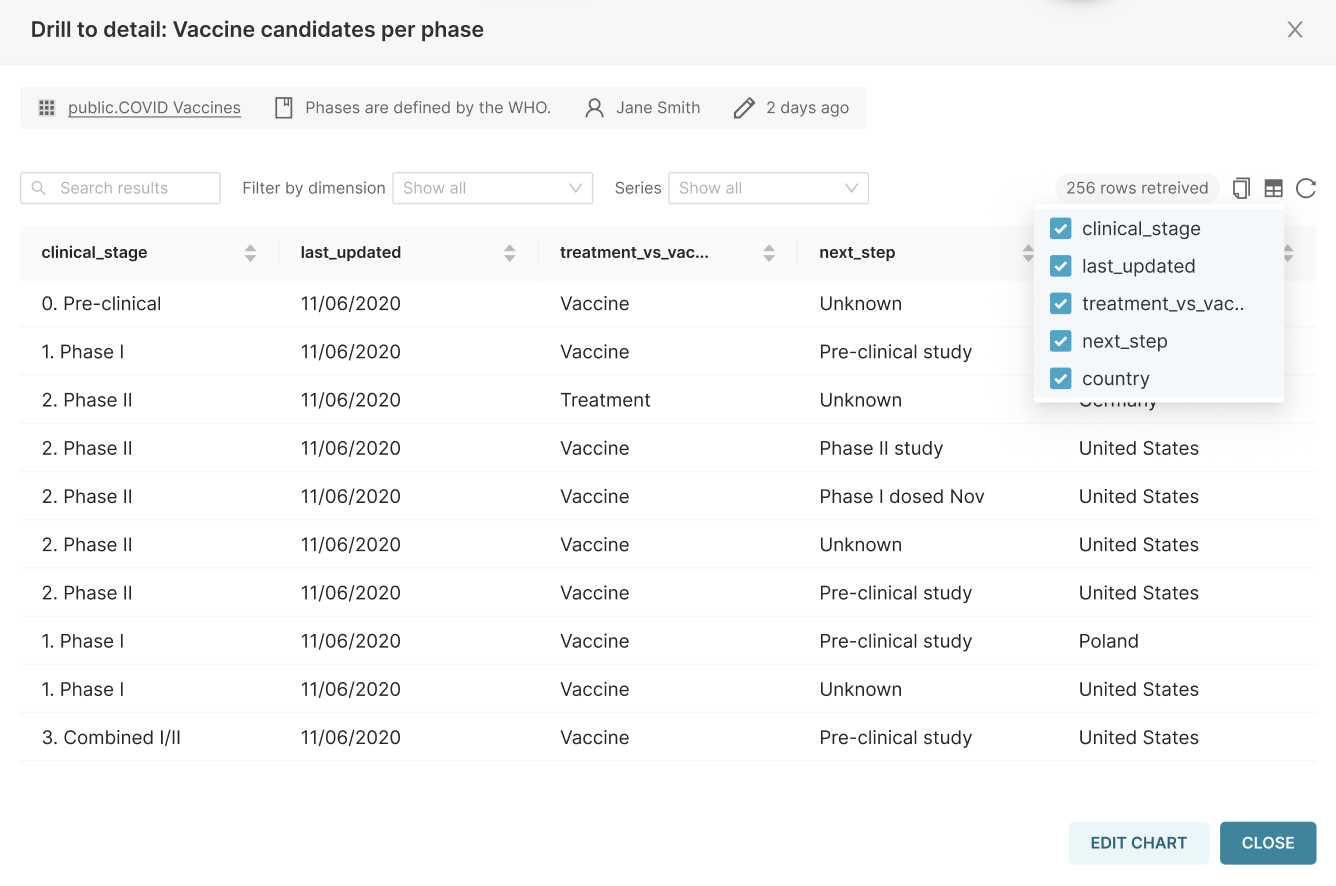
In terms of Selective Data Display, we were thinking about this kind of dropdown. This would be in the drill to detail modal and the dropdown would have dynamic search at the top if there is more than 15 values. I know that we were discussing if it should be on the dataset or chart/user level with @mistercrunch, but it's tricky as the view might be dependent on the chart. Would love your opinions here though.
Bonus: column ordering I think we have in table charts too, and the order of the columns is saved in explore. We could also introduce this in the drill to detail table
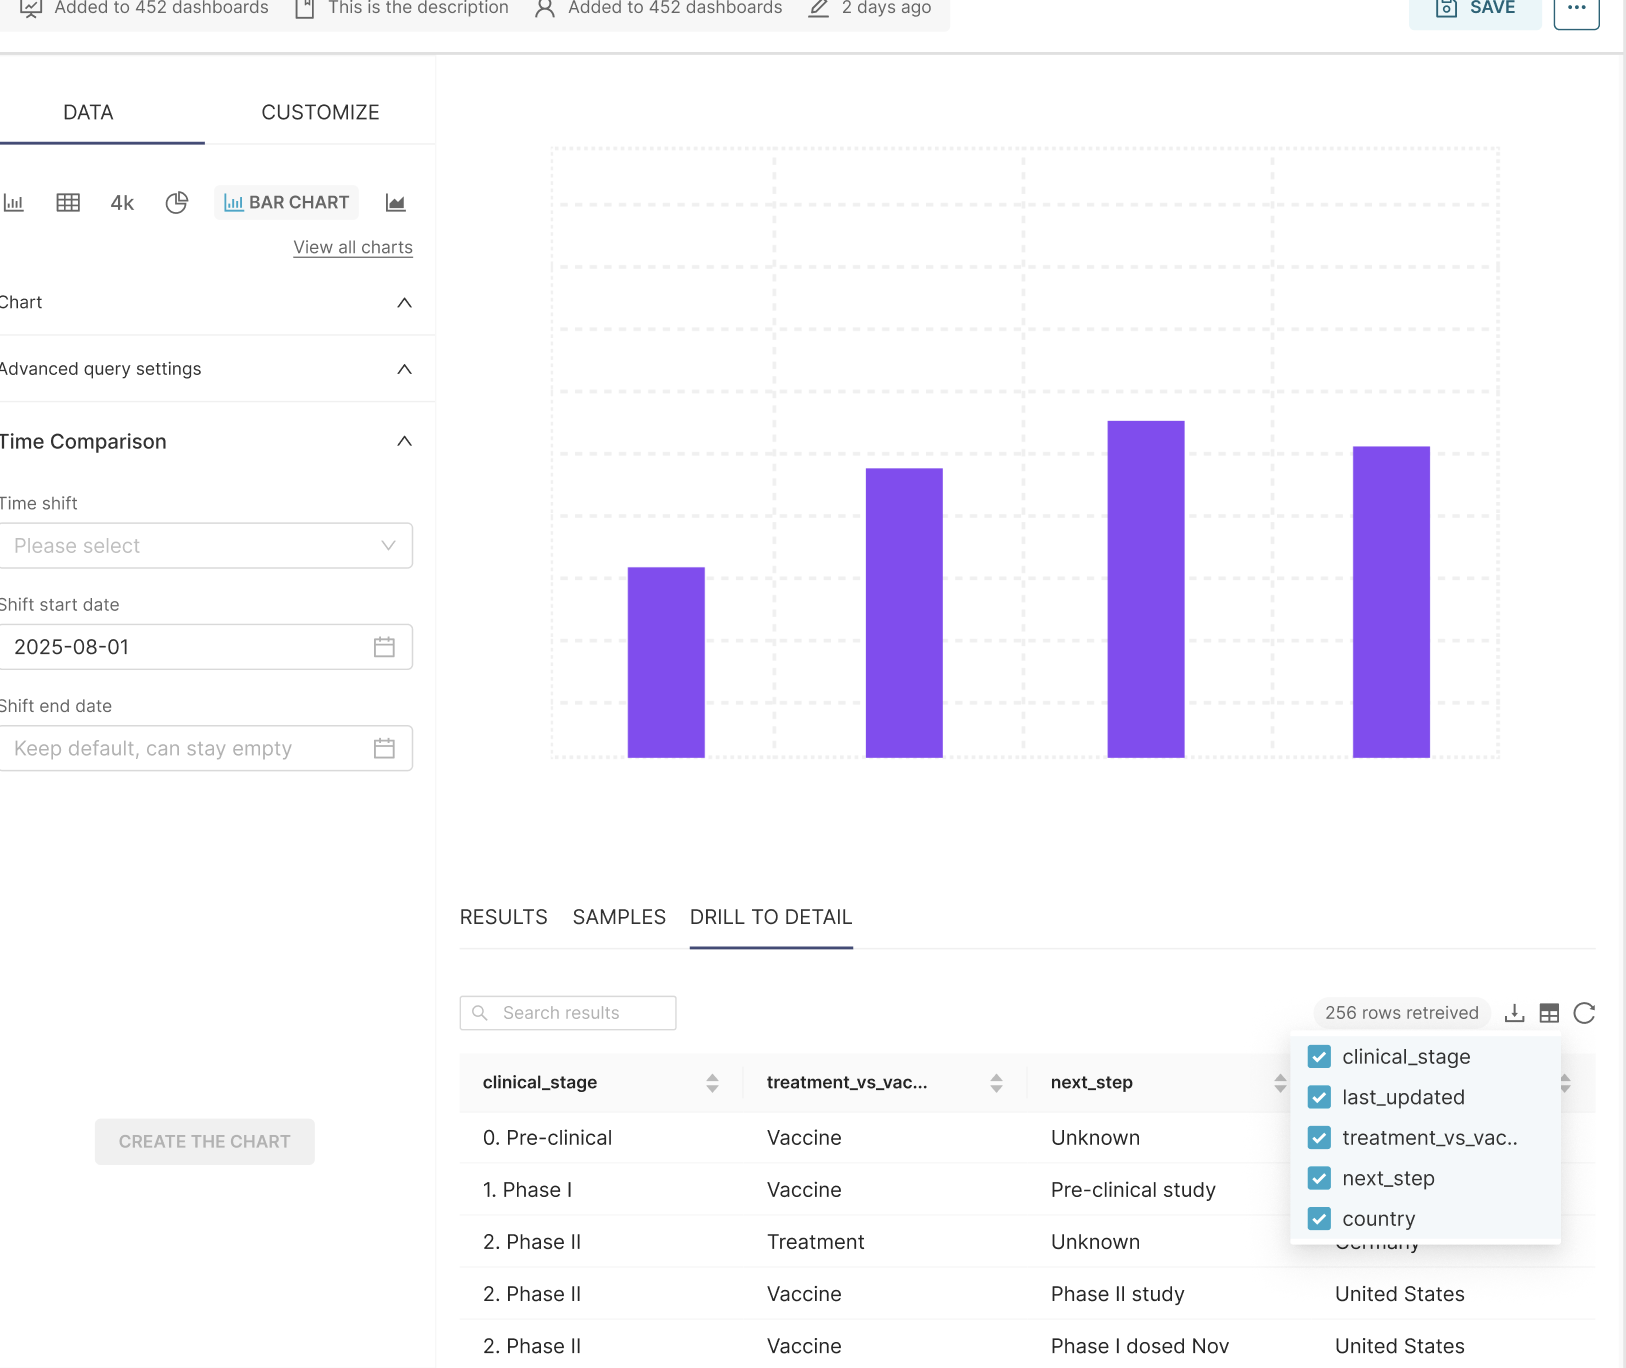
In general, I am thinking that instead of adding new controls, maybe we could add a new tab to "results&samples" in chart editing mode, which would show the drill to detail table and allow users to manipulate the table as they wish, so: - showing/hiding columns - renaming (I think the table component may allow that, need to check) - reordering of columns, which would be saved when saving the chart - add export/copy in this tab too (would be also shown in the modal)
@EMachad0 @mistercrunch @rusackas let me know your thoughts (and keep in mind that the mocks are currently just a quick ones to show what I am thinking)
Comment From: mistercrunch
Seems ag-grid-community that we started using offers a lot of the stuff we need here (DnD reordering, filters, show/hide columns, paging, ...). Also generally would love to bring the two panels (drill-to-details-modal and "Samples"-in-explore) together, along with the drill-to-details action to affect the panel in explore.
Comment From: EMachad0
@kasiazjc This looks fantastic — it checks all the boxes of what I was hoping for and actually improves the implementation quite a bit! I love the direction you're taking, especially with integrating the drill to detail table as a dedicated tab near results and samples. How can I proceed to help move this forward?
Comment From: mistercrunch
Yes!
I know that we were discussing if it should be on the dataset or chart/user level with @mistercrunch, but it's tricky as the view might be dependent on the chart.
I think it should be a dataset-level setting to keep things simple. The dataset owners decide which columns show and in what order. Maybe users can hide/unhide things, and reorder columns, but that doesn't get persisted.
Say if there's a PII column like email, the dataset owner can decide to hide it so it's not available in the "drill to details" on the dashboard.
I'd make it a requirement to use the same settings to apply both in the current "Samples" tab in Explore and in the drill-to-details in dashboard for consistency. Talking about consistency, we should rename "Samples" to "Details" in Explore, so it's clear that all this is aligned naming-wise
Comment From: rusackas
This needs to be put up for a DISCUSS thread on the dev@ mailing list if you want to carry it forward.
Comment From: EMachad0
@rusackas I created the Discuss thread on the mailing list (archive link)
Comment From: EMachad0
@rusackas can you give me an overview of the process and what are the next steps?
Comment From: rusackas
The next step is to put this up for a vote. I'll do so now.
Comment From: sfirke
This would be a really nice improvement! Two things: 1) I like where the conversation went, if I understand correctly we are not talking about a new chart anymore but instead adding a new controls pane to the bottom of every chart design screen. I think that's the right call - but then let's edit the name of this SIP to reflect that. 2) Re: whether the settings should be dataset-level or chart-level, I wonder if it should be chart-level for these reasons:
(a) because the controls would be added to each chart in the current design, it would be deceptive if you made changes for one chart and it also affected all other charts using the same dataset (b) to address one of the three original pain points raised by @EMachad0:
Selective Data Display: As superset users, we use a single dataset for multiple charts, currently the entire dataset is displayed in the drilldown, we would like the ability to filter and display only the columns that are most relevant to each chart.
I don't feel strongly. If we did go with these settings at the dataset-level, then I think it would be clearer to move the UI part into the dataset settings.
Lastly it would be a nice synergy opportunity if the author could test out https://github.com/apache/superset/issues/28562 as part of this and either close it as fixed or take this opportunity to fix it.
Comment From: EMachad0
@sfirke You are correct, the main change is adding new controls for the Drill-to-Detail on the chart design screen. I changed the title to reflect that. Due to the reasons you pointed out, I'm in favor of keeping the new settings on chart-level.
Comment From: Vitor-Avila
Perhaps it makes sense that the dataset owner can remove columns from the drill to detail view, but then at the chart level the chart owner is able to remove more columns if needed for that particular chart (but never really add the ones the dataset owner removed)?
We might also want to think that currently the columns exposed in the Drill By menu are controlled via the is Dimension checkbox. If we're creating a new view/menu/etc, should we consider both Drill by and Drill to Detail?
- Does it make sense to have distinct selections? For example I want column A to support drill by, but not drill to detail, vice versa; or
- Should this new view control both D2D and Drill by (but not isolated)?; or
- Should it just control D2D and Drill By still respects is Dimension?
Btw for column labels to be applied I'm implementing it here: https://github.com/apache/superset/pull/34620
Comment From: adamcunnington-mlg
Thanks for opening this proposal!
I was about to comment the same as Vitor - that the inclusion of columns is currently controlled via the is Dimension checkbox which makes sense but also feels non-explicit. If the control is separate, is it constrained by the columns that are dimensions or should it be decoupled? I'm not sure!
It would be great to have dataset-level controls for which columns can be included in drill by menus (and I do think it makes sense for all D2D options to have the same behaviour here - could always iterate and split out later if required) and then further chart-level controls through a standardised dialog (for the chart types that support D2D).
As an aside, column descriptions should probably be a hover-over property when a user hovers over a column in a drill-by menu. For me, the focus here is about improving the UX for a user who is trying to drill into a chart. If they are a non-technical user, being able to curate the drill-by menu (by controlling which columns appear and hover-over descriptions) and also the D2D output (by controlling which columns appear in the output).
Comment From: mistercrunch
NOTE: did some work around attaching a drill-to-details chart to a dataset. If/when provided, it'll use that chart in place. Here's the project plan for it:
Custom Drill-Through Tables for Apache Superset
Overview
Enable Superset users to define customized drill-through views by selecting any existing chart as a drill target. Dataset owners can configure which chart should be used when drilling through from any chart using their dataset. This addresses the current limitation where drill-through displays ALL columns in a generic table, which can be overwhelming for wide datasets.
Goals
- Simplify drill-through experience - Show relevant data instead of all columns
- Flexible chart types - Allow any chart type as drill target, not just tables
- Dataset owner control - Dataset owners configure the drill experience for their data
- Maintain backwards compatibility - Falls back to current behavior if not configured
- Simple implementation - Avoid complex dynamic forms, ship quickly (2-3 days)
Implementation: Dataset-Level Chart Selection
User Workflow
- Dataset owner creates a chart with the desired drill-through view (any chart type)
- Dataset owner navigates to DatasetEditor
- Owner selects the chart from a dropdown (filtered to show charts using this dataset)
- When users drill through from any chart using this dataset (in any dashboard), they see the configured chart with appropriate filters applied
- If no configuration exists, falls back to system default (current "all columns" behavior)
Technical Design
Backend Changes
Database Schema
-- Add to datasets table (tables)
ALTER TABLE tables ADD COLUMN drill_through_chart_id INTEGER
  REFERENCES slices(id) ON DELETE SET NULL;
Model Update
# superset/models/core.py
class SqlaTable(Model, BaseDatasource):
    # ... existing fields
    drill_through_chart_id = Column(
        Integer, ForeignKey("slices.id", ondelete="SET NULL"),
        nullable=True
    )
    drill_through_chart = relationship(
        "Slice",
        foreign_keys=[drill_through_chart_id],
        backref=backref("drill_through_datasets", passive_deletes=True)
    )
API Extension
# superset/datasets/api.py
@expose("/<pk>/drill_through_chart", methods=["PUT", "DELETE"])
def drill_through_chart(self, pk: int):
    """Set or clear the drill-through chart for this dataset"""
    # Validate chart exists and uses same dataset
    # PUT body: { "chart_id": 123 }
Frontend Changes
DatasetEditor Component
// superset-frontend/src/features/datasets/DatasetEditor.tsx

// Get charts that use this dataset
const datasetCharts = useMemo(() => {
  return charts
    .filter(chart => chart.datasource_id === dataset.id)
    .map(chart => ({
      value: chart.id,
      label: `${chart.slice_name} (${chart.viz_type})`,
      viz_type: chart.viz_type
    }));
}, [charts, dataset.id]);

// Drill-through configuration section
<FormSection title="Drill-Through Configuration">
  <FormItem label="Default Drill-Through Chart">
    <Select
      ariaLabel="Select a chart as the drill-through view"
      options={datasetCharts}
      value={dataset.drill_through_chart_id}
      onChange={handleDrillThroughChange}
      allowClear
      placeholder="Default (show all columns)"
    />
    <HelperText>
      Select any chart using this dataset as the drill-through target.
      This will be used when users drill through from any chart using this dataset.
      Recommended: Use atomic-level data (table) or relevant aggregated view.
    </HelperText>
  </FormItem>
</FormSection>
Drill-through Modal Update
// superset-frontend/src/components/DrillDetail/DrillDetailModal.tsx

const renderDrillThroughContent = () => {
  const canEditDataset = dataset?.owners?.some(owner => owner.id === userId);
  const canExploreDataset = dataset?.can_explore;

  // Check dataset-level drill configuration
  const drillThroughChartId = dataset?.drill_through_chart_id;
  const drillThroughChart = drillThroughChartId ?
    charts.find(c => c.id === drillThroughChartId) : null;

  return (
    <>
      {/* Feature discoverability banner */}
      {!drillThroughChartId && canEditDataset && (
        <Alert
          message="Customize this drill-through view"
          description={
            <>
              Dataset owners can customize which chart appears in drill-through views.{' '}
              <a href={`/superset/datasourceeditor/${dataset.datasource_type}/${dataset.id}/`}>
                Edit dataset settings
              </a> to select a chart as your drill-through target.
            </>
          }
          type="info"
          showIcon
          closable
          css={{ marginBottom: 16 }}
        />
      )}

      {/* Exploration action - always show if user has access */}
      {canExploreDataset && (
        <div css={{ textAlign: 'right', marginBottom: 16 }}>
          <Button
            type="link"
            icon={<ExploreOutlined />}
            onClick={() => {
              const exploreUrl = buildExploreUrl({
                datasource: `${dataset.id}__${dataset.datasource_type}`,
                formData: {
                  viz_type: drillThroughChart ? drillThroughChart.viz_type : 'table',
                  adhoc_filters: drillFilters,
                  row_limit: drillRowLimit,
                  ...(drillThroughChart ? drillThroughChart.formData : {}),
                },
              });
              window.open(exploreUrl, '_blank');
            }}
          >
            Explore this data
          </Button>
        </div>
      )}

      {drillThroughChart ? (
        // Use configured chart from dataset
        <SuperChart
          chartType={drillThroughChart.viz_type}
          formData={{
            ...drillThroughChart.formData,
            // Override with drill-through filters
            adhoc_filters: [...(drillThroughChart.formData.adhoc_filters || []), ...drillFilters],
            row_limit: drillRowLimit,
          }}
          queriesData={drillQueriesData}
          height={400}
          width="100%"
        />

        // Option 2: Use StatefulChart if available (PR #34526)
        // <StatefulChart
        //   chartId={drillThroughChartId}
        //   overrideFormData={{
        //     adhoc_filters: drillFilters,
        //     row_limit: drillRowLimit,
        //   }}
        // />
      ) : (
        // Fallback: current behavior with generic table showing all columns
        <SuperChart chartType="table" formData={genericTableFormData} />
      )}
    </>
  );
};
Key Implementation Decisions
- Dataset-Level Configuration: Single dropdown in DatasetEditor avoids complex dynamic forms
- Any Chart Type Allowed: No restriction to tables - users can drill to any visualization type
- Chart Filtering: Dropdown shows only charts using the current dataset
- Graceful Fallback: If no configuration exists, falls back to current "all columns" behavior
- Permission-Based Configuration: Dataset owners control the drill-through experience
- Rendering Approach:
- Primary: Use
SuperChartwith target chart's formData and drill filters - Alternative: Leverage
StatefulChartfrom PR #34526 if available - Feature Discoverability: Show contextual prompt to dataset owners when no config exists
- Simple Implementation: Ship in 2-3 days instead of 2-3 weeks with complex dynamic forms
Files to Modify
- Backend:
superset/models/core.py- Add drill_through_chart_id field to SqlaTablesuperset/datasets/api.py- Add drill-through chart endpointsuperset/datasets/schemas.py- Include drill_through_chart_id in serializationsuperset/migrations/versions/- New migration file for tables table-
superset/datasets/dao.py- Update queries to include drill-through chart relationship -
Frontend:
superset-frontend/src/features/datasets/DatasetEditor.tsx- Add drill-through dropdownsuperset-frontend/src/components/DrillDetail/DrillDetailModal.tsx- Use dataset configsuperset-frontend/src/types/Dataset.ts- Update Dataset type with drill_through_chart_idsuperset-frontend/src/features/datasets/api.ts- Drill-through chart API calls
Testing Strategy
Unit Tests
- [ ] Dataset model drill_through_chart_id field and relationship
- [ ] API endpoint validation (chart exists, uses same dataset)
- [ ] Schema serialization with drill-through chart
- [ ] Null handling when chart is deleted (ON DELETE SET NULL)
Integration Tests
- [ ] End-to-end: Configure dataset drill target → Drill through → See configured chart
- [ ] Target chart deletion → Verify fallback to system default
- [ ] Cross-database compatibility
- [ ] Permission checks (dataset edit required for configuration)
- [ ] Same configuration used across multiple dashboards
Manual Testing
- [ ] Various chart types as drill targets (table, bar, line, pie, etc.)
- [ ] Complex chart configurations (calculated columns, custom formatting)
- [ ] Performance comparison (configured vs. default drill-through)
- [ ] Dataset used in multiple dashboards shows same drill-through
- [ ] Mixed scenarios: Some datasets configured, others using defaults
Current Status
- [x] Technical design complete
- [x] Implementation approach decided (Dataset-Level Chart Selection)
- [x] Simplified from dashboard-level to dataset-level to avoid dynamic forms
- [x] Future roadmap defined with dashboard overrides as Phase 2
- [ ] Database migration created
- [ ] Backend API implemented
- [ ] Frontend drill configuration added to DatasetEditor
- [ ] Drill-through modal updated for dataset config lookup
- [ ] Tests written
- [ ] Documentation updated
Related PRs/Issues
- StatefulChart PR: #34526 - Could simplify implementation
- Original drill-through feature: [Reference needed]
- Discussion: [To be created]
Future Enhancements
Phase 2: Dashboard-Level Overrides (Contextual Control)
Goal: Allow dashboards to override dataset defaults for contextual drill experiences
Implementation:
- Add drill_through_overrides JSON field to dashboard model
- Dashboard editor can optionally override dataset defaults
- Precedence: Dashboard override → Dataset default → System default
- Avoids complex dynamic forms - only configure overrides when needed
Benefits: - Different dashboards can have different drill targets for same dataset - Dashboard creators get contextual control when needed - Dataset defaults still provide good baseline experience - Simple UI - only show override option, not dynamic form for all datasets
Example Structure:
dashboard.drill_through_overrides = {
  "dataset_123": { chart_id: 789 },  // Override only this dataset
  // Other datasets use their configured defaults
}
Phase 3: Multiple Drill Targets & Submenu
Goal: Allow multiple drill-through options with contextual submenu
Implementation:
// Dataset level - multiple default options
dataset.drill_through_targets = [
  { id: 'atomic', label: 'Order Line Details', chart_id: 456, icon: 'table' },
  { id: 'summary', label: 'Order Summary', chart_id: 789, icon: 'bar-chart' },
  { id: 'trends', label: 'Trend Analysis', chart_id: 101, icon: 'line-chart' }
];

// Dashboard can still override with its own set
dashboard.drill_through_overrides = {
  "dataset_123": {
    targets: [...customTargets],
    default_target: 'summary'
  }
}
UX: Right-click drill menu with multiple options, or dropdown in drill-through modal
Phase 4: Cross-Dashboard Drilling
Goal: Enable drilling to entire dashboards with contextual filters
Implementation: - Add dashboard targets to drill configuration - Filter context preservation across dashboard navigation - Dashboard embedding vs. new page navigation options
Use Cases: - Executive summary → Operational deep-dive dashboard - Regional KPI → Regional analysis dashboard - Product performance → Product detail dashboard
Phase 5: Smart Drill Suggestions
Goal: AI-powered suggestions for drill-through targets based on data relationships
Implementation: - Analyze dataset relationships and common query patterns - Suggest relevant charts for drill-through configuration - Auto-generate drill targets based on data model
Phase 6: Advanced Configuration Features
- Permission-based targets: Different drill options for different user roles
- Conditional drilling: Show different targets based on data values
- Drill-through analytics: Track which drill targets are most used
- Template marketplace: Share drill-through configurations across organizations
Feature Discoverability
To help users discover this new feature, we'll show an informational alert in the drill-through modal when: - No drill-through chart has been configured for the dataset - Current user is an owner of the dataset
Discoverability Strategy: - Target Audience: Only dataset owners (they have permission to configure) - Timing: When they encounter the default "all columns" drill-through - Action: Direct link to DatasetEditor with clear instructions - Dismissible: Users can close the alert if not interested
Exploration Enhancement: - "Explore this data" button: Always shown if user has dataset exploration permissions - Smart formData: Carries over drill-through filters and configured chart settings to Explore view - Opens in new tab: Preserves current drill-through context while allowing deeper exploration
This approach ensures: - Feature is discovered organically during usage - Only relevant users see the prompt (owners who can actually configure it) - Clear call-to-action with direct navigation - Non-intrusive (closable alert, only shows when relevant) - Easy transition to full exploration when users want more control
Notes
- Architecture Decision: Dataset-level approach avoids complex dynamic forms while providing value quickly
- No Chart Type Restrictions: Users can drill to any chart type (table, bar, line, pie, etc.) for maximum flexibility
- Graceful Degradation: System falls back to current behavior when no configuration exists
- Permission Model: Dataset owners control drill experience (simpler than dashboard-level permissions)
- Future Extensibility: Clear path to dashboard overrides, multiple targets, and cross-dashboard drilling
- Performance: Minimal impact - just rendering different chart with same data + filters
- Discoverability: Alert prompts dataset owners to configure drill-through when using defaults
- Exploration Flow: "Explore this data" button provides seamless transition to full analysis with context preserved
- MVP Timeline: 2-3 days implementation vs 2-3 weeks for dashboard-level dynamic forms
Comment From: rusackas
@EMachad0 (and everyone else)... the vote has PASSED, and you're free to open the PR(s) needed to carry out the work. We'll close this SIP as the SIP process has completed, and we'll move this Issue to the "In Progress" column on the SIP board. Thanks in advance for the contributions here!
Comment From: mistercrunch
My solution here -> https://github.com/apache/superset/pull/34785 , not sure if it addresses all needs?