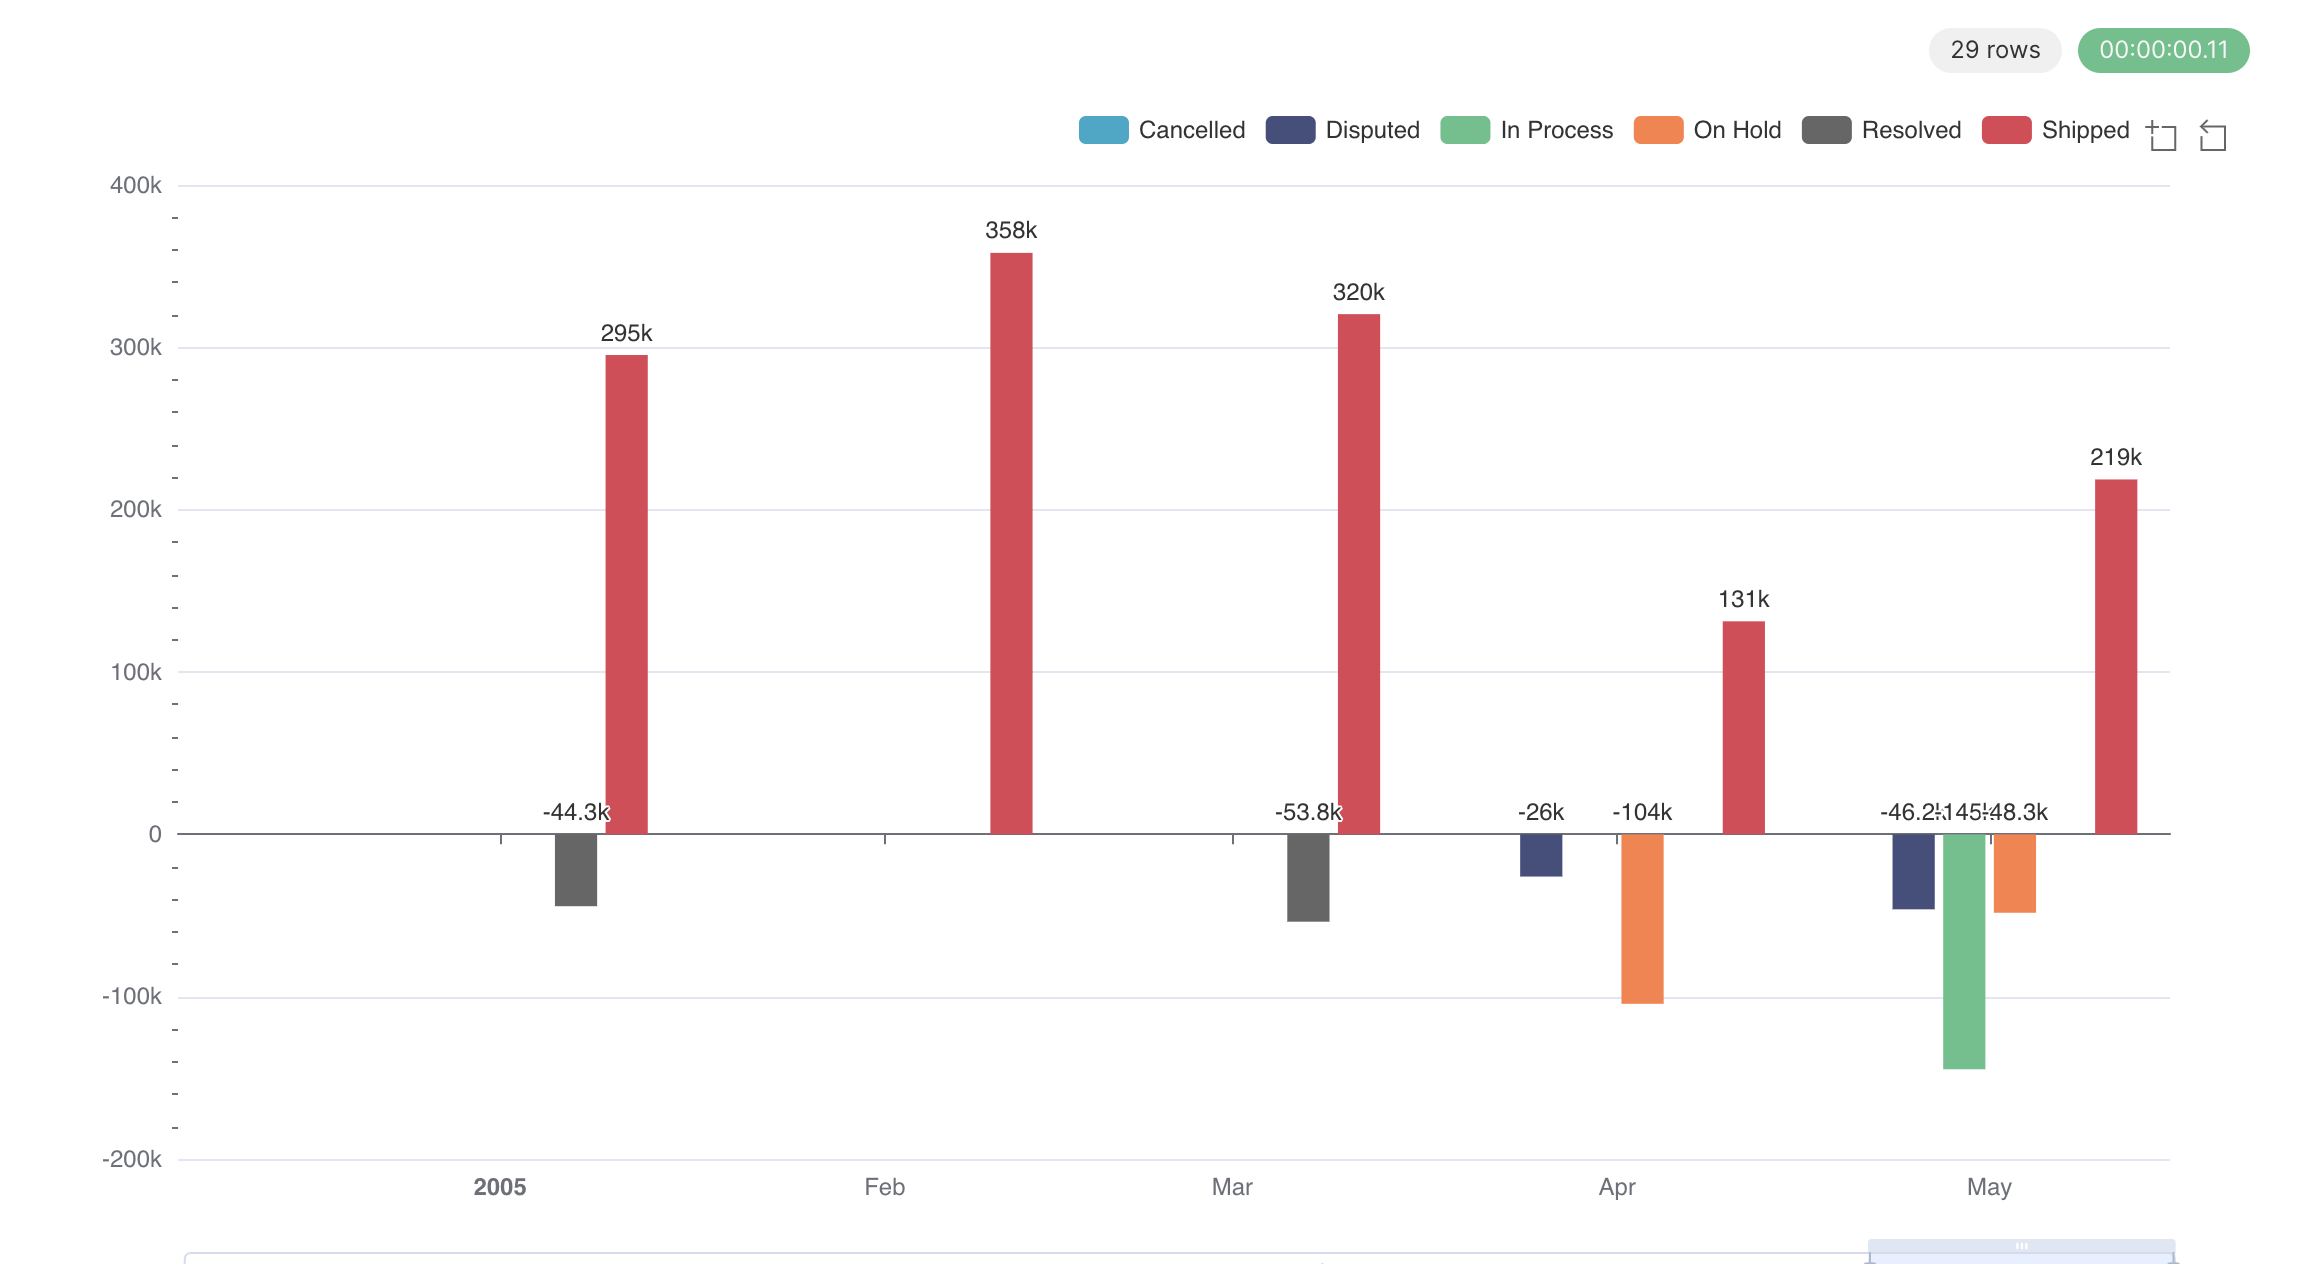
Enabling 'Show Value' in bar chart should show the value label at the top of the bar(for +ve value) or below the bar(for -ve value), but it always shows value on top of bar. So all negative value labels end up on X-axis.
How to reproduce the bug
- Create a bar chart with negative values.
- Enable 'Show Value' option.
Expected results
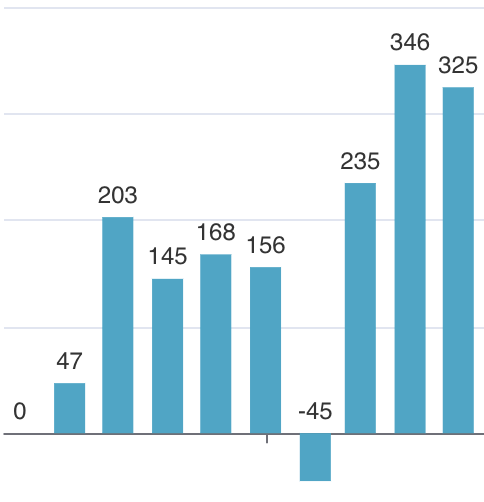
Negative values should be shown below the bar.
Actual results
Negative values are shown on X-axis.
Screenshots
Here is a sample in master.
Environment
- browser type and version: Chrome
- superset version:
master
docker hub image
Checklist
Make sure to follow these steps before submitting your issue - thank you!
- [x] I have checked the superset logs for python stacktraces and included it here as text if there are any.
- [x] I have reproduced the issue with at least the latest released version of superset.
- [x] I have checked the issue tracker for the same issue and I haven't found one similar.
Additional context
Add any other context about the problem here.
Comment From: Quang-Dong
Hi, any update? is this problem fixed?
Comment From: geido
It looks like this is still a thing. @villebro curious if there was any update for this based on the conversation on this PR https://github.com/apache/superset/pull/21032
Comment From: rusackas
Looks like it's still happening, nearly 5 months later.
If nobody steps up to work on this, we might close it as stale before long to maintain a more actionable backlog.
Comment From: rusackas
Noting that while this issue went stale, the PR is active... let's see if we can finish this! :D
Comment From: rusackas
Hoping to close this out by merging the linked PR once it's rebased... this shall all soon be behind us :D