Feature Type
-
[X] Adding new functionality to pandas
-
[ ] Changing existing functionality in pandas
-
[ ] Removing existing functionality in pandas
Problem Description
I wish I could use pandas to quickly convert datetime/Timestamp objects to "decimal year" floating point numbers for subsequent visualization and analysis.
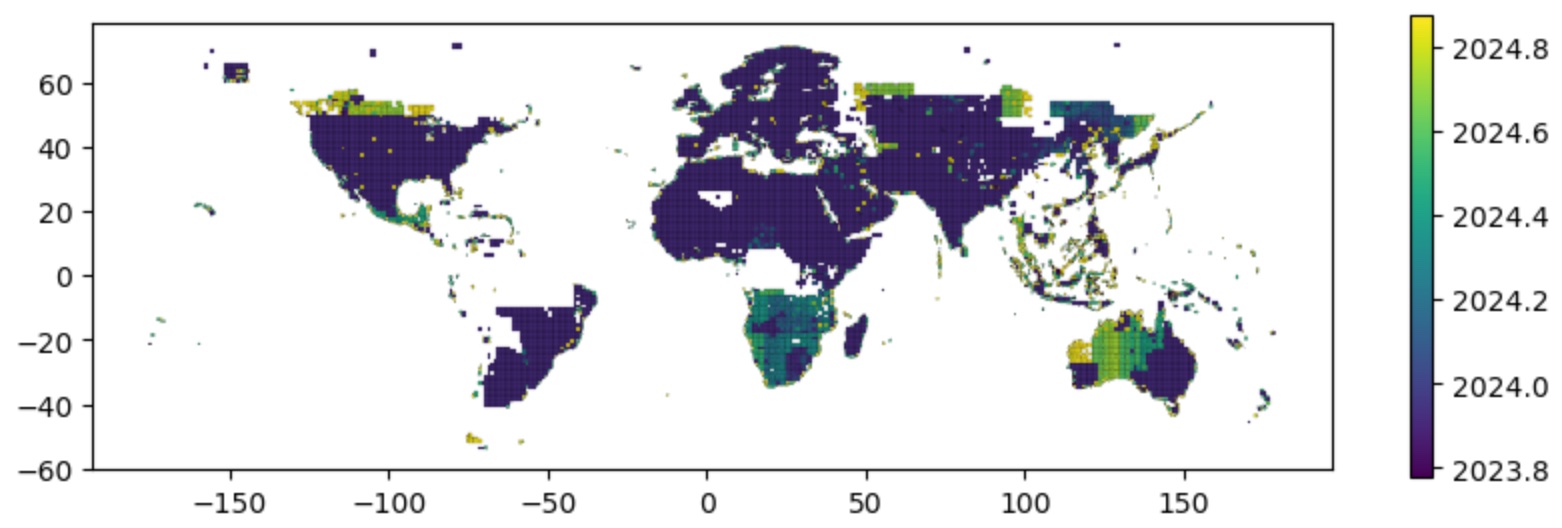
A number of plotting packages (e.g., GeoPandas, matplotlib) encounter issues when casting datetime/Timestamp objects to float. For example, I often encounter errors when trying to create a choropleth map to visualize a GeoDataFrame column containing datetime objects. Decimal years also simplify the legend/colorbar labels.
Feature Description
This is a simple function to accomplish this. It's not perfect, but does the job. Would need to re-implement as a Timestamp and/or dt accessor property (dt.decyear). Should be relatively simple, I think.
#Decimal year (useful for plotting)
from datetime import datetime as dt
import time
def toYearFraction(date):
    def sinceEpoch(date): # returns seconds since epoch
        return time.mktime(date.timetuple())
    s = sinceEpoch

    year = date.year
    startOfThisYear = dt(year=year, month=1, day=1)
    startOfNextYear = dt(year=year+1, month=1, day=1)

    yearElapsed = s(date) - s(startOfThisYear)
    yearDuration = s(startOfNextYear) - s(startOfThisYear)
    fraction = yearElapsed/yearDuration

    return date.year + fraction
Alternative Solutions
Define and apply a custom function:
df['dt_col_decyear'] = df['dt_col'].apply(toYearFraction)
Additional Context
When attempting to plot column containing datetime values...
gdf.plot(column='dt_col', legend=True)
File [~/sw/miniconda3/envs/shean_py3/lib/python3.12/site-packages/geopandas/plotting.py:175](http://localhost:8888/lab/tree/src/stereo-lidar_archive_search/notebooks/~/sw/miniconda3/envs/shean_py3/lib/python3.12/site-packages/geopandas/plotting.py#line=174), in _plot_polygon_collection(ax, geoms, values, color, cmap, vmin, vmax, autolim, **kwargs)
    172 collection = PatchCollection([_PolygonPatch(poly) for poly in geoms], **kwargs)
    174 if values is not None:
--> 175     collection.set_array(np.asarray(values))
    176     collection.set_cmap(cmap)
    177     if "norm" not in kwargs:

File [~/sw/miniconda3/envs/shean_py3/lib/python3.12/site-packages/matplotlib/cm.py:452](http://localhost:8888/lab/tree/src/stereo-lidar_archive_search/notebooks/~/sw/miniconda3/envs/shean_py3/lib/python3.12/site-packages/matplotlib/cm.py#line=451), in ScalarMappable.set_array(self, A)
    450 A = cbook.safe_masked_invalid(A, copy=True)
    451 if not np.can_cast(A.dtype, float, "same_kind"):
--> 452     raise TypeError(f"Image data of dtype {A.dtype} cannot be "
    453                     "converted to float")
    455 self._A = A
    456 if not self.norm.scaled():

TypeError: Image data of dtype object cannot be converted to float
Comment From: rhshadrach
Thanks for the request. Can you provide input, a proposed syntax for the operation, and what your expected output would be.
Comment From: dshean
Sure. Something like df['dt_col'].dt.decyear could work well, using the dt accessor.
Would convert column of datetime64 (e.g.,2024-11-15 12:13:12+00:00) to float64 (e.g., 2024.872976)
Comment From: AryanK1511
@rhshadrach if you don't mind, I would love to work on this issue
Comment From: rhshadrach
Here is a vectorized version:
dates = ["2024-05-30", "2025-05-30"]
df = pd.DataFrame({"date": dates})
df["date"] = pd.to_datetime(df["date"], format="%Y-%m-%d")

year = df["date"].dt.year
days = (pd.to_datetime(year+1, format='%Y') - pd.to_datetime(year, format='%Y')).dt.days
result = year + (df["date"] - pd.to_datetime(year, format='%Y')) / (days * pd.to_timedelta(1, unit="D"))
print(result)
# 0    2024.409836
# 1    2025.408219
# Name: date, dtype: float64
@AryanK1511 - I think this needs discussion from the core team. It seems straightforward to calculate this from the existing API, I'm not sure it warrants inclusion.
Comment From: dshean
Thanks @rhshadrach. Nice simple solution. My only suggestion would be to include timestamps as well.
dates = ["2024-05-30 12:00:00", "2024-05-30 12:00:01", "2025-05-30 12:00:00"]
df = pd.DataFrame({"date": dates})
df["date"] = pd.to_datetime(df["date"], format="%Y-%m-%d %H:%M:%S")
...
pd.set_option("display.precision", 8)
print(result)
#0    2024.41120219
#1    2024.41120222
#2    2025.40958904
I agree this is a straightforward calculation. The request is mostly one of convenience and centralization, so each user doesn't have to implement their own function or include those 3 lines whenever they want to do this.
Comment From: rhshadrach
The request is mostly one of convenience and centralization, so each user doesn't have to implement their own function or include those 3 lines whenever they want to do this.
I do not think using such a criteria is sustainable for the pandas API. Rather, it should be the goal of pandas to provide an API with the fundamental tools so that users can combine various operations in a short and straight forward manner to accomplish their needs. I believe that is already being done here.
Comment From: jbrockmendel
@MarcoGorelli this seems related to the USC project from a while back. would that have solved the OP problem and if it so was it open-sourced?
Comment From: MarcoGorelli
hey - I haven't read through this issue, but yes, it was open sourced: - https://github.com/LinkedEarth/Pyleoclim_util - https://pyleoclim-util.readthedocs.io/en/latest/ - https://quansight.com/post/pandas-and-the-geosciences-a-4-5-billion-year-story/
Comment From: mroeschke
Thanks but seems like there's not eagerness to add a new API for this so closing