Screenshot
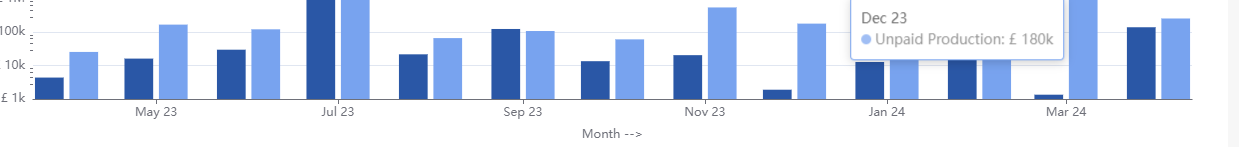
Time Series Bar Chart is Showing only Alternate Months in the X axis despite having data
[describe the issue here!]
Design input
I want to see every month being displayed on the x-axis
Comment From: shantanukhond
For the above chart can you try changing X Axis time format from adaptive to
%b %y
(you can manually type this as it will not be available in list by default. it will work)
as shown in screenshot below if it works?

Comment From: rusackas
I think this issue is still relevant as of 4.1.1. If anyone wants to resolve this, we're open to a "force all ticks" checkbox or something along those lines in the control panel, if you want to open a PR. In many cases, that might make for an overlapping label nightmare, but you can also rotate labels and other tricks to go with it. Maybe @kasiazjc has ideas here.
That said, it's not anyone's burning priority that I'm aware of, so we're open to PRs, but this might be closed as a "won't fix" if it goes stale agian.
Comment From: magickspell
It looks like this can be handled in code:
in file /superset/superset-frontend/plugins/plugin-chart-echarts/src/Timeseries/transformProps.ts
add splitNumber: data.length, somewhere in xAxis object let xAxis: any = {
let xAxis: any = {
    splitNumber: data.length,
    type: xAxisType,
    name: xAxisTitle,
    nameGap: convertInteger(xAxisTitleMargin),
    nameLocation: 'middle',
    axisLabel: {
      hideOverlap: true,
      formatter: xAxisFormatter,
      rotate: xAxisLabelRotation,
    },
    minorTick: { show: minorTicks },
    minInterval:
      xAxisType === AxisType.Time && timeGrainSqla
        ? TIMEGRAIN_TO_TIMESTAMP[
            timeGrainSqla as keyof typeof TIMEGRAIN_TO_TIMESTAMP
          ]
        : 0,
    ...getMinAndMaxFromBounds(
      xAxisType,
      truncateXAxis,
      xAxisMin,
      xAxisMax,
      seriesType,
    ),
  };
Comment From: sfirke
Is this still an issue after this merged: https://github.com/apache/superset/pull/33729 ?