Feature Type
-
[x] Adding new functionality to pandas
-
[ ] Changing existing functionality in pandas
-
[ ] Removing existing functionality in pandas
Problem Description
The DataFrame.describe() method includes standard deviation (std), but its significance is hard to interpret without context, as it depends on the data’s scale. The coefficient of variation (CV = std / mean * 100) provides a relative measure of variability, making it easier to assess if std is "big."
Feature Description
Add CV as a row in DataFrame.describe() output for numeric columns, optionally enabled via df.describe(include_cv=True).
Example
import pandas as pd
data = {'A': [10, 12, 14, 15, 13], 'B': [1000, 1100, 900, 950, 1050]}
df = pd.DataFrame(data)
desc = df.describe()
desc.loc['CV (%)'] = (df.std() / df.mean() * 100)
print(desc)
Output:
               A            B
count   5.000000     5.000000
mean   12.800000  1000.000000
std     1.923538    79.056942
min    10.000000   900.000000
25%    12.000000   950.000000
50%    13.000000  1000.000000
75%    14.000000  1050.000000
max    15.000000  1100.000000
CV (%) 15.027641     7.905694
Benefits
- Interpretability: CV shows relative variability, aiding comparison across columns.
- Usability: Simplifies exploratory data analysis.
- Relevance: Widely used in fields like finance and biology.
Alternative Solutions
Users can compute CV manually, but this is less convenient.
Additional Context
No response
Comment From: rhshadrach
Thanks for the request. This is similar to https://github.com/pandas-dev/pandas/issues/59897, we receive various requests to rows to DataFrame.describe. If we were to add them, describe would become overloaded and noisy. I'm opposed here.
As the OP demonstrates, pandas makes it simple to add such a row already.
Comment From: ffaa1234
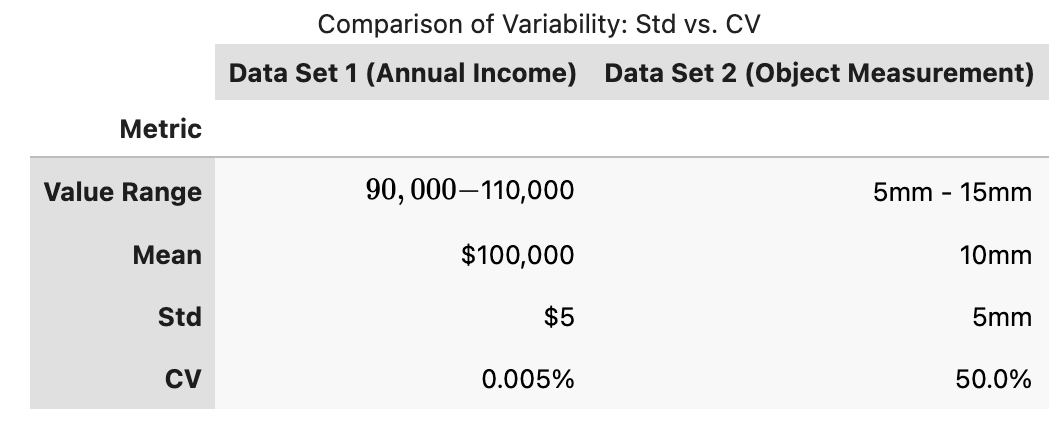
@rhshadrach I understand your concerns about describe() becoming overloaded. However, standard deviation alone often lacks context; its significance depends entirely on the data's scale.
In this example, both features have an STD of 5, but they tell completely different stories about the data. The first STD is very low, and the second is very high, because their value ranges differ significantly.
Comment From: rhshadrach
@ffaa1234 - I understand; my position remains unchanged.
Comment From: mroeschke
Agreed with @rhshadrach. Unfortunately convenience of an operation and importance of a metric are too subjective to make changes for every request in pandas.
Thanks for the suggestion but closing.