Pandas version checks
-
[X] I have checked that this issue has not already been reported.
-
[ ] I have confirmed this bug exists on the latest version of pandas.
-
[ ] I have confirmed this bug exists on the main branch of pandas.
Reproducible Example
import pandas as pd
chunk = pd.DataFrame(index=[0, 1, 2])
df = pd.concat([chunk.assign(y=i, i=i) for i in range(3)])
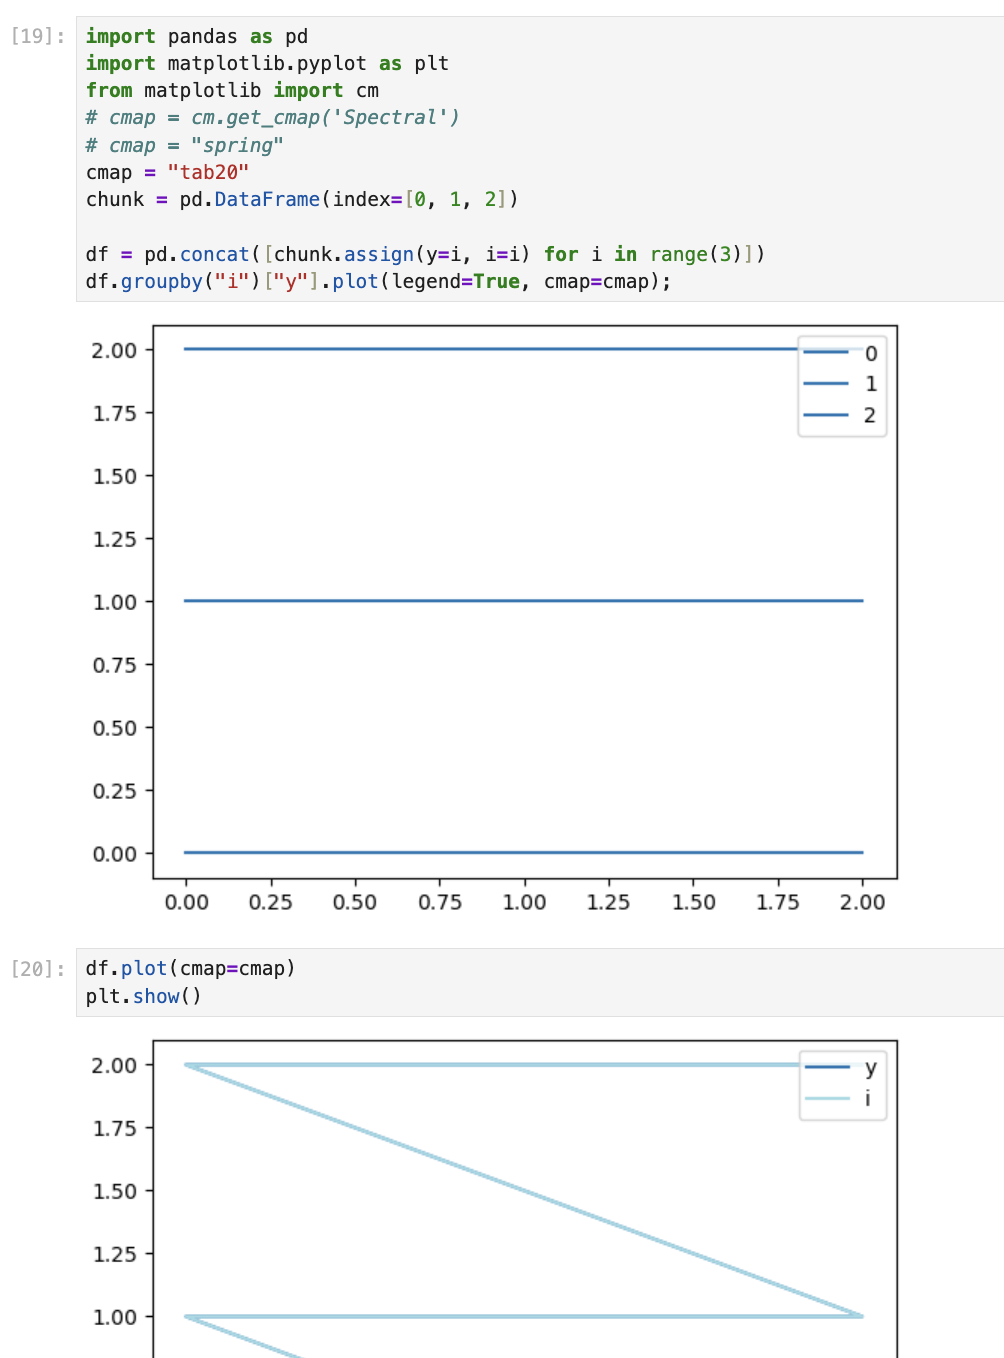
df.groupby("i")["y"].plot(legend=True, cmap="tab20");
Issue Description
The above code snippet demonstrates that cmap="tab20" is not respected. The parameter is respected in DataFrame.plot, which can be checked by viewing
df.plot(cmap="tab20")
Expected Behavior
The cmap parameter should be correctly handled
Installed Versions
Comment From: zhuoyahuang
take
Comment From: zhuoyahuang
Hi @matteosantama Can you please attach a screenshot if this is still an issue? I couldn't reproduce the problem, I've tried a few different colormaps and the cmap feature looks good to me
Comment From: matteosantama
You can see the problem in your screenshot. In your first plot, all three lines have the same color. They should have three different colors, corresponding to the three group-by keys.
For example, see what you get if you don't pass any colormap
df.groupby("i")["y"].plot(legend=True);
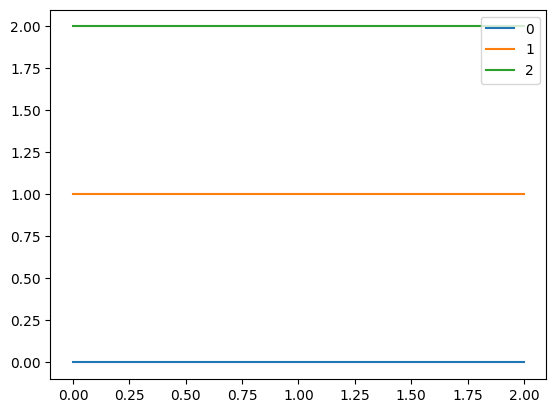
You should be able to control the colors used.
Just a heads up, though, it looks like the right parameter is colormap, not cmap: https://pandas.pydata.org/docs/reference/api/pandas.core.groupby.SeriesGroupBy.plot.html#pandas.core.groupby.SeriesGroupBy.plot
The problem persists with the right parameter, though.
Comment From: zhuoyahuang
Thanks for explaining much appreciated. I'll look into this issue deeper.