Pandas version checks
-
[X] I have checked that this issue has not already been reported.
-
[X] I have confirmed this bug exists on the latest version of pandas.
-
[ ] I have confirmed this bug exists on the main branch of pandas.
Reproducible Example
import pandas as pd
pd.__version__
# '2.0.3'
s = pd.Series([1, 3, 2], index=[2010, 2015, 2020])
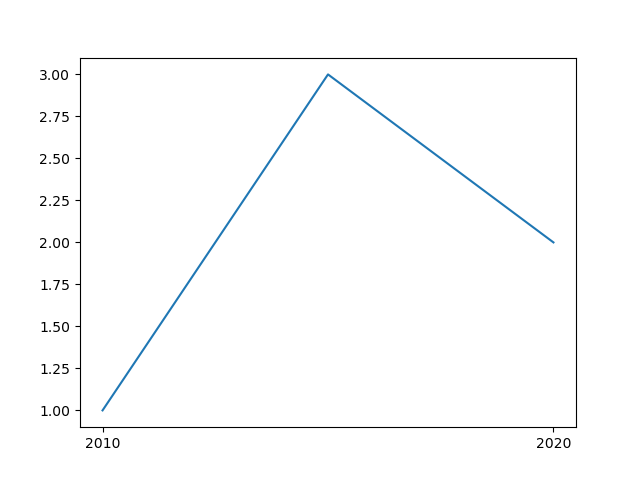
# works fine (see line.png)
s.plot(xticks=[2010, 2020])
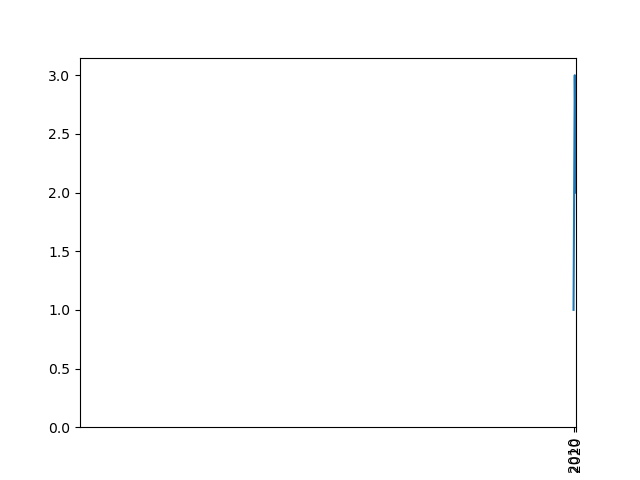
# ticks and bars are all squashed to the right of the plot (see bar.png)
s.plot.bar(xticks=[2010, 2020])
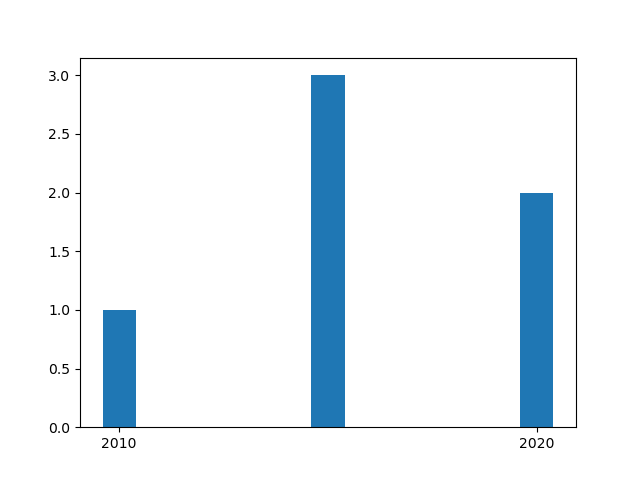
# works fine too
s.plot.bar()
Issue Description
When using the xticks argument on a bar plot, it is kind of "squashed" to the right of the plot.
Ticks and bars are all on a single tick on the right:
For line plots, this works fine:
The issue is also present in Pandas 2.1.1 (latest stable version as of today) and Pandas 1.5.3. It might be related to #11465.
Expected Behavior
import matplotlib.pyplot as plt

fig, ax = plt.subplots()
ax.bar([2010, 2015, 2020], [1, 3, 2])
ax.set_xticks([2010, 2020])
plt.show()
Installed Versions
INSTALLED VERSIONS
commit : 0f437949513225922d851e9581723d82120684a6 python : 3.10.13.final.0 python-bits : 64 OS : Windows OS-release : 10 Version : 10.0.19045 machine : AMD64 processor : Intel64 Family 6 Model 142 Stepping 12, GenuineIntel byteorder : little LC_ALL : None LANG : None LOCALE : French_Belgium.1252
pandas : 2.0.3 numpy : 1.22.3 pytz : 2023.3.post1 dateutil : 2.8.2 setuptools : 68.0.0 pip : 23.2.1 Cython : 0.29.33 pytest : 7.3.1 hypothesis : None sphinx : None blosc : None feather : None xlsxwriter : 3.1.1 lxml.etree : 4.9.3 html5lib : None pymysql : None psycopg2 : None jinja2 : 3.1.2 IPython : 8.15.0 pandas_datareader: None bs4 : 4.12.2 bottleneck : 1.3.5 brotli : fastparquet : None fsspec : None gcsfs : None matplotlib : 3.7.1 numba : 0.57.0 numexpr : 2.8.7 odfpy : None openpyxl : 3.0.10 pandas_gbq : None pyarrow : 11.0.0 pyreadstat : None pyxlsb : None s3fs : None scipy : None snappy : None sqlalchemy : None tables : 3.8.0 tabulate : None xarray : None xlrd : 2.0.1 zstandard : None tzdata : 2023.3 qtpy : 2.2.0 pyqt5 : None
Comment From: hvsesha
@gdementen s.plot.bar(xticks=[0, 20]) This works .Kindly check import pandas as pd import matplotlib.pyplot as plt pd.version
'2.0.3'
s = pd.Series([1, 3, 2], index=[2010, 2015, 2020])
works fine (see line.png)
s.plot(xticks=[2010, 2030]) plt.show()
ticks and bars are all squashed to the right of the plot (see bar.png)
s.plot.bar(xticks=[0, 20]) plt.show()
works fine too
Comment From: gdementen
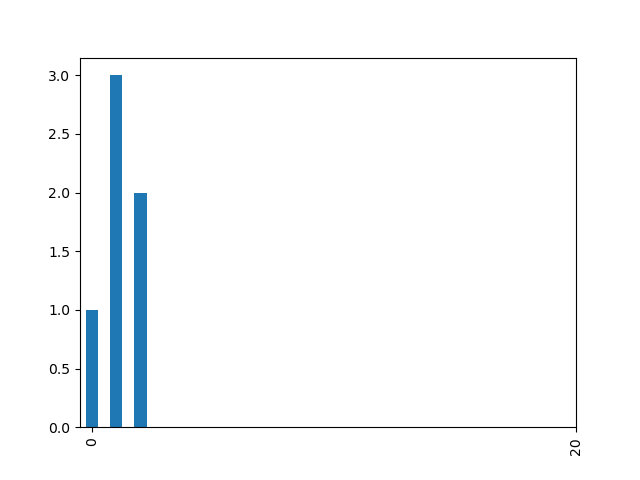
s.plot.bar(xticks=[0, 20]) This works .
>>> s = pd.Series([1, 3, 2], index=[2010, 2015, 2020])
>>> s.plot.bar(xticks=[0, 20])
Produces the image below. I am confused why you consider this to be working.
Kindly check import pandas as pd import matplotlib.pyplot as plt pd.version
As I said above, I checked with 3 different pandas versions (2.1.1, 2.0.3 and 1.5.3) and they all showed the bug.
Comment From: hvsesha
Hi If the range not starts from zero then we do have this issue My range starts from zero
Comment From: ax-va
I write the code in the jupyter qtconsole:
import pandas as pd
mydf = pd.DataFrame(data={"col_a": [1, 2, 3], "col_b": [4, 5, 6]}, index=[1900, 1950, 2000])
mydf
"""
      col_a  col_b
1900      1      4
1950      2      5
2000      3      6
"""

mydf.index
"""
Index([1900, 1950, 2000], dtype='int64')
"""
ax = mydf.col_a.plot(kind="bar")
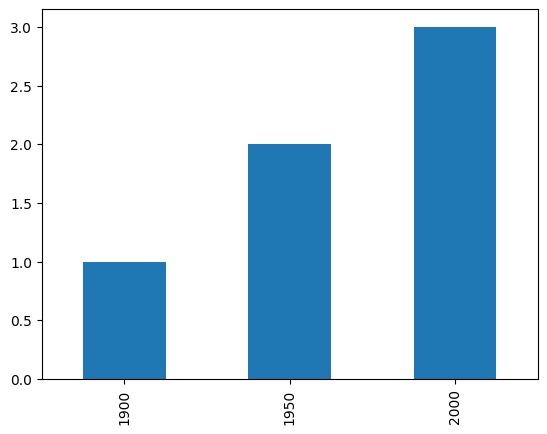
ax = mydf.col_a.plot(kind="bar")
ax.set_xlim([0, 10])
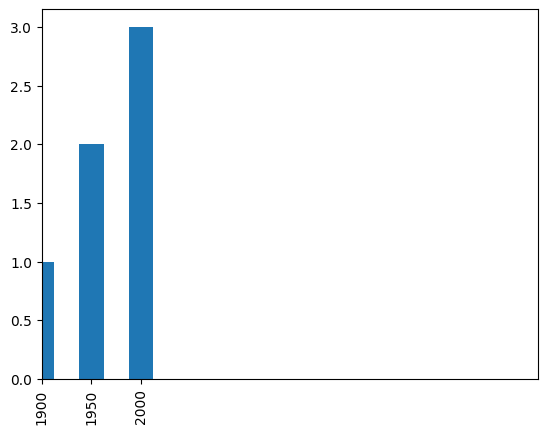
ax.xaxis.get_ticklocs()
"""
array([0, 1, 2])
"""
pd.__version__
"""
'2.1.3'
"""
The problem is that the Pandas' plot does not take the index of Series or DataFrame as the x-axis values but sets sequential indices starting from 0. Thus the x-axis values are wrong but the x-axis labels remain correct.
For correct plotting I should get
ax.xaxis.get_ticklocs()
"""
array([1900, 1950, 2000])
"""
That is obviously a bug in my opinion.