What version of Go are you using (go version)?
$ go version
go version go1.24.5 linux/amd64
Does this issue reproduce with the latest release?
Yes.
What operating system and processor architecture are you using (go env)?
go env Output
$ go env
AR='ar'
CC='gcc'
CGO_CFLAGS='-O2 -g'
CGO_CPPFLAGS=''
CGO_CXXFLAGS='-O2 -g'
CGO_ENABLED='1'
CGO_FFLAGS='-O2 -g'
CGO_LDFLAGS='-O2 -g'
CXX='g++'
GCCGO='gccgo'
GO111MODULE=''
GOAMD64='v1'
GOARCH='amd64'
GOAUTH='netrc'
GOBIN=''
GOCACHE='/home/redacted/.cache/go-build'
GOCACHEPROG=''
GODEBUG=''
GOENV='/home/redacted/.config/go/env'
GOEXE=''
GOEXPERIMENT=''
GOFIPS140='off'
GOFLAGS=''
GOGCCFLAGS='-fPIC -m64 -pthread -Wl,--no-gc-sections -fmessage-length=0 -ffile-prefix-map=/tmp/go-build1320095087=/tmp/go-build -gno-record-gcc-switches'
GOHOSTARCH='amd64'
GOHOSTOS='linux'
GOINSECURE=''
GOMOD='/home/redacted/code/mess/reproduce-questionmark-build/go.mod'
GOMODCACHE='/home/redacted/go/pkg/mod'
GONOPROXY='github.com/redacted/*'
GONOSUMDB='github.com/redacted/*'
GOOS='linux'
GOPATH='/home/redacted/go'
GOPRIVATE='github.com/redacted/*'
GOPROXY='https://proxy.golang.org,direct'
GOROOT='/usr/local/go'
GOSUMDB='sum.golang.org'
GOTELEMETRY='local'
GOTELEMETRYDIR='/home/redacted/.config/go/telemetry'
GOTMPDIR=''
GOTOOLCHAIN='auto'
GOTOOLDIR='/usr/local/go/pkg/tool/linux_amd64'
GOVCS=''
GOVERSION='go1.24.5'
GOWORK=''
PKG_CONFIG='pkg-config'
uname -sr: Linux 6.8.0-60-generic
Distributor ID: Ubuntu
Description:    Ubuntu 22.04.3 LTS
Release:    22.04
Codename:   jammy
/lib/x86_64-linux-gnu/libc.so.6: GNU C Library (Ubuntu GLIBC 2.35-0ubuntu3.10) stable release version 2.35.
gdb --version: GNU gdb (Ubuntu 12.1-0ubuntu1~22.04.2) 12.1
What did you do?
Disassembly of annotated source code in pprof looks wrong when cross compiling for ARMv7. I get question marks and seemingly irrelevant instructions. I've made a repository that documents the issue here: https://github.com/tholok97/pprof-weblist-annotation-on-arm-looks-buggy
What did you expect to see?
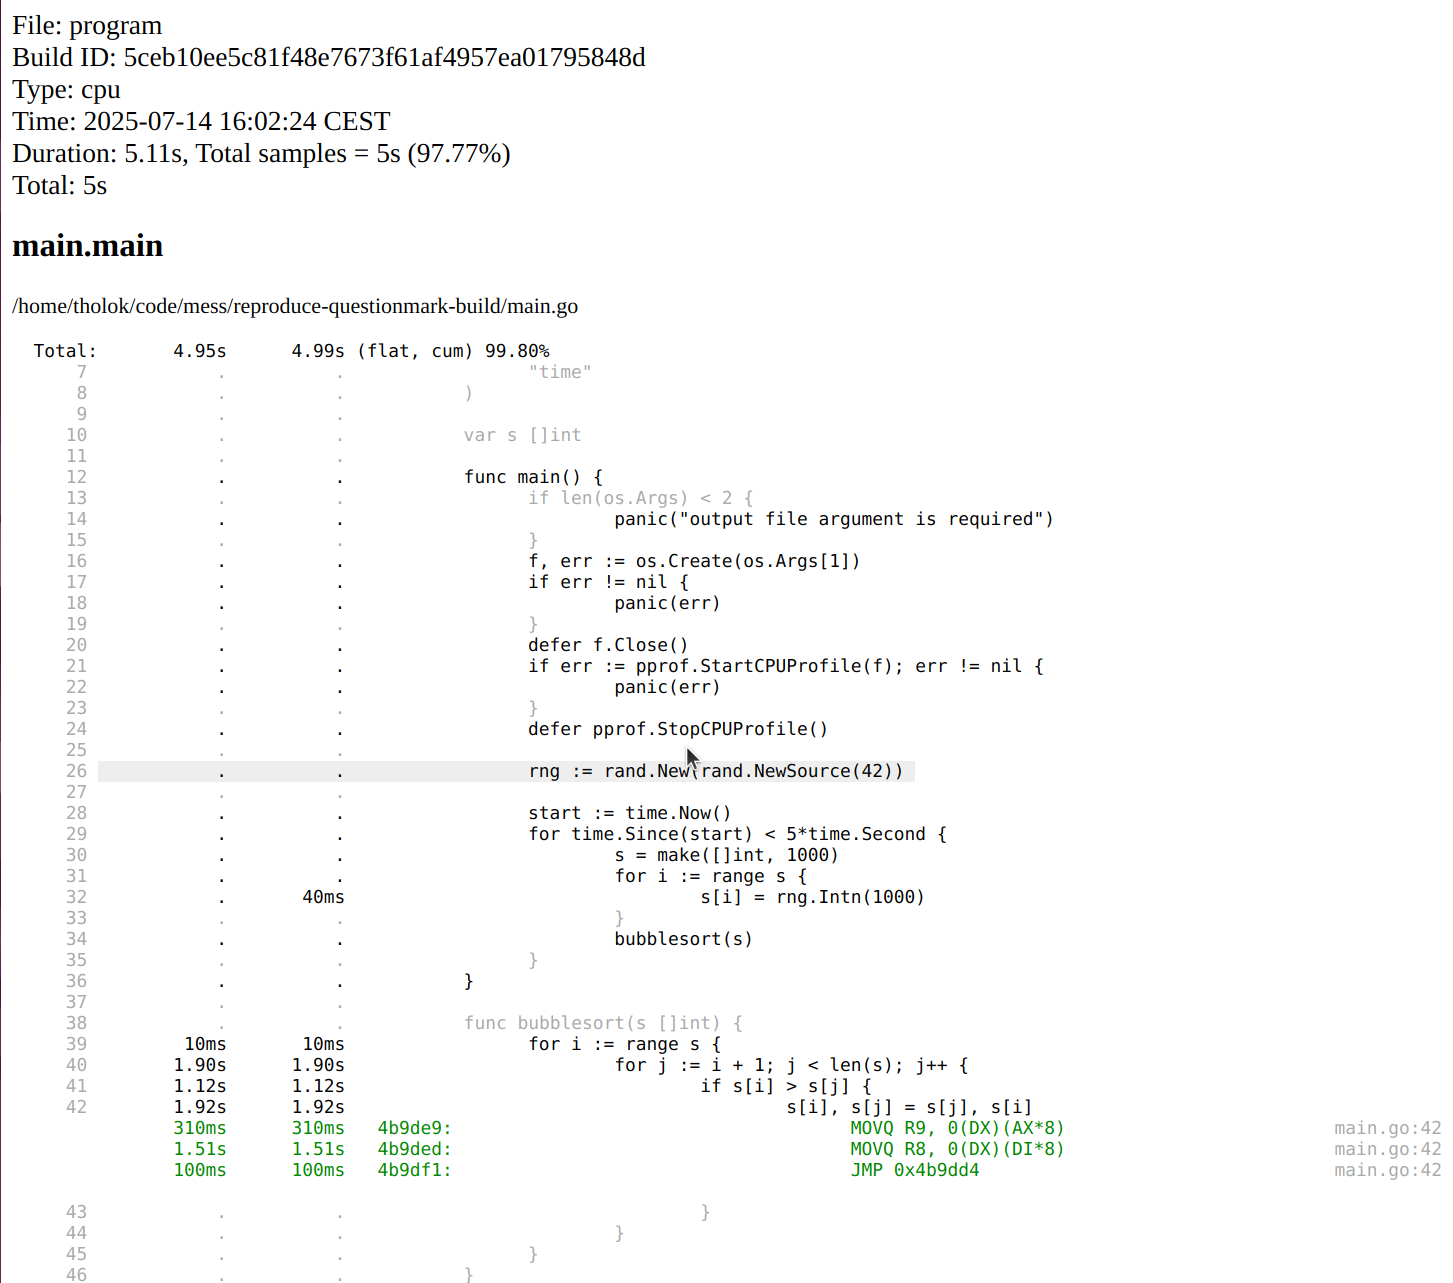
I expect pprof weblist to show me relevant assembly instructions when clicking on annotated code, like this screenshot from the repository linked above:
What did you see instead?
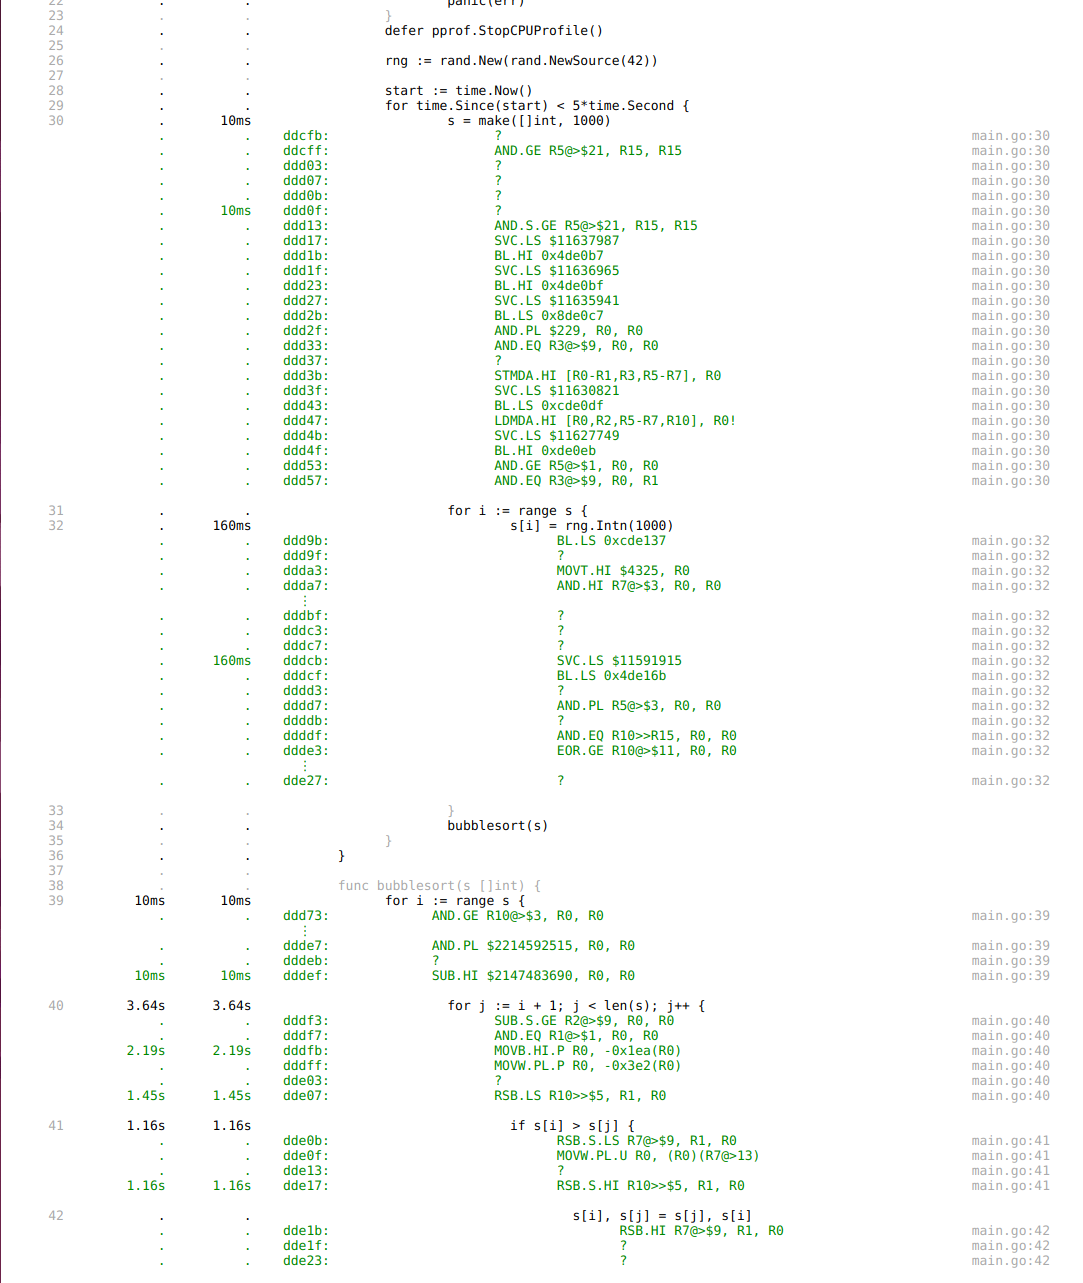
Instead I see irrelevant instructions and question marks, like this screenshot from the repository linked above:
Comment From: tholok97
Slack thread in performance channel of Gophers Slack about this: https://gophers.slack.com/archives/C0VP8EF3R/p1752488618013959
Comment From: seankhliao
the pprof issue tracker is at https://github.com/google/pprof
Comment From: cherrymui
These PCs are weird. On ARM, instructions are 4-byte aligned, so PCs should be multiple of 4. But these PCs are mostly odd numbers. If pprof starts decoding an instruction at an odd address, it is not the start of an instruction so it will decode to weird things. It seems pprof sometimes got it right, even with odd PCs, but sometimes not. I can also reproduce on ARM64 (where PCs should also be 4-byte aligned) (without cross compilation).
I think there are two issues: 1. Why the profile record weird PCs. It might have something to do with we subtracting 1 from PCs to get "call PC" from "return PC"? 2. Why the pprof command sometimes got it right even if PCs are weird.
Comment From: egonelbre
For the 2. question, I'm guessing that disasm tooling that pprof calls can better handle the incorrect PC-s. From debugging, pprof calls the Disasm func with start: 0xdda77 on both the Go and the upstream version.
https://github.com/google/pprof/blob/6e76a2b096b5fa52e4bb3f7f7a357bd6e6b3b7b1/internal/binutils/binutils.go#L259
Maybe llvm objdump cross-checks against line numbers or something, i.e finds first PC value that has a line number?
Comment From: prattmic
the pprof issue tracker is at https://github.com/google/pprof
cmd/pprof has its own disassembly implementation, so I could see this being a bug in either upstream pprof or just cmd/pprof: https://github.com/golang/go/blob/9159cd4ec6b0e9475dc9c71c830035c1c4c13483/src/cmd/pprof/pprof.go#L191
Comment From: egonelbre
After debugging a bit, it looks like that go tool objdump properly disassembles and the code difference seems to be how it handles calling Decode.
In objdump there's this code https://github.com/golang/go/blob/master/src/cmd/internal/disasm/disasm.go#L221:
for _, sym := range d.syms {
    symStart := sym.Addr
    symEnd := sym.Addr + uint64(sym.Size)
    relocs := sym.Relocs
    if ... ||
        symEnd <= start || end <= symStart ||
        ... {
        continue
    }

    ...

    d.Decode(symStart, symEnd, relocs, gnuAsm, func(pc, size uint64, file string, line int, text string) {
Whereas pprof disasm https://github.com/golang/go/blob/bb07e55aff3041032ac8c851f4fefbd038783240/src/cmd/pprof/pprof.go#L200 calls Decode directly with:
d.Decode(start, end, nil, false, func(pc, size uint64, file string, line int, text string) {
So it doesn't care whether start and end point to the correct start/end position of a symbol. And the start address in pprof profile is not a correct symbol start location.
Comment From: gopherbot
Change https://go.dev/cl/688955 mentions this issue: cmd/pprof: respect symbol boundaries during Disasm