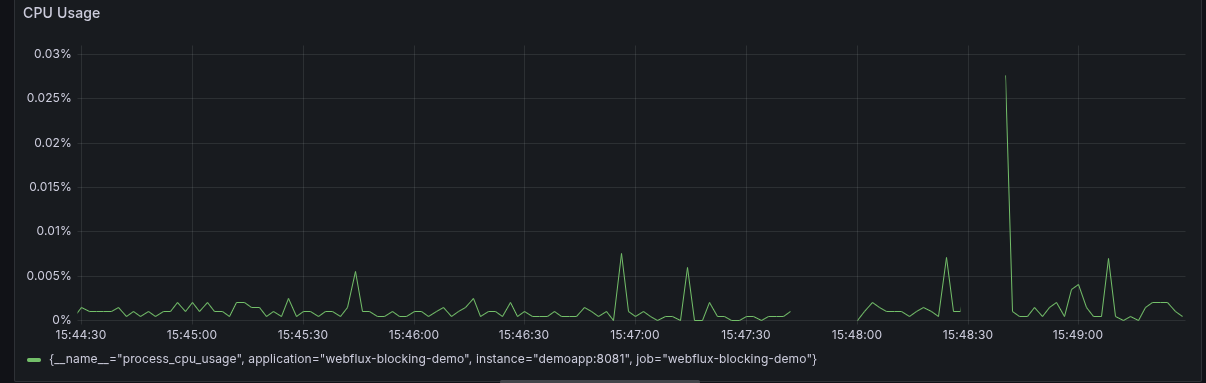
During a high-throughput usage of one of our endpoints, we noticed that our metrics were failing to be scraped. The actual scenario then looks something like this:
After some deeper analysis, we found out that this is due to the fact that in Webflux, a high-throughput endpoint could potentially bottleneck the event loop and cause many other endpoints - including /actuator/**, to fail to be processed in time or at all. This is made worse if the Webflux call erroneously contains a blocking call (e.g. a JPA call) which is not offloaded to a bounded scheduler.
Interestingly, the first indicator that this was happening was an AbortedException:
AbortedException: Connection has been closed BEFORE send operation
r.n.c.AbortedException: Connection has been closed BEFORE send operation
    at r.n.c.AbortedException.beforeSend(AbortedException.java:59)
    Suppressed: r.c.p.FluxOnAssembly$OnAssemblyException:
Error has been observed at the following site(s):
    *__checkpoint ⇢ Handler Actuator web endpoint 'prometheus' [DispatcherHandler]
Original Stack Trace:
        at r.n.c.AbortedException.beforeSend(AbortedException.java:59)
        at r.n.h.s.HttpServerOperations.then(HttpServerOperations.java:685)
        at r.n.ReactorNetty$OutboundThen.<init>(ReactorNetty.java:750)
        at r.n.ReactorNetty$OutboundThen.<init>(ReactorNetty.java:739)
        at r.n.NettyOutbound.then(NettyOutbound.java:358)
        at r.n.h.s.HttpServerOperations.send(HttpServerOperations.java:544)
        at o.s.h.s.r.ReactorServerHttpResponse.writeWithInternal(ReactorServerHttpResponse.java:96)
        at o.s.h.s.r.AbstractServerHttpResponse.lambda$writeWith$2(AbstractServerHttpResponse.java:183)
        at o.s.h.s.r.AbstractServerHttpResponse.doCommit(AbstractServerHttpResponse.java:259)
        at o.s.h.s.r.AbstractServerHttpResponse.lambda$writeWith$5(AbstractServerHttpResponse.java:180)
        at r.c.p.MonoFlatMap$FlatMapMain.onNext(MonoFlatMap.java:132)
        at r.c.p.FluxContextWrite$ContextWriteSubscriber.onNext(FluxContextWrite.java:107)
        at r.c.p.Operators$ScalarSubscription.request(Operators.java:2570)
        at r.c.p.FluxContextWrite$ContextWriteSubscriber.request(FluxContextWrite.java:136)
        at r.c.p.MonoFlatMap$FlatMapMain.request(MonoFlatMap.java:194)
        at r.c.p.MonoPeekTerminal$MonoTerminalPeekSubscriber.request(MonoPeekTerminal.java:139)
        at r.c.p.FluxContextWrite$ContextWriteSubscriber.request(FluxContextWrite.java:136)
        at r.c.p.MonoFlatMap$FlatMapInner.onSubscribe(MonoFlatMap.java:291)
        at r.c.p.FluxContextWrite$ContextWriteSubscriber.onSubscribe(FluxContextWrite.java:101)
        at r.c.p.MonoPeekTerminal$MonoTerminalPeekSubscriber.onSubscribe(MonoPeekTerminal.java:152)
        at r.c.p.MonoFlatMap$FlatMapMain.onSubscribe(MonoFlatMap.java:117)
        at r.c.p.FluxContextWrite$ContextWriteSubscriber.onSubscribe(FluxContextWrite.java:101)
        at r.c.p.MonoJust.subscribe(MonoJust.java:55)
        at r.c.p.InternalMonoOperator.subscribe(InternalMonoOperator.java:76)
        at r.c.p.MonoFlatMap$FlatMapMain.onNext(MonoFlatMap.java:165)
        at r.c.p.FluxSwitchIfEmpty$SwitchIfEmptySubscriber.onNext(FluxSwitchIfEmpty.java:74)
        at r.c.p.Operators$MonoInnerProducerBase.complete(Operators.java:2864)
        at r.c.p.MonoSingle$SingleSubscriber.onComplete(MonoSingle.java:180)
        at r.c.p.FluxMapFuseable$MapFuseableSubscriber.onComplete(FluxMapFuseable.java:152)
        at r.c.p.Operators$ScalarSubscription.request(Operators.java:2572)
        at r.c.p.FluxMapFuseable$MapFuseableSubscriber.request(FluxMapFuseable.java:171)
        at r.c.p.MonoSingle$SingleSubscriber.doOnRequest(MonoSingle.java:103)
        at r.c.p.Operators$MonoInnerProducerBase.request(Operators.java:2931)
        at r.c.p.Operators$MultiSubscriptionSubscriber.set(Operators.java:2366)
        at r.c.p.Operators$MultiSubscriptionSubscriber.onSubscribe(Operators.java:2240)
        at r.c.p.MonoSingle$SingleSubscriber.onSubscribe(MonoSingle.java:115)
        at r.c.p.FluxMapFuseable$MapFuseableSubscriber.onSubscribe(FluxMapFuseable.java:96)
        at r.c.p.FluxJust.subscribe(FluxJust.java:68)
        at r.c.p.InternalMonoOperator.subscribe(InternalMonoOperator.java:76)
        at r.c.p.MonoFlatMap$FlatMapMain.onNext(MonoFlatMap.java:165)
        ... 14 frames truncated
which it seems was Prometheus trying to call the /actuator/prometheus endpoint, hitting some timeout, and cancelling the request.
What made this even harder to debug was the following log message from the org.springframework.web.server.adapter.HttpWebHandlerAdapter:
[4728cf52-74336] Error [org.springframework.http.converter.HttpMessageNotWritableException: No Encoder for [com.acme.error.handling.ErrorResponse] with preset Content-Type 'application/openmetrics-text;version=1.0.0;charset=utf-8'] for HTTP GET "/actuator/prometheus", but ServerHttpResponse already committed (200 OK)
(note: com.acme.error.handling.ErrorResponse is our own GlobalExceptionHandler trying to wrap the response error)
which is understandable given the above exception, although the logged response code (200 OK) seems a bit iffy.
While debugging this, we found out that we used the same server.port as well as management.server.port. According to the docs, setting an explicit management.server.port different from server.port should start a separate Netty which manages its own threadpool to protect against such use cases. Indeed, setting:
server.port: 8080
management.server.port: 8081
seems to do so:
2025-07-24T13:47:58.622Z  INFO 1 --- [           main] o.s.b.web.embedded.netty.NettyWebServer  : Netty started on port 8080
2025-07-24T13:47:58.660Z  INFO 1 --- [           main] o.s.b.a.e.web.EndpointLinksResolver      : Exposing 14 endpoint(s) beneath base path '/actuator'
2025-07-24T13:47:58.682Z  INFO 1 --- [           main] o.s.b.web.embedded.netty.NettyWebServer  : Netty started on port 8081
However, addressing this Netty:
does not solve the problem. In fact, reducing the standard Reactor Threadpool sizes, using e.g. JAVA_TOOL_OPTIONS=-Dreactor.schedulers.defaultPoolSize=4 -Dreactor.schedulers.defaultBoundedElasticSize=4 -Dreactor.schedulers.defaultBoundedElasticQueueSize=10
makes it relatively easy to reproduce an error like the following:
Test
2025-07-24T13:48:28.293Z ERROR 1 --- [or-http-epoll-3] a.w.r.e.AbstractErrorWebExceptionHandler : [c6475471-269]  500 Server Error for HTTP GET "/actuator/prometheus"
2025-07-24T13:48:28.310912574Z
2025-07-24T13:48:28.310918808Z reactor.core.Exceptions$ReactorRejectedExecutionException: Task capacity of bounded elastic scheduler reached while scheduling 1 tasks (11/10)
2025-07-24T13:48:28.310923097Z  at reactor.core.Exceptions.failWithRejected(Exceptions.java:293) ~[reactor-core-3.5.6.jar!/:3.5.6]
2025-07-24T13:48:28.310926836Z  Suppressed: reactor.core.publisher.FluxOnAssembly$OnAssemblyException:
2025-07-24T13:48:28.310930136Z Error has been observed at the following site(s):
2025-07-24T13:48:28.310933355Z  *__checkpoint ⇢ Handler org.springframework.boot.actuate.endpoint.web.reactive.AbstractWebFluxEndpointHandlerMapping$ReadOperationHandler#handle(ServerWebExchange) [DispatcherHandler]
2025-07-24T13:48:28.310938710Z  *__checkpoint ⇢ org.springframework.web.filter.reactive.ServerHttpObservationFilter [DefaultWebFilterChain]
2025-07-24T13:48:28.310942459Z  *__checkpoint ⇢ HTTP GET "/actuator/prometheus" [ExceptionHandlingWebHandler]
2025-07-24T13:48:28.310946021Z Original Stack Trace:
2025-07-24T13:48:28.310949246Z      at reactor.core.Exceptions.failWithRejected(Exceptions.java:293) ~[reactor-core-3.5.6.jar!/:3.5.6]
2025-07-24T13:48:28.310952578Z      at reactor.core.scheduler.BoundedElasticScheduler$BoundedScheduledExecutorService.ensureQueueCapacity(BoundedElasticScheduler.java:922) ~[reactor-core-3.5.6.jar!/:3.5.6]
2025-07-24T13:48:28.310967825Z      at reactor.core.scheduler.BoundedElasticScheduler$BoundedScheduledExecutorService.submit(BoundedElasticScheduler.java:1022) ~[reactor-core-3.5.6.jar!/:3.5.6]
2025-07-24T13:48:28.310971149Z      at io.micrometer.core.instrument.internal.TimedScheduledExecutorService.submit(TimedScheduledExecutorService.java:85) ~[micrometer-core-1.11.0.jar!/:1.11.0]
2025-07-24T13:48:28.310973763Z      at reactor.core.scheduler.DelegatingScheduledExecutorService.submit(DelegatingScheduledExecutorService.java:84) ~[reactor-core-3.5.6.jar!/:3.5.6]
2025-07-24T13:48:28.310976424Z      at reactor.core.scheduler.Schedulers.directSchedule(Schedulers.java:1244) ~[reactor-core-3.5.6.jar!/:3.5.6]
2025-07-24T13:48:28.310978942Z      at reactor.core.scheduler.BoundedElasticScheduler.schedule(BoundedElasticScheduler.java:304) ~[reactor-core-3.5.6.jar!/:3.5.6]
2025-07-24T13:48:28.310981366Z      at reactor.core.scheduler.Schedulers$CachedScheduler.schedule(Schedulers.java:1163) ~[reactor-core-3.5.6.jar!/:3.5.6]
2025-07-24T13:48:28.310984892Z      at reactor.core.publisher.MonoSubscribeOnCallable.subscribe(MonoSubscribeOnCallable.java:52) ~[reactor-core-3.5.6.jar!/:3.5.6]
2025-07-24T13:48:28.310988045Z      at reactor.core.publisher.InternalMonoOperator.subscribe(InternalMonoOperator.java:64) ~[reactor-core-3.5.6.jar!/:3.5.6]
2025-07-24T13:48:28.310990569Z      at reactor.core.publisher.MonoFlatMap$FlatMapMain.onNext(MonoFlatMap.java:165) ~[reactor-core-3.5.6.jar!/:3.5.6]
2025-07-24T13:48:28.310993206Z      at reactor.core.publisher.FluxMapFuseable$MapFuseableSubscriber.onNext(FluxMapFuseable.java:129) ~[reactor-core-3.5.6.jar!/:3.5.6]
2025-07-24T13:48:28.310995652Z      at reactor.core.publisher.Operators$ScalarSubscription.request(Operators.java:2545) ~[reactor-core-3.5.6.jar!/:3.5.6]
2025-07-24T13:48:28.310998141Z      at reactor.core.publisher.FluxMapFuseable$MapFuseableSubscriber.request(FluxMapFuseable.java:171) ~[reactor-core-3.5.6.jar!/:3.5.6]
2025-07-24T13:48:28.311000808Z      at reactor.core.publisher.MonoFlatMap$FlatMapMain.request(MonoFlatMap.java:194) ~[reactor-core-3.5.6.jar!/:3.5.6]
2025-07-24T13:48:28.311003469Z      at reactor.core.publisher.MonoFlatMap$FlatMapMain.request(MonoFlatMap.java:194) ~[reactor-core-3.5.6.jar!/:3.5.6]
2025-07-24T13:48:28.311005829Z      at reactor.core.publisher.Operators$MultiSubscriptionSubscriber.set(Operators.java:2341) ~[reactor-core-3.5.6.jar!/:3.5.6]
2025-07-24T13:48:28.311008374Z      at reactor.core.publisher.FluxOnErrorResume$ResumeSubscriber.onSubscribe(FluxOnErrorResume.java:74) ~[reactor-core-3.5.6.jar!/:3.5.6]
2025-07-24T13:48:28.311010813Z      at reactor.core.publisher.MonoFlatMap$FlatMapMain.onSubscribe(MonoFlatMap.java:117) ~[reactor-core-3.5.6.jar!/:3.5.6]
2025-07-24T13:48:28.311013717Z      at reactor.core.publisher.MonoFlatMap$FlatMapMain.onSubscribe(MonoFlatMap.java:117) ~[reactor-core-3.5.6.jar!/:3.5.6]
2025-07-24T13:48:28.311016306Z      at reactor.core.publisher.FluxMapFuseable$MapFuseableSubscriber.onSubscribe(FluxMapFuseable.java:96) ~[reactor-core-3.5.6.jar!/:3.5.6]
2025-07-24T13:48:28.311018988Z      at reactor.core.publisher.MonoJust.subscribe(MonoJust.java:55) ~[reactor-core-3.5.6.jar!/:3.5.6]
2025-07-24T13:48:28.311025846Z      at reactor.core.publisher.InternalMonoOperator.subscribe(InternalMonoOperator.java:64) ~[reactor-core-3.5.6.jar!/:3.5.6]
2025-07-24T13:48:28.311029219Z      at reactor.core.publisher.MonoFlatMap$FlatMapMain.onNext(MonoFlatMap.java:165) ~[reactor-core-3.5.6.jar!/:3.5.6]
2025-07-24T13:48:28.311032370Z      at reactor.core.publisher.FluxOnErrorResume$ResumeSubscriber.onNext(FluxOnErrorResume.java:79) ~[reactor-core-3.5.6.jar!/:3.5.6]
2025-07-24T13:48:28.311034961Z      at reactor.core.publisher.FluxPeek$PeekSubscriber.onNext(FluxPeek.java:200) ~[reactor-core-3.5.6.jar!/:3.5.6]
2025-07-24T13:48:28.311037318Z      at reactor.core.publisher.FluxPeek$PeekSubscriber.onNext(FluxPeek.java:200) ~[reactor-core-3.5.6.jar!/:3.5.6]
2025-07-24T13:48:28.311039652Z      at reactor.core.publisher.MonoIgnoreThen$ThenIgnoreMain.complete(MonoIgnoreThen.java:292) ~[reactor-core-3.5.6.jar!/:3.5.6]
2025-07-24T13:48:28.311042683Z      at reactor.core.publisher.MonoIgnoreThen$ThenIgnoreMain.onNext(MonoIgnoreThen.java:187) ~[reactor-core-3.5.6.jar!/:3.5.6]
2025-07-24T13:48:28.311045319Z      at reactor.core.publisher.MonoFlatMap$FlatMapMain.onNext(MonoFlatMap.java:158) ~[reactor-core-3.5.6.jar!/:3.5.6]
2025-07-24T13:48:28.311048008Z      at reactor.core.publisher.MonoZip$ZipCoordinator.signal(MonoZip.java:293) ~[reactor-core-3.5.6.jar!/:3.5.6]
2025-07-24T13:48:28.311050758Z      at reactor.core.publisher.MonoZip$ZipInner.onNext(MonoZip.java:474) ~[reactor-core-3.5.6.jar!/:3.5.6]
2025-07-24T13:48:28.311053379Z      at reactor.core.publisher.MonoPeekTerminal$MonoTerminalPeekSubscriber.onNext(MonoPeekTerminal.java:180) ~[reactor-core-3.5.6.jar!/:3.5.6]
2025-07-24T13:48:28.311055908Z      at reactor.core.publisher.Operators$ScalarSubscription.request(Operators.java:2545) ~[reactor-core-3.5.6.jar!/:3.5.6]
2025-07-24T13:48:28.311058402Z      at reactor.core.publisher.MonoPeekTerminal$MonoTerminalPeekSubscriber.request(MonoPeekTerminal.java:139) ~[reactor-core-3.5.6.jar!/:3.5.6]
2025-07-24T13:48:28.311060865Z      at reactor.core.publisher.MonoZip$ZipInner.onSubscribe(MonoZip.java:466) ~[reactor-core-3.5.6.jar!/:3.5.6]
2025-07-24T13:48:28.311064703Z      at reactor.core.publisher.MonoPeekTerminal$MonoTerminalPeekSubscriber.onSubscribe(MonoPeekTerminal.java:152) ~[reactor-core-3.5.6.jar!/:3.5.6]
2025-07-24T13:48:28.311067310Z      at reactor.core.publisher.MonoJust.subscribe(MonoJust.java:55) ~[reactor-core-3.5.6.jar!/:3.5.6]
2025-07-24T13:48:28.311069869Z      at reactor.core.publisher.InternalMonoOperator.subscribe(InternalMonoOperator.java:64) ~[reactor-core-3.5.6.jar!/:3.5.6]
2025-07-24T13:48:28.311072226Z      at reactor.core.publisher.MonoZip$ZipCoordinator.request(MonoZip.java:216) ~[reactor-core-3.5.6.jar!/:3.5.6]
2025-07-24T13:48:28.311074567Z      at reactor.core.publisher.MonoFlatMap$FlatMapMain.request(MonoFlatMap.java:194) ~[reactor-core-3.5.6.jar!/:3.5.6]
2025-07-24T13:48:28.311077649Z      at reactor.core.publisher.MonoIgnoreThen$ThenIgnoreMain.onSubscribe(MonoIgnoreThen.java:134) ~[reactor-core-3.5.6.jar!/:3.5.6]
2025-07-24T13:48:28.311083407Z      at reactor.core.publisher.MonoFlatMap$FlatMapMain.onSubscribe(MonoFlatMap.java:117) ~[reactor-core-3.5.6.jar!/:3.5.6]
2025-07-24T13:48:28.311086382Z      at reactor.core.publisher.MonoZip.subscribe(MonoZip.java:125) ~[reactor-core-3.5.6.jar!/:3.5.6]
2025-07-24T13:48:28.311088862Z      at reactor.core.publisher.InternalMonoOperator.subscribe(InternalMonoOperator.java:64) ~[reactor-core-3.5.6.jar!/:3.5.6]
2025-07-24T13:48:28.311091365Z      at reactor.core.publisher.MonoDefer.subscribe(MonoDefer.java:52) ~[reactor-core-3.5.6.jar!/:3.5.6]
2025-07-24T13:48:28.311093732Z      at reactor.core.publisher.MonoIgnoreThen$ThenIgnoreMain.subscribeNext(MonoIgnoreThen.java:240) ~[reactor-core-3.5.6.jar!/:3.5.6]
2025-07-24T13:48:28.311096230Z      at reactor.core.publisher.MonoIgnoreThen$ThenIgnoreMain.onComplete(MonoIgnoreThen.java:203) ~[reactor-core-3.5.6.jar!/:3.5.6]
2025-07-24T13:48:28.311098592Z      at reactor.core.publisher.MonoFlatMap$FlatMapMain.onComplete(MonoFlatMap.java:189) ~[reactor-core-3.5.6.jar!/:3.5.6]
2025-07-24T13:48:28.311100958Z      at reactor.core.publisher.Operators.complete(Operators.java:137) ~[reactor-core-3.5.6.jar!/:3.5.6]
2025-07-24T13:48:28.311103397Z      at reactor.core.publisher.MonoZip.subscribe(MonoZip.java:121) ~[reactor-core-3.5.6.jar!/:3.5.6]
2025-07-24T13:48:28.311105897Z      at reactor.core.publisher.Mono.subscribe(Mono.java:4485) ~[reactor-core-3.5.6.jar!/:3.5.6]
2025-07-24T13:48:28.311108353Z      at reactor.core.publisher.MonoIgnoreThen$ThenIgnoreMain.subscribeNext(MonoIgnoreThen.java:263) ~[reactor-core-3.5.6.jar!/:3.5.6]
2025-07-24T13:48:28.311110738Z      at reactor.core.publisher.MonoIgnoreThen.subscribe(MonoIgnoreThen.java:51) ~[reactor-core-3.5.6.jar!/:3.5.6]
2025-07-24T13:48:28.311113103Z      at reactor.core.publisher.InternalMonoOperator.subscribe(InternalMonoOperator.java:64) ~[reactor-core-3.5.6.jar!/:3.5.6]
2025-07-24T13:48:28.311115534Z      at reactor.core.publisher.MonoFlatMap$FlatMapMain.onNext(MonoFlatMap.java:165) ~[reactor-core-3.5.6.jar!/:3.5.6]
2025-07-24T13:48:28.311117887Z      at reactor.core.publisher.FluxOnErrorResume$ResumeSubscriber.onNext(FluxOnErrorResume.java:79) ~[reactor-core-3.5.6.jar!/:3.5.6]
2025-07-24T13:48:28.311120466Z      at reactor.core.publisher.FluxSwitchIfEmpty$SwitchIfEmptySubscriber.onNext(FluxSwitchIfEmpty.java:74) ~[reactor-core-3.5.6.jar!/:3.5.6]
2025-07-24T13:48:28.311122960Z      at reactor.core.publisher.MonoNext$NextSubscriber.onNext(MonoNext.java:82) ~[reactor-core-3.5.6.jar!/:3.5.6]
2025-07-24T13:48:28.311125762Z      at reactor.core.publisher.FluxConcatMapNoPrefetch$FluxConcatMapNoPrefetchSubscriber.innerNext(FluxConcatMapNoPrefetch.java:258) ~[reactor-core-3.5.6.jar!/:3.5.6]
2025-07-24T13:48:28.311128424Z      at reactor.core.publisher.FluxConcatMap$ConcatMapInner.onNext(FluxConcatMap.java:863) ~[reactor-core-3.5.6.jar!/:3.5.6]
2025-07-24T13:48:28.311130878Z      at reactor.core.publisher.FluxMapFuseable$MapFuseableSubscriber.onNext(FluxMapFuseable.java:129) ~[reactor-core-3.5.6.jar!/:3.5.6]
2025-07-24T13:48:28.311133899Z      at reactor.core.publisher.MonoPeekTerminal$MonoTerminalPeekSubscriber.onNext(MonoPeekTerminal.java:180) ~[reactor-core-3.5.6.jar!/:3.5.6]
2025-07-24T13:48:28.311139036Z      at reactor.core.publisher.Operators$ScalarSubscription.request(Operators.java:2545) ~[reactor-core-3.5.6.jar!/:3.5.6]
2025-07-24T13:48:28.311141672Z      at reactor.core.publisher.MonoPeekTerminal$MonoTerminalPeekSubscriber.request(MonoPeekTerminal.java:139) ~[reactor-core-3.5.6.jar!/:3.5.6]
2025-07-24T13:48:28.311144040Z      at reactor.core.publisher.FluxMapFuseable$MapFuseableSubscriber.request(FluxMapFuseable.java:171) ~[reactor-core-3.5.6.jar!/:3.5.6]
2025-07-24T13:48:28.311146438Z      at reactor.core.publisher.Operators$MultiSubscriptionSubscriber.request(Operators.java:2305) ~[reactor-core-3.5.6.jar!/:3.5.6]
2025-07-24T13:48:28.311148971Z      at reactor.core.publisher.FluxConcatMapNoPrefetch$FluxConcatMapNoPrefetchSubscriber.request(FluxConcatMapNoPrefetch.java:338) ~[reactor-core-3.5.6.jar!/:3.5.6]
2025-07-24T13:48:28.311151631Z      at reactor.core.publisher.MonoNext$NextSubscriber.request(MonoNext.java:108) ~[reactor-core-3.5.6.jar!/:3.5.6]
2025-07-24T13:48:28.311154081Z      at reactor.core.publisher.Operators$MultiSubscriptionSubscriber.set(Operators.java:2341) ~[reactor-core-3.5.6.jar!/:3.5.6]
2025-07-24T13:48:28.311156523Z      at reactor.core.publisher.Operators$MultiSubscriptionSubscriber.onSubscribe(Operators.java:2215) ~[reactor-core-3.5.6.jar!/:3.5.6]
2025-07-24T13:48:28.311158896Z      at reactor.core.publisher.MonoNext$NextSubscriber.onSubscribe(MonoNext.java:70) ~[reactor-core-3.5.6.jar!/:3.5.6]
2025-07-24T13:48:28.311161282Z      at reactor.core.publisher.FluxConcatMapNoPrefetch$FluxConcatMapNoPrefetchSubscriber.onSubscribe(FluxConcatMapNoPrefetch.java:164) ~[reactor-core-3.5.6.jar!/:3.5.6]
2025-07-24T13:48:28.311163833Z      at reactor.core.publisher.FluxIterable.subscribe(FluxIterable.java:201) ~[reactor-core-3.5.6.jar!/:3.5.6]
2025-07-24T13:48:28.311166542Z      at reactor.core.publisher.FluxIterable.subscribe(FluxIterable.java:83) ~[reactor-core-3.5.6.jar!/:3.5.6]
2025-07-24T13:48:28.311168922Z      at reactor.core.publisher.InternalMonoOperator.subscribe(InternalMonoOperator.java:64) ~[reactor-core-3.5.6.jar!/:3.5.6]
2025-07-24T13:48:28.311171420Z      at reactor.core.publisher.MonoDefer.subscribe(MonoDefer.java:52) ~[reactor-core-3.5.6.jar!/:3.5.6]
2025-07-24T13:48:28.311173894Z      at reactor.core.publisher.InternalMonoOperator.subscribe(InternalMonoOperator.java:64) ~[reactor-core-3.5.6.jar!/:3.5.6]
2025-07-24T13:48:28.311176263Z      at reactor.core.publisher.MonoDefer.subscribe(MonoDefer.java:52) ~[reactor-core-3.5.6.jar!/:3.5.6]
2025-07-24T13:48:28.311178550Z      at reactor.core.publisher.InternalMonoOperator.subscribe(InternalMonoOperator.java:64) ~[reactor-core-3.5.6.jar!/:3.5.6]
2025-07-24T13:48:28.311180915Z      at reactor.core.publisher.MonoDefer.subscribe(MonoDefer.java:52) ~[reactor-core-3.5.6.jar!/:3.5.6]
2025-07-24T13:48:28.311183351Z      at reactor.core.publisher.Mono.subscribe(Mono.java:4485) ~[reactor-core-3.5.6.jar!/:3.5.6]
2025-07-24T13:48:28.311185599Z      at reactor.core.publisher.MonoIgnoreThen$ThenIgnoreMain.subscribeNext(MonoIgnoreThen.java:263) ~[reactor-core-3.5.6.jar!/:3.5.6]
2025-07-24T13:48:28.311190533Z      at reactor.core.publisher.MonoIgnoreThen.subscribe(MonoIgnoreThen.java:51) ~[reactor-core-3.5.6.jar!/:3.5.6]
2025-07-24T13:48:28.311193200Z      at reactor.core.publisher.InternalMonoOperator.subscribe(InternalMonoOperator.java:64) ~[reactor-core-3.5.6.jar!/:3.5.6]
2025-07-24T13:48:28.311195794Z      at reactor.core.publisher.MonoDeferContextual.subscribe(MonoDeferContextual.java:55) ~[reactor-core-3.5.6.jar!/:3.5.6]
2025-07-24T13:48:28.311198204Z      at reactor.netty.http.server.HttpServer$HttpServerHandle.onStateChange(HttpServer.java:1006) ~[reactor-netty-http-1.1.7.jar!/:1.1.7]
2025-07-24T13:48:28.311200611Z      at reactor.netty.ReactorNetty$CompositeConnectionObserver.onStateChange(ReactorNetty.java:710) ~[reactor-netty-core-1.1.7.jar!/:1.1.7]
2025-07-24T13:48:28.311203067Z      at reactor.netty.transport.ServerTransport$ChildObserver.onStateChange(ServerTransport.java:481) ~[reactor-netty-core-1.1.7.jar!/:1.1.7]
2025-07-24T13:48:28.311205454Z      at reactor.netty.http.server.HttpServerOperations.onInboundNext(HttpServerOperations.java:621) ~[reactor-netty-http-1.1.7.jar!/:1.1.7]
2025-07-24T13:48:28.311207829Z      at reactor.netty.channel.ChannelOperationsHandler.channelRead(ChannelOperationsHandler.java:113) ~[reactor-netty-core-1.1.7.jar!/:1.1.7]
2025-07-24T13:48:28.311210597Z      at io.netty.channel.AbstractChannelHandlerContext.invokeChannelRead(AbstractChannelHandlerContext.java:444) ~[netty-transport-4.1.92.Final.jar!/:4.1.92.Final]
2025-07-24T13:48:28.311213117Z      at io.netty.channel.AbstractChannelHandlerContext.invokeChannelRead(AbstractChannelHandlerContext.java:420) ~[netty-transport-4.1.92.Final.jar!/:4.1.92.Final]
2025-07-24T13:48:28.311215662Z      at io.netty.channel.AbstractChannelHandlerContext.fireChannelRead(AbstractChannelHandlerContext.java:412) ~[netty-transport-4.1.92.Final.jar!/:4.1.92.Final]
2025-07-24T13:48:28.311218313Z      at reactor.netty.http.server.HttpTrafficHandler.channelRead(HttpTrafficHandler.java:230) ~[reactor-netty-http-1.1.7.jar!/:1.1.7]
2025-07-24T13:48:28.311220637Z      at io.netty.channel.AbstractChannelHandlerContext.invokeChannelRead(AbstractChannelHandlerContext.java:442) ~[netty-transport-4.1.92.Final.jar!/:4.1.92.Final]
2025-07-24T13:48:28.311223030Z      at io.netty.channel.AbstractChannelHandlerContext.invokeChannelRead(AbstractChannelHandlerContext.java:420) ~[netty-transport-4.1.92.Final.jar!/:4.1.92.Final]
2025-07-24T13:48:28.311225555Z      at io.netty.channel.AbstractChannelHandlerContext.fireChannelRead(AbstractChannelHandlerContext.java:412) ~[netty-transport-4.1.92.Final.jar!/:4.1.92.Final]
2025-07-24T13:48:28.311227973Z      at io.netty.channel.CombinedChannelDuplexHandler$DelegatingChannelHandlerContext.fireChannelRead(CombinedChannelDuplexHandler.java:436) ~[netty-transport-4.1.92.Final.jar!/:4.1.92.Final]
2025-07-24T13:48:28.311230456Z      at io.netty.handler.codec.ByteToMessageDecoder.fireChannelRead(ByteToMessageDecoder.java:346) ~[netty-codec-4.1.92.Final.jar!/:4.1.92.Final]
2025-07-24T13:48:28.311232889Z      at io.netty.handler.codec.ByteToMessageDecoder.channelRead(ByteToMessageDecoder.java:318) ~[netty-codec-4.1.92.Final.jar!/:4.1.92.Final]
2025-07-24T13:48:28.311238413Z      at io.netty.channel.CombinedChannelDuplexHandler.channelRead(CombinedChannelDuplexHandler.java:251) ~[netty-transport-4.1.92.Final.jar!/:4.1.92.Final]
2025-07-24T13:48:28.311241410Z      at io.netty.channel.AbstractChannelHandlerContext.invokeChannelRead(AbstractChannelHandlerContext.java:442) ~[netty-transport-4.1.92.Final.jar!/:4.1.92.Final]
2025-07-24T13:48:28.311243923Z      at io.netty.channel.AbstractChannelHandlerContext.invokeChannelRead(AbstractChannelHandlerContext.java:420) ~[netty-transport-4.1.92.Final.jar!/:4.1.92.Final]
2025-07-24T13:48:28.311246769Z      at io.netty.channel.AbstractChannelHandlerContext.fireChannelRead(AbstractChannelHandlerContext.java:412) ~[netty-transport-4.1.92.Final.jar!/:4.1.92.Final]
2025-07-24T13:48:28.311249541Z      at io.netty.channel.DefaultChannelPipeline$HeadContext.channelRead(DefaultChannelPipeline.java:1410) ~[netty-transport-4.1.92.Final.jar!/:4.1.92.Final]
2025-07-24T13:48:28.311251964Z      at io.netty.channel.AbstractChannelHandlerContext.invokeChannelRead(AbstractChannelHandlerContext.java:440) ~[netty-transport-4.1.92.Final.jar!/:4.1.92.Final]
2025-07-24T13:48:28.311254425Z      at io.netty.channel.AbstractChannelHandlerContext.invokeChannelRead(AbstractChannelHandlerContext.java:420) ~[netty-transport-4.1.92.Final.jar!/:4.1.92.Final]
2025-07-24T13:48:28.311256933Z      at io.netty.channel.DefaultChannelPipeline.fireChannelRead(DefaultChannelPipeline.java:919) ~[netty-transport-4.1.92.Final.jar!/:4.1.92.Final]
2025-07-24T13:48:28.311259381Z      at io.netty.channel.epoll.AbstractEpollStreamChannel$EpollStreamUnsafe.epollInReady(AbstractEpollStreamChannel.java:800) ~[netty-transport-classes-epoll-4.1.92.Final.jar!/:4.1.92.Final]
2025-07-24T13:48:28.311267587Z      at io.netty.channel.epoll.EpollEventLoop.processReady(EpollEventLoop.java:499) ~[netty-transport-classes-epoll-4.1.92.Final.jar!/:4.1.92.Final]
2025-07-24T13:48:28.311275056Z      at io.netty.channel.epoll.EpollEventLoop.run(EpollEventLoop.java:397) ~[netty-transport-classes-epoll-4.1.92.Final.jar!/:4.1.92.Final]
2025-07-24T13:48:28.311278051Z      at io.netty.util.concurrent.SingleThreadEventExecutor$4.run(SingleThreadEventExecutor.java:997) ~[netty-common-4.1.92.Final.jar!/:4.1.92.Final]
2025-07-24T13:48:28.311295568Z      at io.netty.util.internal.ThreadExecutorMap$2.run(ThreadExecutorMap.java:74) ~[netty-common-4.1.92.Final.jar!/:4.1.92.Final]
2025-07-24T13:48:28.311301775Z      at io.netty.util.concurrent.FastThreadLocalRunnable.run(FastThreadLocalRunnable.java:30) ~[netty-common-4.1.92.Final.jar!/:4.1.92.Final]
2025-07-24T13:48:28.311303333Z      at java.base/java.lang.Thread.run(Thread.java:840) ~[na:na]
where the Netty running on port 8081 suffers a RejectedExecutionException while the Netty running on port 8080 is getting a lot of requests.
I haven't looked much more deeply than this at the moment, but this seems to imply that despite starting a separate Netty Server, the same Reactor schedulers and threadpools are shared (possibly the shared Schedulers.parallel() instance) as opposed to using e.g. Schedulers.newParallel(), which IMO defeats the purpose of setting the management.server.port. Somewhat obviously, scraping /actuator/prometheus content via JMX as opposed to HTTP would be the only sensible workaround that I can see at the moment. This is a rather large change for something that seems like it should already work, however.
I have created a small demo project which showcases this issue. See the included README.md and docker-compose.yaml.
Comment From: filpano
Some further analysis (included in the demo):
- Using the standard reactor threadpool (i.e. no
subscribeOn(...)with a potentially blocking call (bad practice - just for testing purposes): -> Blocks/actuator/**calls - Using the standard reactor bounded elastic (using
.subscribeOn(Schedulers.boundedElastic())): -> Blocks/actuator/**calls (somewhat surprisingly) - Using a custom bounded scheduler (using e.g.
Schedulers.newBoundedElastic(4, 10, "customScheduler")): -> Does not block/actuator/**calls.
Just to clarify, there isn't anything special about the /actuator/** calls themselves - ordinary application endpoints would themselves also potentially be bullied out of a spot in the event loop by another, high-throughput endpoint.
The issue here, IMO, is that starting a separate Netty via management.server.port and scraping /actuator/** endpoints via that Netty does not seem to prevent this.
Using a custom scheduler for high-throughput endpoints does alleviate the issue, but is only a band-aid. At the very least, it should be possible to provide a custom scheduler to be used exclusively for /actuator** calls (or rather, for the Netty running on the management.server.port).
Comment From: bclozel
Thanks for the detailed report @filpano ! I'm working on Spring Framework and Spring Boot, so hopefully I can bring an accurate perspective from both teams.
First, let me say that I'm sorry that you had to deal with such a situation. It's clearly not easy to pinpoint exactly the problem here.
Analysis
Looking at your first graph, it seems that this was produced with a sample project calling a blocking method in the middle of a reactive pipeline, on purpose, to demonstrate the problem. I assume that the production use case would look somewhat the same, except that the CPU usage should be much higher, probably around 80%? Either way, I agree that losing metrics is not ideal. As for the initial symptoms, I guess it is linked with network timeouts and connections being closed because they couldn't be processed in time. I'm not sure how we can improve the situation here, but that's something I'll think about.
According to the docs, setting an explicit management.server.port different from server.port should start a separate Netty which manages its own threadpool to protect against such use cases.
I'm not sure where this was explained in the docs, can you point me to the exact section please? I think we have something relevant in the Spring Boot docs, Kubernetes Probe section:
If your Actuator endpoints are deployed on a separate management context, the endpoints do not use the same web infrastructure (port, connection pools, framework components) as the main application. In this case, a probe check could be successful even if the main application does not work properly (for example, it cannot accept new connections). For this reason, it is a good idea to make the liveness and readiness health groups available on the main server port.
Arguably, we could improve the description here and state that in both cases (separate vs. same port) and for both Reactive/Servlet, CPU and memory resources will be shared: for WebFlux, the same event loop resources will be used and for Servlet (in virtual threads mode), the same forkjoin pool will be used.
I haven't looked much more deeply than this at the moment, but this seems to imply that despite starting a separate Netty Server, the same Reactor schedulers and threadpools are shared (possibly the shared Schedulers.parallel() instance) as opposed to using e.g. Schedulers.newParallel(), which IMO defeats the purpose of setting the management.server.port.
I'm not a Netty expert but I believe that by default request processing happens naturally on Netty's EventLoop with the configured resources in Reactor Netty. Non-blocking processing events are picked up by workers, each on its own thread. Usually resources are tailored by looking at the available resources (like CPU count on the server). You can choose to publish/subscribe work on specific Reactor Schedulers, but that's a different topic and this should be done with care.
In the Spring Boot case, starting a new Netty instance does not create a new set of resources. I think this is by design, as the goal here is to optimize as much as possible resource usage. For the same reason, resources are also shared with the WebClient at runtime.
Some further analysis (included in the demo):
I'm not really sure how to explain what you're seeing here. Maybe creating an issue on the reactor tracker would be helpful.
My intuition tells me that using Schedulers.boundedElastic() is the right one for scheduling blocking I/O operations that potentially take long. Overwhelming this solution takes a lot of queued tasks and a lot of concurrent work given the default configuration of this scheduler. On the other hand Schedulers.newBoundedElastic(4, 10, "customScheduler") is quite limited with only 4 threads and 10 tasks being queued!
Possible solutions
I have considered your proposal about separating resources for server instances in Spring Boot. I think this would have major downsides: * it is likely that each set of resources will step on the other. The main advantage of the netty event loop is to use a platform thread to its maximum on a particular CPU and avoid context switching at all costs (just like virtual threads). If not done 100% properly we will have competing threads for the same resources. * it is very hard to decide how to size those resource pools * if we manage to reserve 1 CPU out of 4 for management, your main application might be completely unresponsive while your prometheus metrics are showing CPU usage at 70%
Let's reconsider the problem under different angles. If the main issue is that the application and metrics are unresponsive when CPU usage is maxed out, I would say this is a well-known problem even for non-reactive systems. At 80% usage, things are not predictable anymore. On the other hand, if the main issue is about blocking work derailing the entire application, this is also unfortunately a well-known issue and the Reactor team built tools to detect that.
I am also wondering whether resources a properly tailored for the environment. It would be interesting to know for your production environment how many CPUs are allocated to your VM/container, how many the JVM is seeing and as a result what the Schedulers and EventLoop resources look like. That would at least explain why an under-sized bounded elastic scheduler would perform better than the default one.
I don't have concrete plans for improving this situation right now. We can certainly improve the reference docs in Spring Boot and other places (depending on where you've been looking for information).
Thanks!
Comment From: spring-projects-issues
If you would like us to look at this issue, please provide the requested information. If the information is not provided within the next 7 days this issue will be closed.
Comment From: filpano
Thank you very much for the detailed feedback @bclozel !
Looking at your first graph, it seems that this was produced with a sample project calling a blocking method in the middle of a reactive pipeline, on purpose, to demonstrate the problem. I assume that the production use case would look somewhat the same, except that the CPU usage should be much higher, probably around 80%? Either way, I agree that losing metrics is not ideal. As for the initial symptoms, I guess it is linked with network timeouts and connections being closed because they couldn't be processed in time. I'm not sure how we can improve the situation here, but that's something I'll think about.
Yes, this graph was generated by the sample project I provided in the original post. The thing I wanted to note with the graph is that this behaviour doesn't seem driven by CPU usage by itself but rather the resource starvation that occurs inside the reactor threadpools. Indeed, the "blocking" calls in the provided sample are just calling Thread.sleep(1000) to simulate something taking up a slot for a long time, but not necessarily doing anything meaningful that would drive up CPU usage.
This is supported by the fact that I have setup a very short scrape interval (~2s) - if much work was being done I'd expect the first successful scrapeafter things calm down to show a CPU usage that is bit higher, though it's certainly difficult to tell for sure.
I think we have something relevant in the Spring Boot docs, Kubernetes Probe section: [...]
Yes, this is the section I was referring to, in particular the "for example, it cannot accept new connections" section.
I'm not a Netty expert but I believe that by default request processing happens naturally on Netty's
EventLoopwith the configured resources in Reactor Netty. Non-blocking processing events are picked up by workers, each on its own thread. Usually resources are tailored by looking at the available resources (like CPU count on the server). You can choose to publish/subscribe work on specific Reactor Schedulers, but that's a different topic and this should be done with care. In the Spring Boot case, starting a new Netty instance does not create a new set of resources. I think this is by design, as the goal here is to optimize as much as possible resource usage. For the same reason, resources are also shared with theWebClientat runtime.
I see. I hadn't dived deep into NIO's Event Loops, so I was under the mistaken assumption that Netty explicitly delegates to a Reactor Scheduler somewhere - now I see that this is not the case, which makes the issue a bit more nuanced.
What is further interesting is that, it seems like the default Schedulers setting (in particular - the default number of queued tasks, 100_000) are not very well suited to a high-throughput workload regardless of actual CPU usage under the following conditions:
- More requests come in within a given time frame than can be processed
- No explicit backpressure is set up (not sure if this is possible via Netty itself?)
This is just a common backpressure issue, but it's interesting what it led to. Our initial finding that something was amiss with our service was a failing Docker health check that looks as follows:
HEALTHCHECK --interval=10s --timeout=5s --retries=30 CMD nc -z localhost 8080 && exit 0 || exit 1
which is dead simple and uses netcat to check if a port is listening. This healtcheck was failing over a period of 5m (30*10s).
I don't have the exact numbers for our initial incident on hand, but we were seeing up to ~9000 (no pun intended) open TCP connections / sockets in use at any given moment inside the containers experiencing the issue. ulimit -n is unlimited, so it seems like we definitely hit a resource starvation somewhere in the application stack.
An example from the demo project using the ss -s command also shows interesting numbers after sending about ~3000 requests in a short amount of time (with minimal worker thread counts to exacerbate the issue):
$ ss -s
TCP:   9688 (estab 2414, closed 7271, orphaned 0, timewait 0)

Transport Total     IP        IPv6
RAW       0         0         0
UDP       1         1         0
TCP       2417      1         2416
INET      2418      2         2416
FRAG      0         0         0
which shows that the "waiting" connections are queued and hold on to an open socket for the duration of the wait (makes sense).
This leads me to suspect that something like the following chain of events took place:
- Relatively high number of requests come in in a given time frame (>25/s)
- These aren't processed fast enough, so a lot end up being queued
- Clients potentially have their own timeouts, leading them to retrying the request even though they were queued
- Queue size keeps increasing due to no backpressure
- Eventually, memory pressure from all the connection allocations lead to increased GC pauses -> higher CPU usage, even though no more "meaningful" work is done past the maximum number of concurrent processing allowed
- Since the queue keeps growing, memory pressure keeps increasing until GC can't keep up; it's likely there is some GC thrashing going on at this point
- More sockets are held by incoming connections that will end up exacerbating the above symptoms
- At this point it's not unlikely that the kernel’s TCP backlog is full too
Unfortunately, due to having no metrics for the given problematic time frame, I can't back up points 5 and higher with concrete numbers other than the observed very high number of open TCP connections / sockets.
I'm not really sure how to explain what you're seeing here. Maybe creating an issue on the reactor tracker would be helpful. My intuition tells me that using
Schedulers.boundedElastic()is the right one for scheduling blocking I/O operations that potentially take long. Overwhelming this solution takes a lot of queued tasks and a lot of concurrent work given the default configuration of this scheduler. On the other handSchedulers.newBoundedElastic(4, 10, "customScheduler")is quite limited with only 4 threads and 10 tasks being queued!
I agree. The behaviour doesn't make a lot of sense to me, especially taking into account the other potential layer of resource starvation/contention above (i.e. I would have expected both boundeElastic schedulers to behave similarly). Raising an issue on the reactor tracker seems like the right call on this, thanks.
I have considered your proposal about separating resources for server instances in Spring Boot. I think this would have major downsides:
- it is likely that each set of resources will step on the other. The main advantage of the netty event loop is to use a platform thread to its maximum on a particular CPU and avoid context switching at all costs (just like virtual threads). If not done 100% properly we will have competing threads for the same resources.
- it is very hard to decide how to size those resource pools
- if we manage to reserve 1 CPU out of 4 for management, your main application might be completely unresponsive while your prometheus metrics are showing CPU usage at 70%
Let's reconsider the problem under different angles. If the main issue is that the application and metrics are unresponsive when CPU usage is maxed out, I would say this is a well-known problem even for non-reactive systems. At 80% usage, things are not predictable anymore. On the other hand, if the main issue is about blocking work derailing the entire application, this is also unfortunately a well-known issue and the Reactor team built tools to detect that.
Thanks for the clear summary. I did not know about the BlockHound tool - we'll definitely take a look.
I am also wondering whether resources a properly tailored for the environment. It would be interesting to know for your production environment how many CPUs are allocated to your VM/container, how many the JVM is seeing and as a result what the
SchedulersandEventLoopresources look like. That would at least explain why an under-sized bounded elastic scheduler would perform better than the default one.
That's a good point. The containers that encountered this issue are not very powerful:
- 1GB memory
- 1 vCPU
- -Xmx512m
so the default threadpool configurations are definitely on the limited side. What's interesting is that I've run the provided Demo project on different machines with e.g. 14 cores and no heap limitation and still observed the same behaviour (it's possible that the route it took to get there was different, but the end result was what I described above).
To sum up, I can definitely appreciate that this isn't a trivial problem to solve, and many of the default configurations have been working fine for us thus far. We might simply have gone into "needs application specific tuning" territory, and we'll do more stress testing of these components to figure out what we can do.
If any of this additional information seems like it might indicate some deeper underlying issue that we could take a better look at, that would be great. Otherwise I'll try following your suggestions and raise an issue on the Reactor Tracker re.: boundedElastic() and try out BlockHound.
Thank you!
Comment From: mateusz-nalepa
Hey @filpano @bclozel
Due to curiosity, I was just scrolling through github issues, cause recently I've opened https://github.com/spring-projects/spring-framework/issues/35302 and for me it seems, that together with @filpano we've encountered exactly same problem: Thread Pool Saturation
Looking at your scenarios:
- Using the standard reactor threadpool (i.e. no subscribeOn(...) with a potentially blocking call (bad practice - just for testing purposes): -> Blocks /actuator/** calls
- Using the standard reactor bounded elastic (using .subscribeOn(Schedulers.boundedElastic())): -> Blocks /actuator/** calls (somewhat surprisingly)
- Using a custom bounded scheduler (using e.g. Schedulers.newBoundedElastic(4, 10, "customScheduler")): -> Does not block /actuator/** calls.
Scenario 1:
- requests in UserController are executed on reactor Event Loop threads
- those requests are blocking
- that's why endpoints /actuator/** or any other endpoints are unresponsive
Scenario 2:
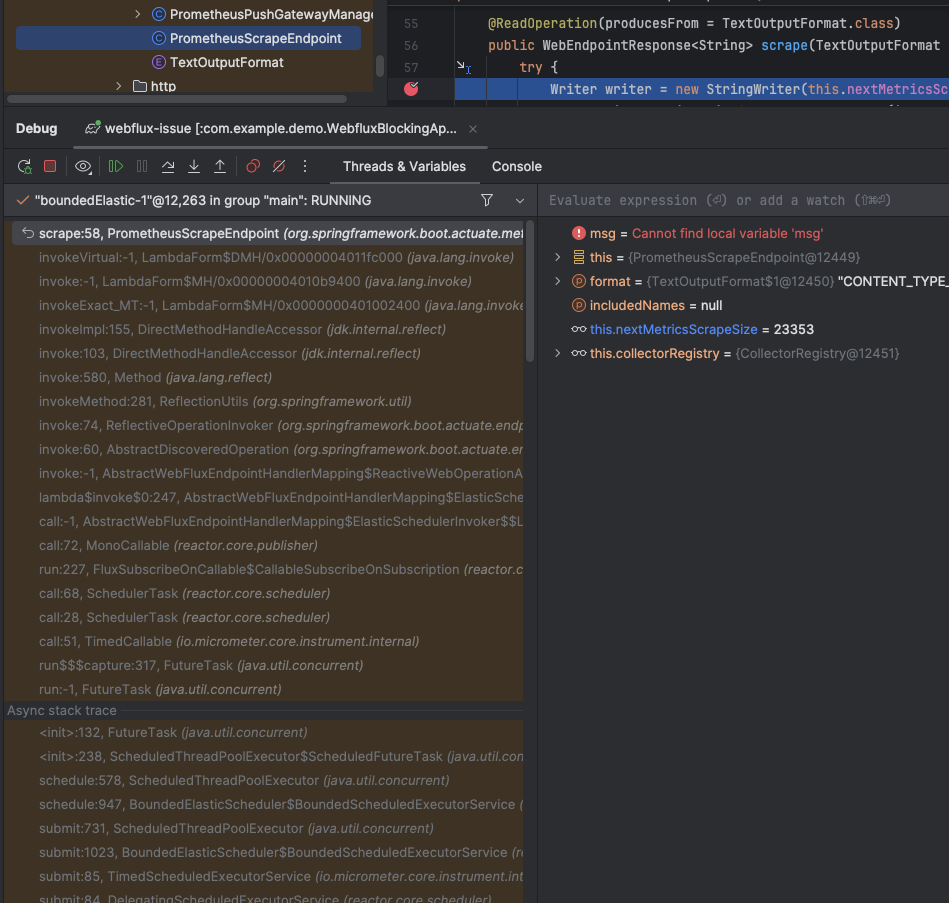
- Put a debug in PrometheusScrapeEndpoint#scrape, and you will see, that this endpoint is being executed on boundedElastic()
- please check also AbstractWebFluxEndpointHandlerMapping.ElasticSchedulerInvoker#invoke for this scenario
- Schedulers.boundedElastic() is cached, so you can use it wherever you want and thread pool will be exactly the same
- default threads number for boundedElastic() is 10 * Runtime.getRuntime().availableProcessors()
- for reference please check Schedulers#BOUNDED_ELASTIC_SUPPLIER
- when you started executing Thread.sleep() 1000 times, then as you've wrote These aren't processed fast enough, so a lot end up being queued
- so endpoints /actuator/** are unresponsive, but any other endpoints should be fine
Scenario 3:
- different thread pool used and voilà
- cpu does do a context-switch between boundedElastic() and newBoundedElastic(4, 10, "customScheduler")
- tasks from one thread pool does not affect tasks in another thread pool
So basically there are additional context-switches, but actuator endpoint or any other endpoint are responsive 🚀
Please let me know @filpano if this solves your problem
Comment From: bclozel
@filpano your latest comment makes me think that the root problem is a blocking within a reactive pipeline. The reactive runtime works with a limited number of threads and the assumption that all I/O calls are asynchronous and will not block the current thread. Typically, calling Thread.sleep() within a reactive pipeline simulates well what could very much be happening in production for you: performing blocking I/O, holding on worker threads and tasks queuing.
Even if the server characteristics are quite light (the JVM itself will take a significant amount of resources for GC and JIT compiling), what you're describing fits very well with the case above. I think testing with BlockHound is very likely to detect blocking calls.
@mateusz-nalepa same thing here, if you are performing blocking operations and those are not scheduled on a boundedElastic, things will fail. Now Spring Boot schedules some non-reactive endpoints on a bounded elastic scheduler on purpose. But we're not magically overcoming all system limitations: if the thread pool is overwhelmed (here, because there are a lot of tasks and the initial thread poll size is small, because there is a single CPU available), I'm not sure what kind of strategy we can adopt here.
Let's wait for @filpano feedback with BlockHound.
Comment From: mateusz-nalepa
@bclozel for me the issue it's still related with blocking -> waiting in a queue
Spring Boot schedules non-reactive endpoints on a boundedElastic
I've debugged the code and it seems, that it's probably only half of the truth 🤔
How /scrape endpoint is being executed:
-> there is a new request, there are data on Socket, so thread reactor-http-* read this data
-> put breakpoint here reactor.netty.http.server.HttpServerOperations#onInboundNext
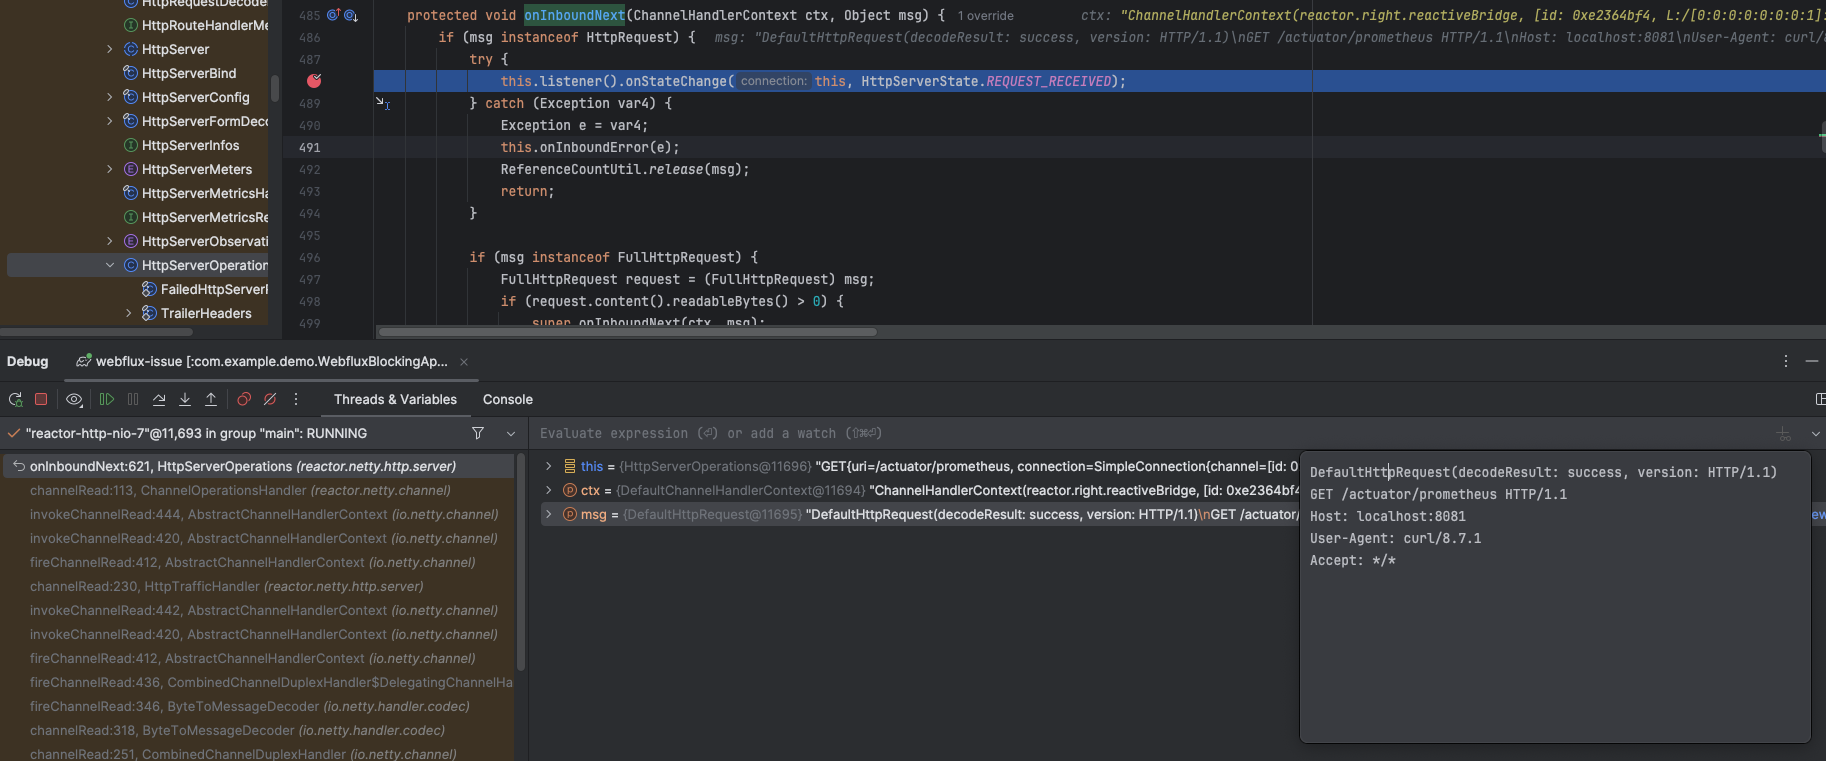
When data are present, then further processing is being done on aboundedElastic thread
Going back to scenarios provided by @filpano
- Scenario 1:
- all Thread.sleep are being invoked on reactor-http-* so /scrape endpoint is unresponsive
- so boundedElastic will prepare data... when reactor-http-* will read data from Socket... it will happen after all Thread.sleep
- Scenario 2:
- all Thread.sleep are being invoked on boundedElastic. But /scrape is also invoked onboundedElastic, so this is the same problem, but just on another thread pool
- Scenario 3:
- custom scheduler is used, so no task on reactor-http-* or boundedElastic is not waiting at all, cause Thread.sleep is executed on customScheduler, so there is only waiting on this pool
Hmmm.... after further debugging...: 🤔
- use Undertow as a default server
- it works for Scenario 1 and 3 ✅
- cause management.endpoint is being executed on another thread pool
- check org.springframework.boot.web.reactive.context.ReactiveWebServerApplicationContext#createWebServer
- check org.xnio.XnioWorker#XnioWorker
- but remember, that for Scenario 2, the problem is the same ❌
So basically it looks like, that the problem happens, when Reactor Netty is used as an default.
- org.springframework.boot.web.reactive.context.ReactiveWebServerApplicationContext#createWebServer is invoked twice for Reactor as well as Undertow
- when providing management.server.port=8081
- But for Reactor, under the hood reactor.netty.tcp.TcpResources#getOrCreate is used
- so first call is create server, second call returns existing server
And I think, that this is the root problem 🤔
I'm open to your feedback @bclozel on this
Note about my issue https://github.com/spring-projects/spring-framework/issues/35302
If there would be some pending metric, then I think it would be more easy to debug issues like this one provided by @filpano Cause there would be a metric which could show, that there is just some pending time
Comment From: bclozel
What you are describing is that when blocking I/O is performed in a reactive pipeline, this will stall all work on the scheduler.
Work scheduled on another scheduler is not affected... because workers aren't blocked waiting for blocking I/O calls.
They fact that both the main server and the management server are running on the same TCP resources is not a bug but a performance optimization. So to me what you are describing is really the fact that the application is performing blocking calls - this is the main problem.
Comment From: mateusz-nalepa
They fact that both the main server and the management server are running on the same TCP resources is not a bug but a performance optimization.
Ok, from that perspective I totally agree, that the problem is performing blocking calls 🚀
Context from my side:
When I saw that Undertow is creating another thread pools just to handle /scrape, then I thought, that: ok, different port, different threads. I've forgotten an obvious thing, that one server can handle more than one port 🤦
Comment From: filpano
My apologies for the radio silence. After some changes on our side which I've had the time to validate, I believe I can weigh in on this topic again.
What you are describing is that when blocking I/O is performed in a reactive pipeline, this will stall all work on the scheduler.
Work scheduled on another scheduler is not affected... because workers aren't blocked waiting for blocking I/O calls.
They fact that both the main server and the management server are running on the same TCP resources is not a bug but a >performance optimization. So to me what you are describing is really the fact that the application is performing blocking calls - this is the main problem.
@bclozel is essentially correct in that this behaviour is working as intended.
The initial crux of the issue was that we had a blocking JPA call along the route of our reactive Webflux endpoint. Under high load, the queueing behaviour that is described in the original post is encountered which essentially means that Actuator Scrapes fall by the wayside (additionally, clients interested in these endpoints seem to have low CONNECT and other timeout settings, which makes sense to me).
Though this blocking call was "obvious" in hindsight, I also tested Blockhound with the original code just to see the results. Indeed, Blockhound highlighted the blocking call. Could have avoided myself lots of headache had I used it initially, but I ended up learning quite a bit about Reactor, so it's a tradeoff. : )
For completeness' sake and to hopefully help others stumbling upon this issue:
We have clients that can buffer their data so it is not of the utmost importance that a call go through at all costs. We'd rather more immediatelly reject a request if we know we'll hit limitations/unacceptable latency, so something like the following was enough to alleviate this problem:
    @PostMapping("/high-throughput-endpoint")
    @PreAuthorize("...")
    public Mono<Void> savePayload(@RequestBody @Valid Payload payload) {
        return Mono.fromRunnable(() -> service.savePayloadBlocking(payload))
                .subscribeOn(boundedIoScheduler)
                .timeout(taskTimeout)
                .then();
    }
Note that the timeout essentially causes an Interrupt - the blocking call needs to be able to work with this (e.g. JDBC driver respecting interrupts) for it to have the full desired effect.
In our case we put a relatively conservative configuration for the boundedIoScheduler:
    @Min(1)
    private int threadPoolSize = Runtime.getRuntime().availableProcessors() * 6;

    @Min(1)
    private int queueCapacity = Runtime.getRuntime().availableProcessors() * 2 * 100;

    @Positive
    private int threadTtl = 60000;
of 6 Threads per vCPU and a maximum of 200 queued tasks per thread. A lower number of threads ended up being more performant for us, probably due to reduced context-switching and limited vCPUs. I expect more vCPUs to help a lot due to the fact that Reactor already has lots of thread pools it manages itself.
As we get more data about this behaviour we may switch back to the default Schedulers#boundedElastic() scheduler, but the default queue of 100_000 tasks per thread (effectivelly unbounded for all practical purposes) didn't quite sit right with us, as we'd rather reject requests outright than deal with long request times.
Lastly and importantly, in addition to this, we also introduced rate limiting for the endpoint determined via stress testing so that the main reactor scheduler loop isn't starved due to incoming requests, before even being able to hand off the request to a (potentially full) bounded scheduler. We have not yet hit this rate limit but we expect it to give us a bit of leeway to play around with the scheduler settings a bit more when we do.
I'll be closing this issue as the "issue" has been resolved from my point of view.
Thanks for the assistance and insights @bclozel @mateusz-nalepa!
Comment From: bclozel
Thanks a lot @filpano for the feedback and sharing the solution with us, I believe this will be helpful to the community. Cheers!