When creating a dashboard with the API (POST `/dashboard/), the response indicates success but the resulting dashboard is not functional. The charts do not appear to be operative.
Expected results
Creation of a dashboard with the API should result in a properly functioning dashboard / charts, just the same as if the dashboard were created manually with the UI.
Actual results
Dashboard is successfully created, however the charts are nonoperational.
Screenshots
How to reproduce the bug
Prerequisites:
+ CSRF is disabled (add WTF_CSRF_ENABLED = False to superset/config.py)
+ Install curl for testing the API and jq for parsing JSON
+ SUPERSET_HOST=localhost:8088
+ SUPERSET_USER=admin; SUPERSET_PASSWORD=admin
-
Obtain a TOKEN
TOKEN=$(curl -s http://$SUPERSET_HOST/api/v1/security/login -H 'accept: application/json' -H 'Content-Type: application/json' -d '{ "password": "'$SUPERSET_PASSWORD'", "provider": "db", "refresh": true, "username": "'$SUPERSET_USER'" }' | jq -r .access_token) -
Determine the UUID of the "Daily Totals" chart Since there is no way to discover the UUID of a chart from the API (see related issue below), you need to manually create a dashboard containing a chart (for this simple test case) and then GET
/dashboard/{pk}on that dashboard. The UUID value of the "Daily Totals" chart will be in theposition_jsonattribute of the dashboard. -
Create a dashboard with the chart (NOTE: you must include the UUID of the "Daily Totals" chart from above step)
curl -s 'http://'$SUPERSET_HOST'/api/v1/dashboard/' \
  -H 'Authorization: Bearer '$TOKEN'' \
  -H 'Accept: application/json' \
  -H 'Content-Type: application/json' \
  -d '{
    "dashboard_title": "TestDashboard",
    "json_metadata": "{\"timed_refresh_immune_slices\": [], \"expanded_slices\": {}, \"refresh_frequency\": 0, \"default_filters\": \"{}\", \"color_scheme\": null}",
    "position_json": "{\"CHART-w2_C20sz-l\":{\"children\":[],\"id\":\"CHART-w2_C20sz-l\",\"meta\":{\"chartId\":67,\"height\":50,\"sliceName\":\"Daily Totals\",\"uuid\":\"5ffc22e4-244e-491d-965b-b7d178845df2\",\"width\":4},\"parents\":[\"ROOT_ID\",\"GRID_ID\",\"ROW-qDUg8z__N5\"],\"type\":\"CHART\"},\"DASHBOARD_VERSION_KEY\":\"v2\",\"GRID_ID\":{\"children\":[\"ROW-qDUg8z__N5\"],\"id\":\"GRID_ID\",\"parents\":[\"ROOT_ID\"],\"type\":\"GRID\"},\"HEADER_ID\":{\"id\":\"HEADER_ID\",\"meta\":{\"text\":\"[ untitled dashboard ]\"},\"type\":\"HEADER\"},\"ROOT_ID\":{\"children\":[\"GRID_ID\"],\"id\":\"ROOT_ID\",\"type\":\"ROOT\"},\"ROW-qDUg8z__N5\":{\"children\":[\"CHART-w2_C20sz-l\"],\"id\":\"ROW-qDUg8z__N5\",\"meta\":{\"background\":\"BACKGROUND_TRANSPARENT\"},\"parents\":[\"ROOT_ID\",\"GRID_ID\"],\"type\":\"ROW\"}}",
    "published": false
  }'
An HTTP 200 Success response is returned with this body:
{
  "id": 13,
  "result": {
    "dashboard_title": "TestDashboard",
    "json_metadata": "{\"timed_refresh_immune_slices\": [], \"expanded_slices\": {}, \"refresh_frequency\": 0, \"default_filters\": \"{}\", \"color_scheme\": null}",
    "position_json": "{\"CHART-w2_C20sz-l\":{\"children\":[],\"id\":\"CHART-w2_C20sz-l\",\"meta\":{\"chartId\":67,\"height\":50,\"sliceName\":\"Daily Totals\",\"uuid\":\"5ffc22e4-244e-491d-965b-b7d178845df2\",\"width\":4},\"parents\":[\"ROOT_ID\",\"GRID_ID\",\"ROW-qDUg8z__N5\"],\"type\":\"CHART\"},\"DASHBOARD_VERSION_KEY\":\"v2\",\"GRID_ID\":{\"children\":[\"ROW-qDUg8z__N5\"],\"id\":\"GRID_ID\",\"parents\":[\"ROOT_ID\"],\"type\":\"GRID\"},\"HEADER_ID\":{\"id\":\"HEADER_ID\",\"meta\":{\"text\":\"[ untitled dashboard ]\"},\"type\":\"HEADER\"},\"ROOT_ID\":{\"children\":[\"GRID_ID\"],\"id\":\"ROOT_ID\",\"type\":\"ROOT\"},\"ROW-qDUg8z__N5\":{\"children\":[\"CHART-w2_C20sz-l\"],\"id\":\"ROW-qDUg8z__N5\",\"meta\":{\"background\":\"BACKGROUND_TRANSPARENT\"},\"parents\":[\"ROOT_ID\",\"GRID_ID\"],\"type\":\"ROW\"}}",
    "published": false
  }
}
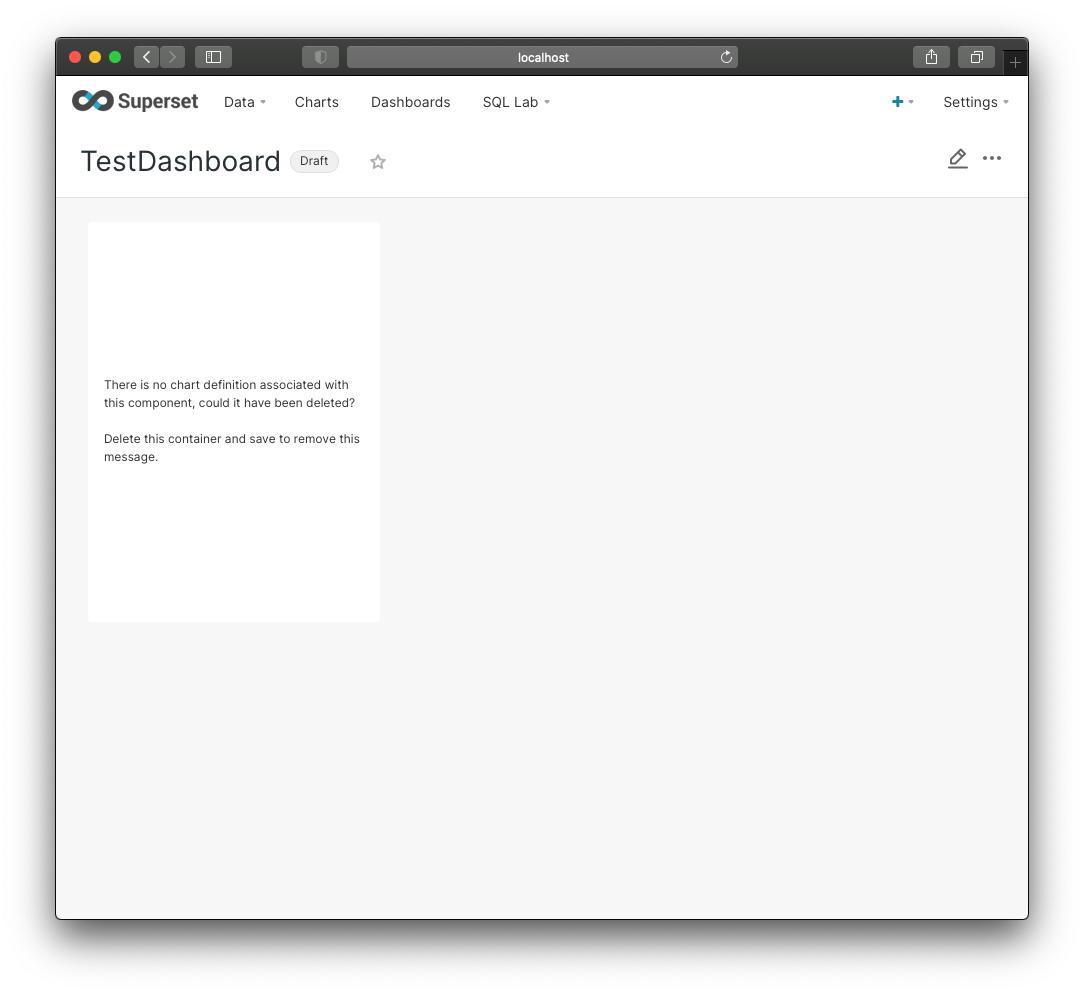
- Using the Superset UI, examine the "TestDashboard" just created, the chart on the dashboard displays the message (see screenshot)
"There is no chart definition associated with this component, could it have been deleted? Delete this container and save to remove this message."
Note: After creation of a dashboard with the API, if you manually use the UI to edit the dashboard and do a simple change (such as changing the name of the dashboard) and then save it, the dashboard will be operational (after a reload). Whatever is "missing" from the dashboard (links to the charts?) is created at this time.
Environment
- superset version:
1.2.0rc2
Checklist
- [X] I have checked the superset logs for python stacktraces and included it here as text if there are any.
- [X] I have reproduced the issue with at least the latest released version of superset.
- [X] I have checked the issue tracker for the same issue and I haven't found one similar.
Additional context
Related issue:
15456 Chart UUID not exposed in API but required when creating dashboard via API
Comment From: stale[bot]
This issue has been automatically marked as stale because it has not had recent activity. It will be closed if no further activity occurs. Thank you for your contributions. For admin, please label this issue .pinned to prevent stale bot from closing the issue.
Comment From: rusackas
This issue has been quiet for a long time, and I think is likely resolved by now (I know of people using this workflow). If people are still encountering this in current versions (currently 3.x) please open a new Issue or a PR to address the problem.
Comment From: AxelFurlanF
This is happening to me as well. I have the EXACT same issue, and even after I edit the dashboard through the UI, it works. I'm using 4.1.2
Comment From: Auburg
I'm seeing the same issue with v5.0.0 ! Creating a dashboard referencing a chart (with the correct id / uuid) doesn't result in the chart being displayed. Only in my case making a change to the dashboard does NOT result in the chart displaying.