Bug description
Datetime values outside of the range '1938-04-24 22:13:20.003' to '2286-11-20 17:46:39.997' are returned as 0NaN-NaN-NaN when creating a chart. SQL Lab returns values correctly. Microsoft SQL Server allows a range of 1753-01-01 through 9999-12-31 for datetime values.
Using the current latest commit 5b1d6b2850cfca3d3fbf5be0c09cb4bcebbee7e5 Microsoft SQL Server database
How to reproduce the bug
Create the following dataset using a mssql DB:
SELECT CAST('1938-04-24 22:13:20.002' AS DATETIME) AS datetimeA, CAST('2286-11-20 17:46:39.998' AS DATETIME) AS datetimeB
Check the return values in chart creation. If you shorten the range, they will be returned normally.
Screenshots/recordings
No response
Superset version
master / latest-dev
Python version
3.9
Node version
16
Browser
Chrome
Additional context
No response
Checklist
- [X] I have searched Superset docs and Slack and didn't find a solution to my problem.
- [X] I have searched the GitHub issue tracker and didn't find a similar bug report.
- [x] I have checked Superset's logs for errors and if I found a relevant Python stacktrace, I included it here as text in the "additional context" section.
Comment From: rusackas
Is anyone (perhaps @sujiplr from the rolodex) able to verify that this is still an issue in the 4.0 / 4.1 releases? I don't have the proper db to check/test/troubleshoot.
Comment From: rusackas
Maybe @dosubot has some ideas.
Comment From: rusackas
@dosu-bot have any ideas?
Is anyone still facing this? It's been silent for several months, so I'm tempted to close it as inactive, but you might want to look at the db engine spec and see if there's a change to be made there.
Comment From: dosubot[bot]
I found a similar closed issue titled "NaN in legend dimension," but no solution was found in the comments [1].
Regarding the issue you're experiencing, it seems that datetime values outside a specific range are not being handled correctly when creating charts in Superset with Microsoft SQL Server. This might be related to how Superset processes datetime values for visualization.
One potential area to investigate is the MssqlEngineSpec class in Superset, which handles datetime conversions and might have limitations or specific handling for certain datetime ranges [2]. Additionally, Superset's charting library applies a time grain setting that could affect how datetime values are displayed [3].
It might be helpful to check if there are any configuration settings or timezone discrepancies affecting datetime handling, as these can influence how datetime values are processed and displayed [4].
To continue talking to Dosu, mention @dosu.
Help Dosu learn! Give it feedback: Great Response | Irrelevant Answer | Incorrect Sources | Too Verbose | Hallucination | Bug Report | Other
Comment From: rusackas
PR opened https://github.com/apache/superset/pull/34514
Comment From: sfirke
This seems fixed to me in In Superset 4.1.3?
Steps
Create dataset in SQL Lab with MSSQL backend
SELECT
    CAST('1900-04-24 22:13:20.002' AS DATETIME) AS early_date,
    CAST('2300-11-20 17:46:39.998' AS DATETIME) AS late_date,
    CAST('2000-01-01 12:00:00' AS DATETIME) AS normal_date
Saved as dataset
Chart it
Created a table chart and all the values display:
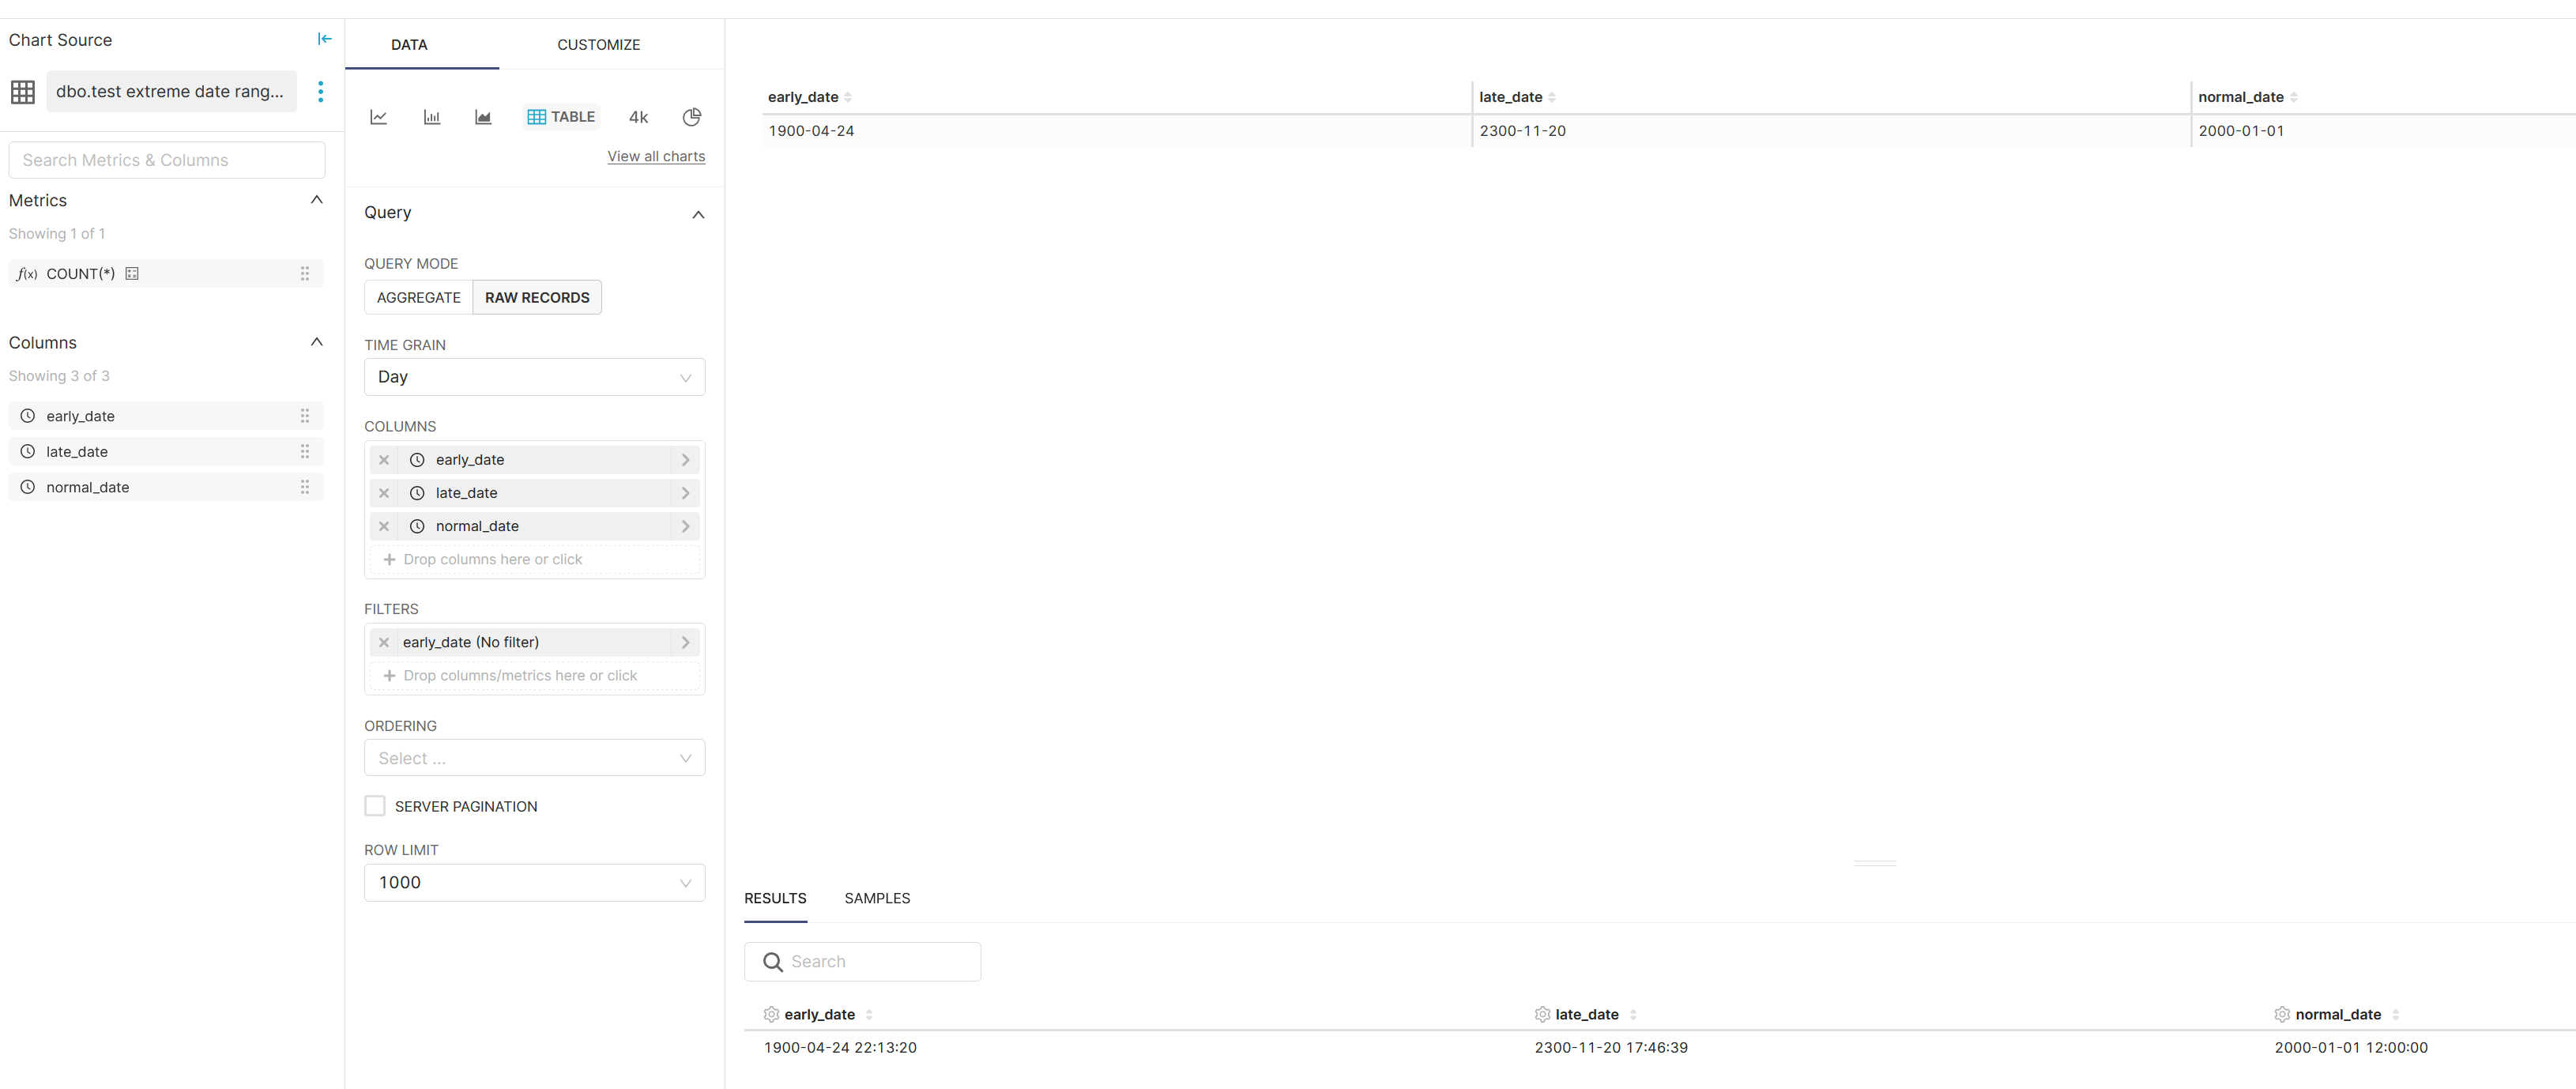
Feel free to reopen or create a new issue if anyone has a reproducible example that this is a problem on current master branch Superset, or even 5.0.0.