Go version
go version go1.24.0 windows/amd64
Output of go env in your module/workspace:
set AR=ar
set CC=gcc
set CGO_CFLAGS=-O2 -g
set CGO_CPPFLAGS=
set CGO_CXXFLAGS=-O2 -g
set CGO_ENABLED=0
set CGO_FFLAGS=-O2 -g
set CGO_LDFLAGS=-O2 -g
set CXX=g++
set GCCGO=gccgo
set GO111MODULE=on
set GOAMD64=v1
set GOARCH=amd64
set GOAUTH=netrc
set GOBIN=
set GOCACHE=C:\Users\HaoZi\AppData\Local\go-build
set GOCACHEPROG=
set GODEBUG=
set GOENV=C:\Users\HaoZi\AppData\Roaming\go\env
set GOEXE=.exe
set GOEXPERIMENT=
set GOFIPS140=off
set GOFLAGS=
set GOGCCFLAGS=-m64 -fno-caret-diagnostics -Qunused-arguments -Wl,--no-gc-sections -fmessage-length=0 -ffile-prefix-map=C:\Users\HaoZi\AppData\Local\Temp\go-build849545782=/tmp/go-build -gno-record-gcc-switches
set GOHOSTARCH=amd64
set GOHOSTOS=windows
set GOINSECURE=
set GOMOD=C:\Users\HaoZi\Desktop\panel\backend\go.mod
set GOMODCACHE=C:\Users\HaoZi\go\pkg\mod
set GONOPROXY=
set GONOSUMDB=
set GOOS=windows
set GOPATH=C:\Users\HaoZi\go
set GOPRIVATE=
set GOPROXY=https://goproxy.cn,direct
set GOROOT=C:/Program Files/Go
set GOSUMDB=sum.golang.org
set GOTELEMETRY=local
set GOTELEMETRYDIR=C:\Users\HaoZi\AppData\Roaming\go\telemetry
set GOTMPDIR=
set GOTOOLCHAIN=auto
set GOTOOLDIR=C:\Program Files\Go\pkg\tool\windows_amd64
set GOVCS=
set GOVERSION=go1.24.0
set GOWORK=
set PKG_CONFIG=pkg-config
What did you do?
I wrote a very simple hello world program.
package main

func main() {
    println("Hello, World!")
}
Then I compiled it using the go build -p=1 -debug-actiongraph="compile.json" and go build -debug-actiongraph="compile2.json" commands respectively, and used the actiongraph tool to analyze the results.
What did you see happen?
The results are as follows:
PS C:\Users\HaoZi\Desktop\test> actiongraph top -f compile.json
  0.023s  25.59%  build runtime
  0.015s  41.81%  build internal/goarch
  0.014s  57.68%  build test
  0.014s  72.79%  build internal/abi
  0.003s  76.27%  build internal/goexperiment
  0.002s  78.68%  build internal/chacha8rand
  0.002s  81.07%  build internal/runtime/maps
  0.002s  83.37%  build internal/bytealg
  0.002s  85.10%  build internal/runtime/atomic
  0.002s  86.82%  link  test
  0.002s  88.54%  build internal/runtime/sys
  0.001s  89.70%  build internal/race
  0.001s  90.86%  build internal/cpu
  0.001s  92.00%  build internal/runtime/exithook
  0.001s  93.15%  build internal/byteorder
  0.001s  94.29%  build internal/stringslite
  0.001s  95.44%  build internal/goos
  0.001s  96.57%  build internal/msan
  0.001s  97.15%  build internal/asan
  0.001s  97.72%  link-install  test
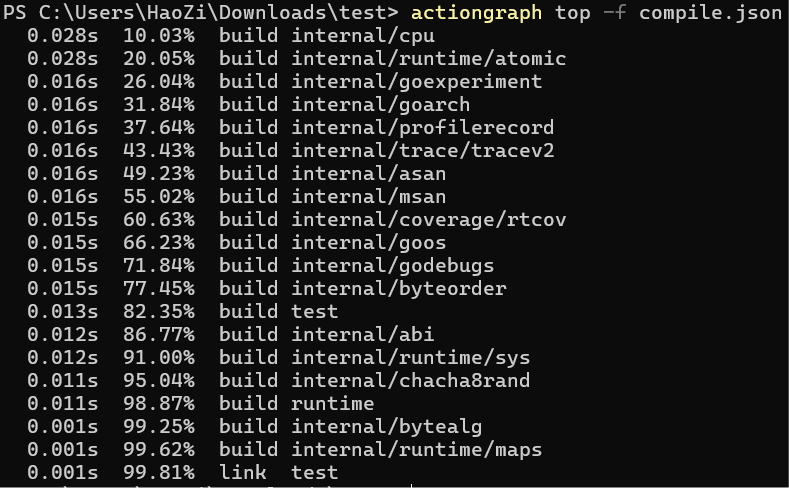
PS C:\Users\HaoZi\Desktop\test> actiongraph top -f compile2.json
 40.348s  99.17%  build internal/godebugs
  0.032s  99.25%  build internal/runtime/atomic
  0.032s  99.33%  build internal/cpu
  0.027s  99.39%  build internal/goexperiment
  0.024s  99.45%  build runtime
  0.023s  99.51%  build internal/byteorder
  0.022s  99.56%  build internal/profilerecord
  0.022s  99.62%  build internal/msan
  0.022s  99.67%  build internal/asan
  0.021s  99.72%  build internal/goarch
  0.021s  99.77%  build internal/goos
  0.020s  99.82%  build internal/coverage/rtcov
  0.017s  99.86%  build internal/abi
  0.015s  99.90%  build internal/runtime/sys
  0.013s  99.93%  build test
  0.013s  99.96%  build internal/chacha8rand
  0.005s  99.97%  build internal/bytealg
  0.004s  99.98%  build internal/runtime/math
  0.002s  99.99%  build internal/runtime/maps
  0.002s  99.99%  build internal/runtime/exithook
Obviously, the normal speed is achieved after using the -p=1 parameter, while it takes 40s without using it.
My PC uses an AMD 6800H processor and a Samsung 980 PRO NVMe SSD. I think it's unlikely that it's a hardware problem that causes such a big difference.
What did you expect to see?
Compilation speed is normal when -p=1 parameter is not used.
Comment From: devhaozi
I also reproduced a similar situation on another PC with similar configuration (go1.23.4, AMD 7745H, Samsung 980 PRO NVMe SSD, Windows 11 24H2), and Windows Defender is turned off on all systems.
Comment From: gabyhelp
Related Issues
- cmd/go: cache results of exec.LookPath #36768 (closed)
- cmd/compile: pgo causes worse performance on some benchmarks #68815
- cmd/dist: `GOMAXPROCS=2 runtime -cpu=1,2,4 -quick` makes poor use of CPU resources, increasing `all.bat` latency #65164 (closed)
- cmd/compile: build time increased in go 1.15 #40781 (closed)
- cmd/go: add duration on each -x of go build to know which pkg that slow #37591 (closed)
- cmd/compile: long build time (45 seconds) for a small package (1500 source lines of code) #65097 (closed)
- cmd/go: add option to output timestamps along with command tracing #22526 (closed)
- Compilator takes unpredictable build times and I have no idea what it's doing and why it's doing #70691 (closed)
- cmd/compile: pgo after CL 449477 cause worse performance on benchmark #68974 (closed)
- cmd/go/internal/test: default pgo=auto results in surprising slow behaviour #61983
(Emoji vote if this was helpful or unhelpful; more detailed feedback welcome in this discussion.)
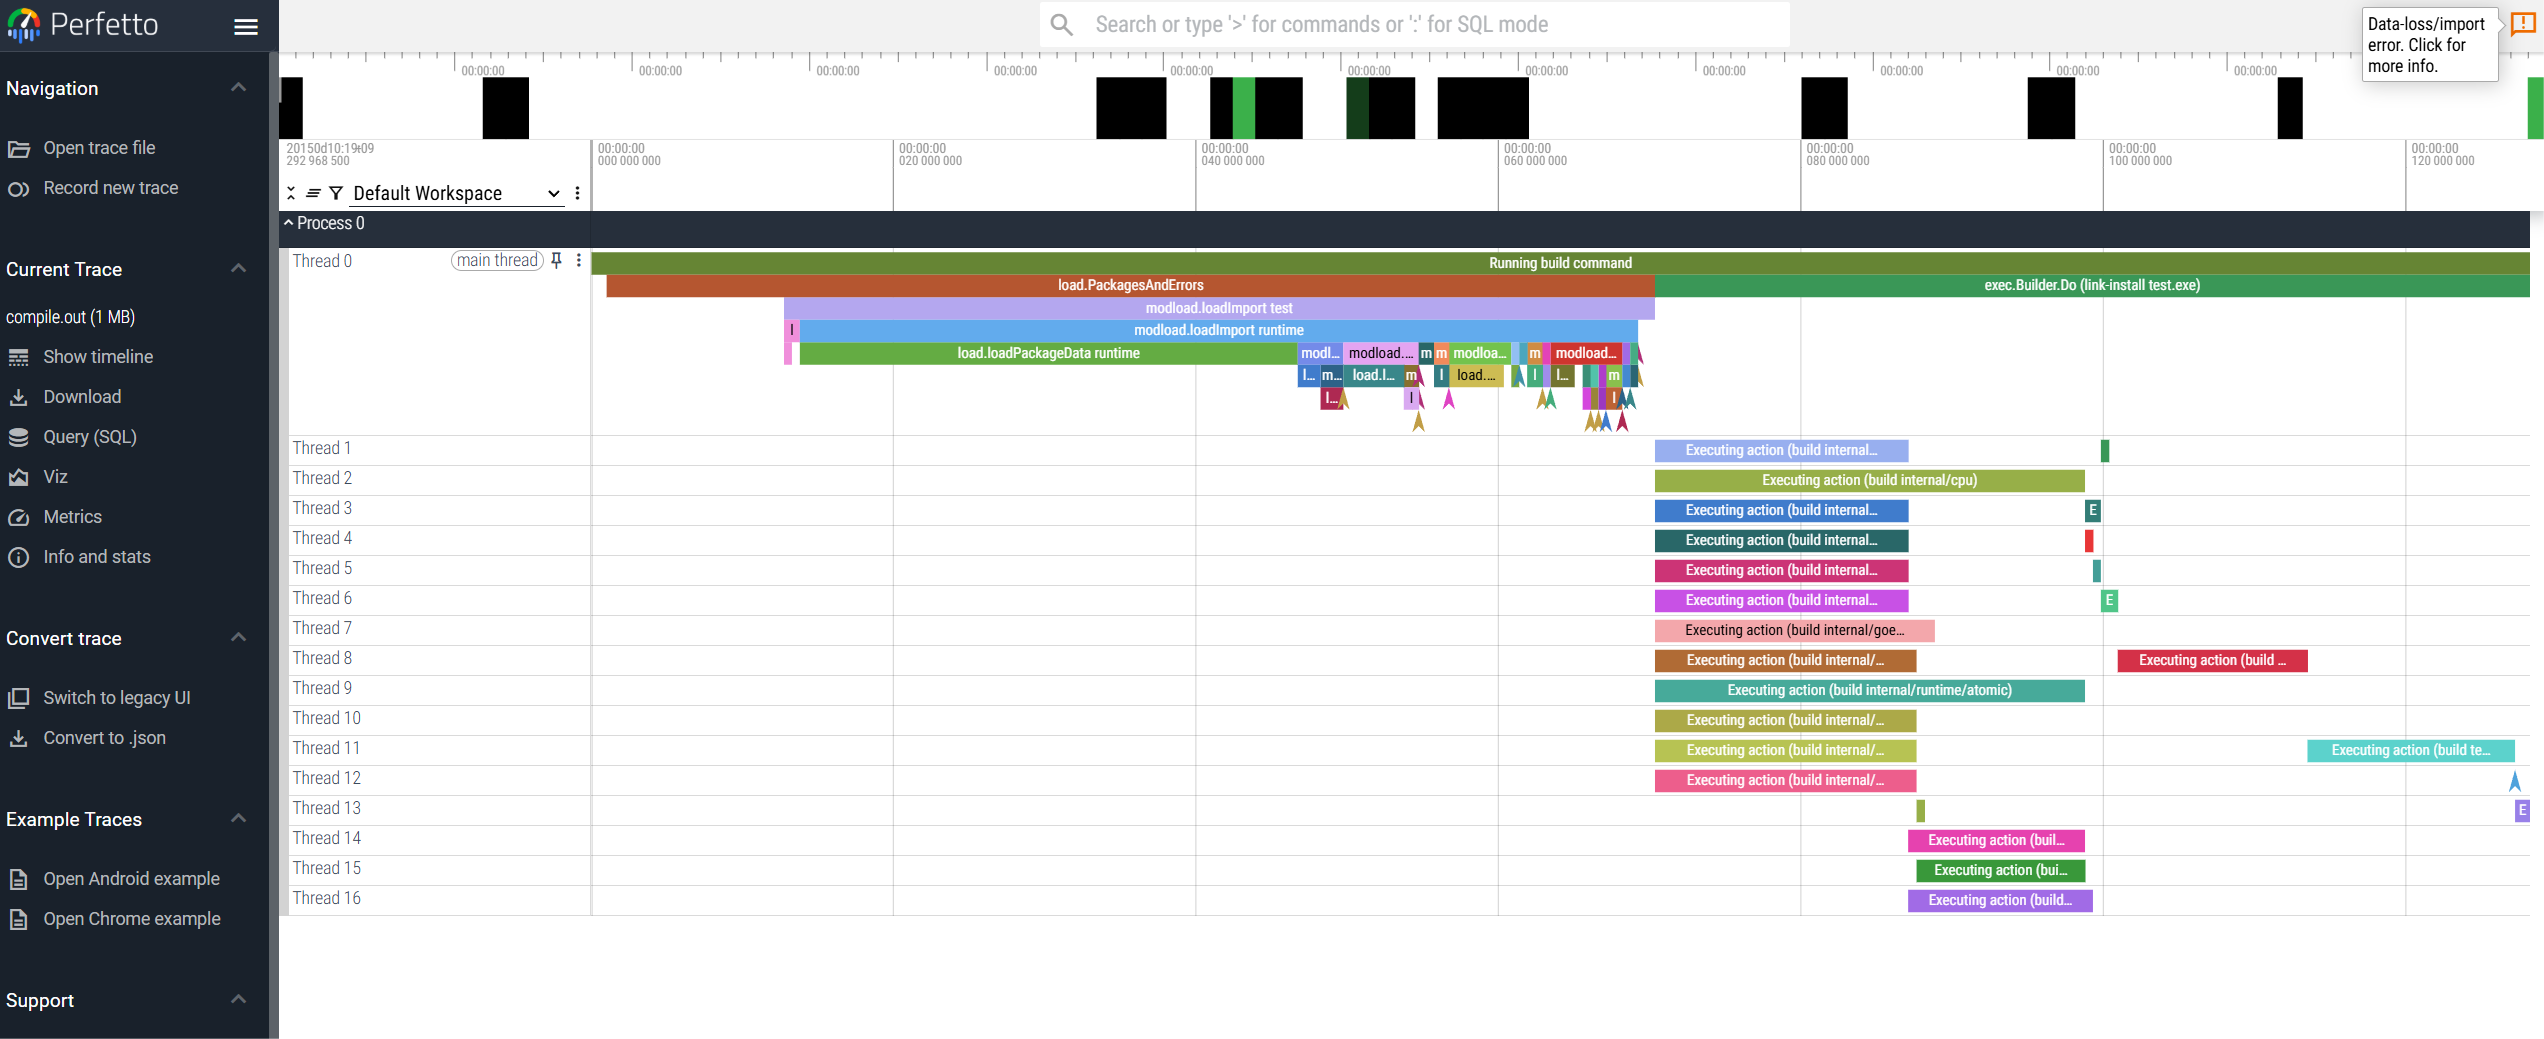
Comment From: devhaozi
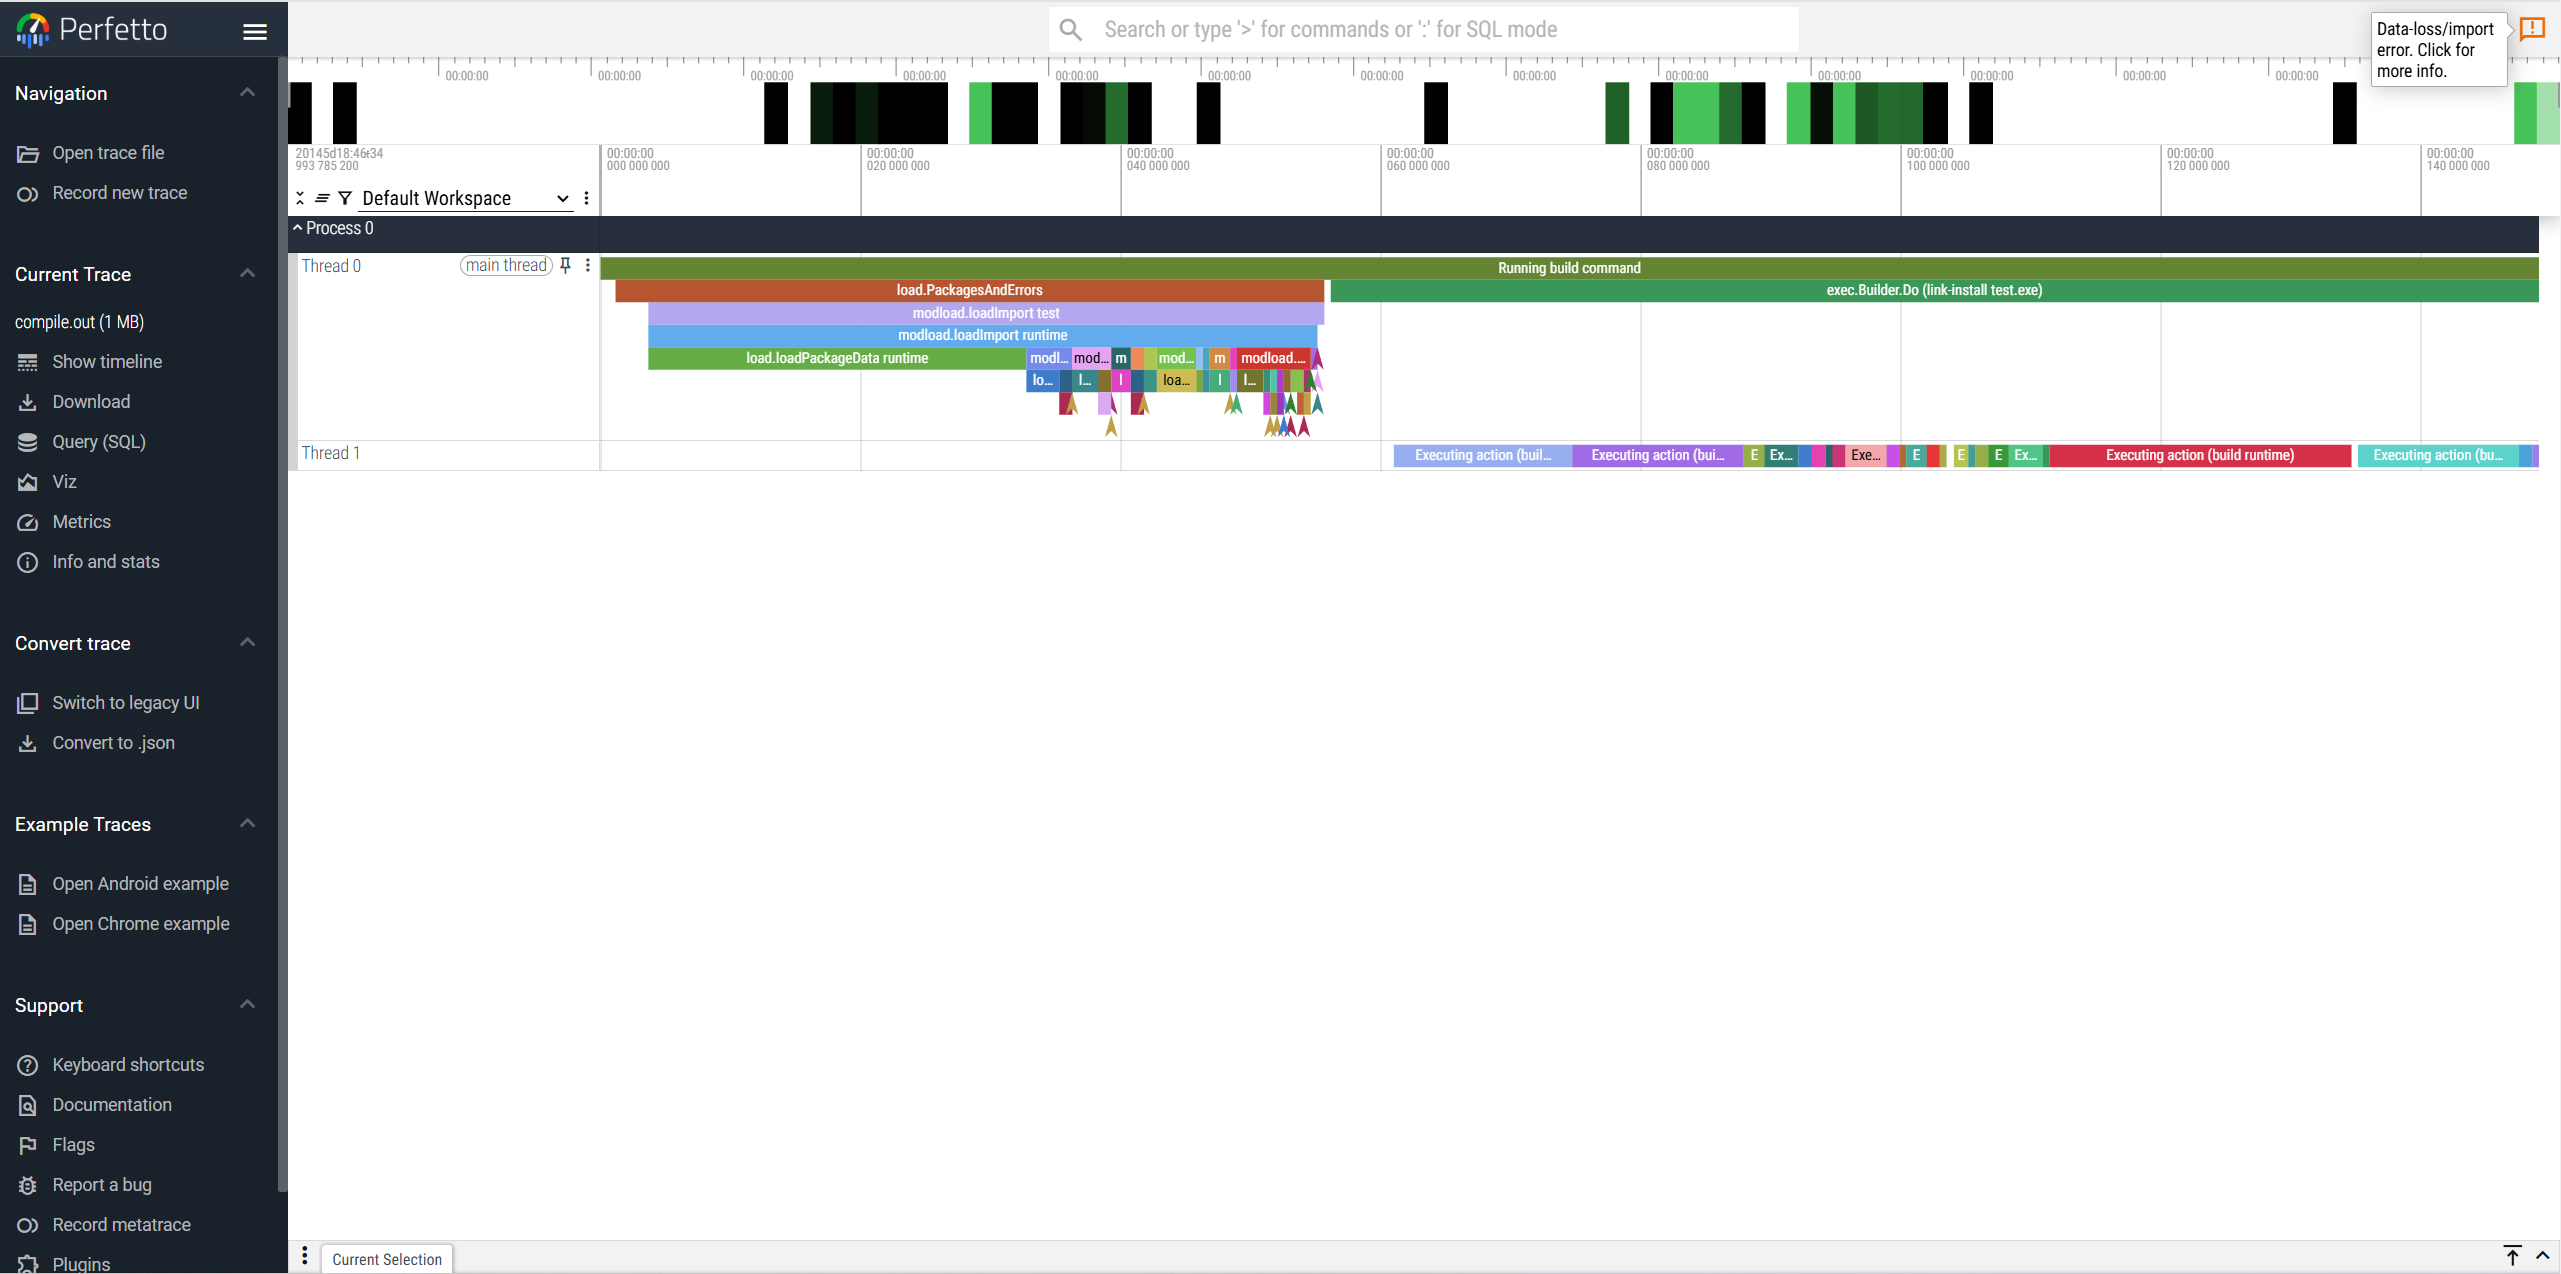
This is the analysis screenshot and source file compiled with the -debug-trace parameter added.
Comment From: seankhliao
do repeated (cached) builds also have the same slowdown?
Comment From: devhaozi
do repeated (cached) builds also have the same slowdown?
Yes, I tested it many times. The slowdown occurs when not using -p=1.
Comment From: qmuntal
Thanks for reporting. I cant' reproduce the 40s slow down, but I do see a 3x slowdown when building without -p=1, going from ~0.25s to ~0.75s a hello world cached build. Will investigate.
Comment From: thepudds
Hi @qmuntal, one quick passing thought is maybe cmd/go's internal robustio package could be involved (or maybe not):
Package robustio wraps I/O functions that are prone to failure on Windows, transparently retrying errors up to an arbitrary timeout
https://pkg.go.dev/cmd/internal/robustio
Also, I know you've contributed a bunch (including I think you and I interacted on some Window's timer issues), but I don't know how much you've looked at cmd/go, so I'll also just quickly mention -x is handy, along with -debug-trace (from https://github.com/golang/go/commit/52b0ea20ff10fdcfe570ef407bd462d23e13d782), -debug-runtime-trace (from https://github.com/golang/go/commit/8fce59eab5cb2facfafca89e047b4b43ba44785f), and -debug-actiongraph (from https://github.com/golang/go/commit/0174858c71789365dc3550916916d43490a900fc), though which of those are useful (if any) really depends on what the problem is.
In 1.24, there's also the -json flag for go build, though I've never used it:
The go build and go install commands now accept a -json flag that reports build output and failures as structured JSON output on standard output. For details of the reporting format, see go help buildjson.
In any event, consider these drive-by comments that might not be actually useful. 😅
edit: and looking at the problem report more carefully, I see @devhaozi already mentioned some of this.
Comment From: qmuntal
Thanks for the tips @thepudds!
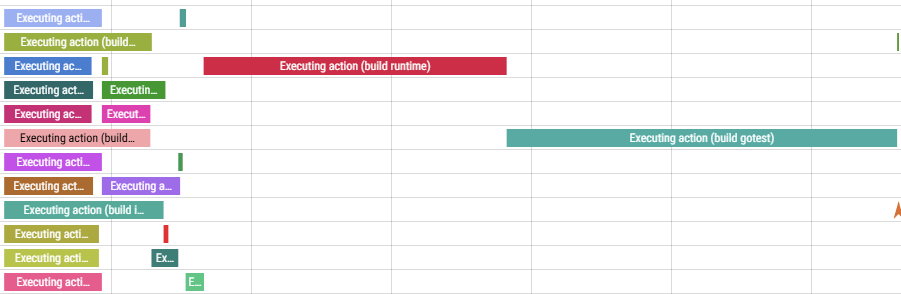
I'm currently following this lead: most packages consistently take just ~10ms to build when using -p=1 (when the cache is warm), but the build time spikes to 500-1000ms when not setting -p. E.g.
-p=1-p=12

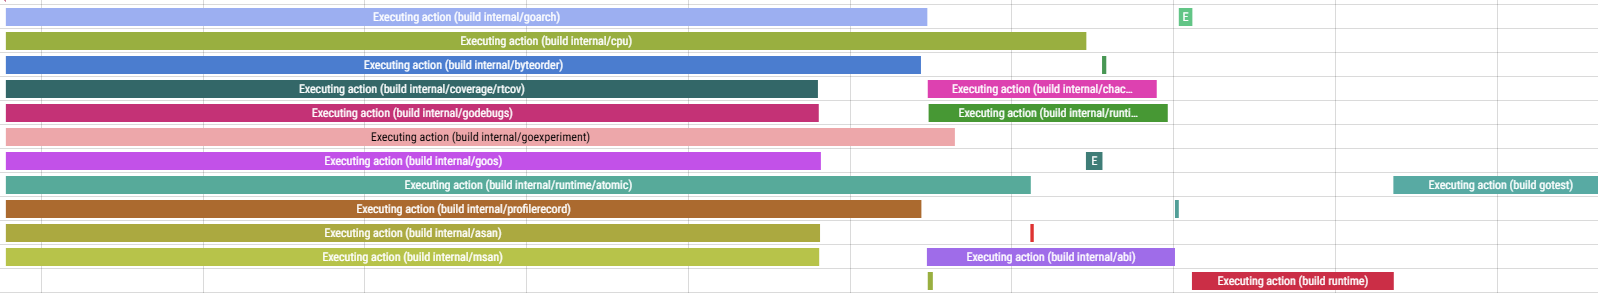
This might be a reporting issue or some in-memory caches being warmed up, or could be something deeper.
Comment From: gopherbot
Change https://go.dev/cl/653715 mentions this issue: cmd/go/internal/work: use par.Cache to cache tool IDs.
Comment From: qmuntal
Interesting finding: each build thread is running several exec.Commands to get the tool ID of the compile, asm, and link tools. That's 36 commands when using 12 threads, when just 3 commands should suffice, one per tool.
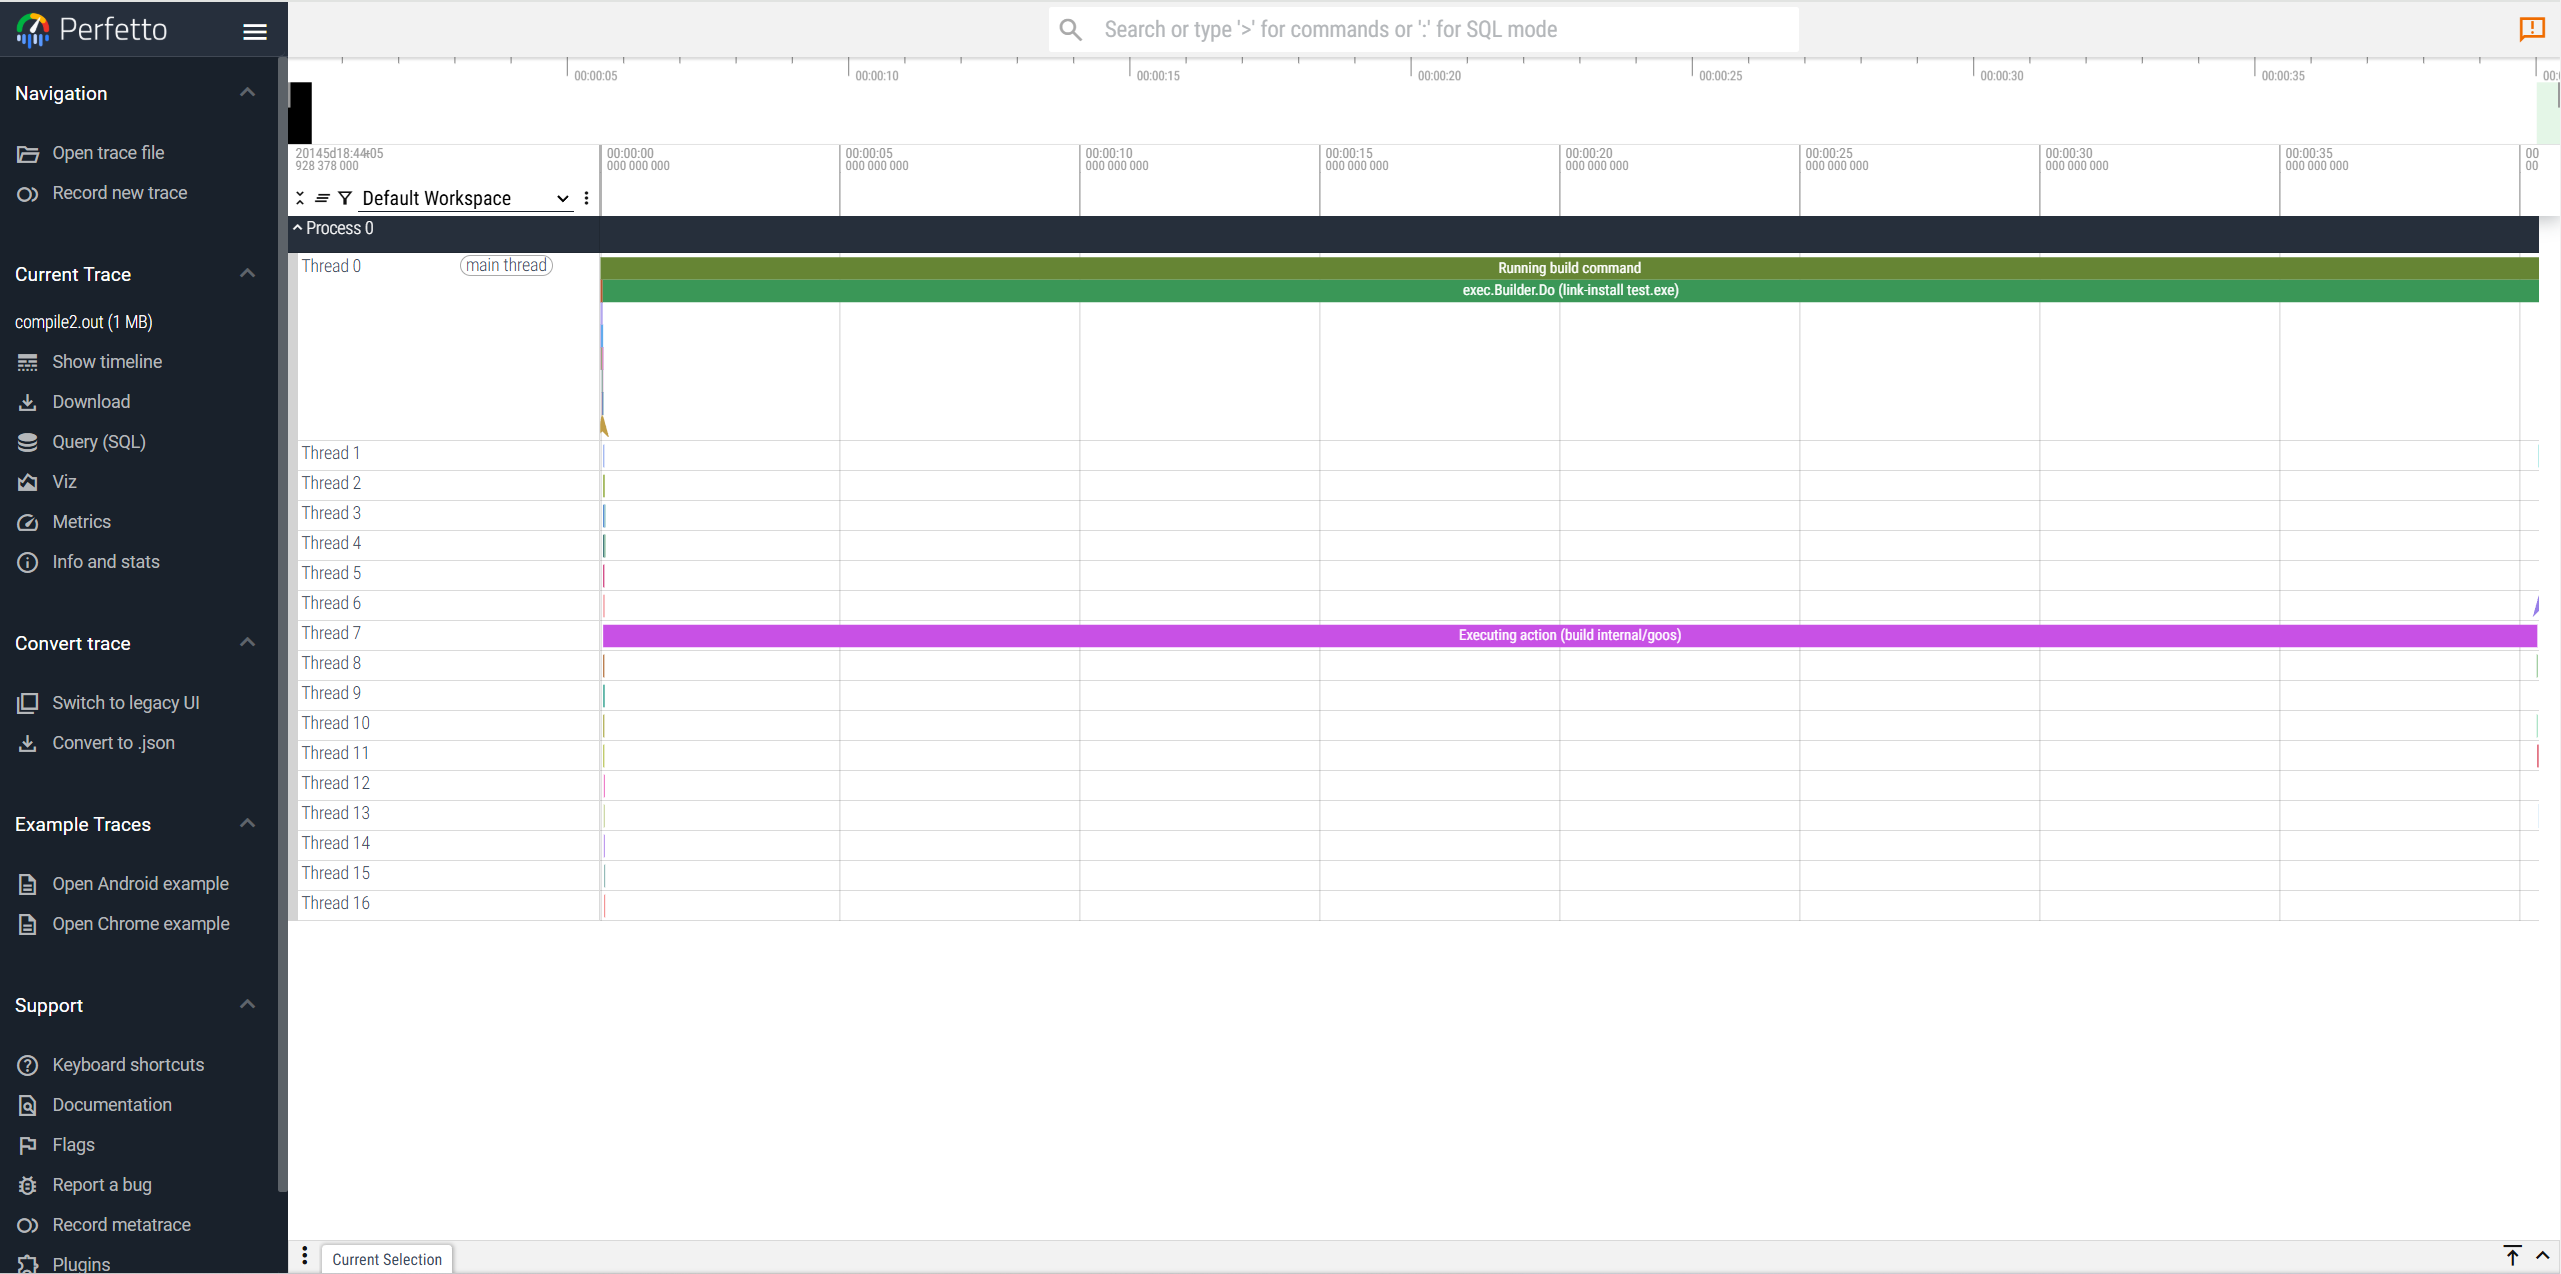
I've submitted CL 653715, which improves the build action so that it doesn't spawn that many commands. On a my Windows machine (that has 12 virtual CPUs), the time to build a hello world program is reduced from over 1 second, with spikes of 2 seconds, to a consistent 0.7 seconds. Also, now almost all individual build actions last around 30ms, which is more similar to the -p=1 case.
The actiongraph looks much better now (use the Executing action (build runtime) as a scale to compare with the previous comment, it's time hasn't changed much).
I'm not sure if this fixes the issue reported in here, but it's an improvement 😄.
Comment From: qmuntal
@devhaozi could you try running your workflow with gotip to see if CL 653715 improves it?
You install the latest gotip by running the following commands:
go install golang.org/dl/gotip@latest
gotip download
And then use gotip instead of go.
Comment From: devhaozi
@devhaozi could you try running your workflow with
gotipto see if CL 653715 improves it?You install the latest gotip by running the following commands:
go install golang.org/dl/gotip@latest
gotip download
And then use
gotipinstead ofgo.
Great, now it looks like it can compile in under 1 second.
Comment From: qmuntal
Cool! Then I would consider this issue closed. We could backport the fix given it's small size. But this is not a new regression, so I don't know if it makes the cut. @golang/release.
Comment From: devhaozi
Cool! Then I would consider this issue closed. We could backport the fix given it's small size. But this is not a new regression, so I don't know if it makes the cut. @golang/release.
Can this fix be backported to go1.24? It has a great impact on my development.
Comment From: xrzxrzx
我在go1.24 windows 24H2 r7-7745HX上遇到了同样的问题,每次编译都需要40秒左右,加上 -p=1后完美解决
Comment From: zhang3k
The problem lies with Microsoft PC Manager Service,kill it


Comment From: zhang3k
我在go1.24 windows 24H2 r7-7745HX上遇到了同样的问题,每次编译都需要40秒左右,加上 后完美解决
-p=1
应该是 24H2 更新的时候更新了电脑管家,Microsoft PC Manager Service 是自启动的服务,这个浓眉大眼的狗东西在每次编译的时候疯狂工作,怀疑是在扫描编译生成的临时文件,应该是扫描的时候文件被锁住了,导致编译变慢,困扰我好久了,叫电脑管家的没一个好东西
Comment From: qmuntal
Closing this issue, as the original problem seems to be fixed, even if it won't be back ported to Go 1.24.
Comment From: J-jxr
I uninstalled Microsoft PC Manager. The compilation speed is extremely fast. Finally, the problem has been solved