Bug description
Function: pivot_df
Error: The function pivot_df raised a KeyError when trying to pivot the DataFrame due to a missing column.
Log:
/app/superset/charts/post_processing.py, line 314, in apply_post_process
processed_df = post_processor(df, form_data, datasource)
File "/app/superset/charts/post_processing.py", line 233, in pivot_table_v2
return pivot_df(
File "/app/superset/charts/post_processing.py", line 90, in pivot_df
df = df.pivot_table(
File "/usr/local/lib/python3.10/site-packages/pandas/core/frame.py", line 8579, in pivot_table
return pivot_table(
File "/usr/local/lib/python3.10/site-packages/pandas/core/reshape/pivot.py", line 97, in pivot_table
table = __internal_pivot_table(
File "/usr/local/lib/python3.10/site-packages/pandas/core/reshape/pivot.py", line 143, in __internal_pivot_table
raise KeyError(i)
KeyError: 'sum__num'
Steps to reproduce error:
- Open a default chart in Superset of the Pivot Table type. In this example, we are using Pivot Table v2 within the USA Births Names dashboard:
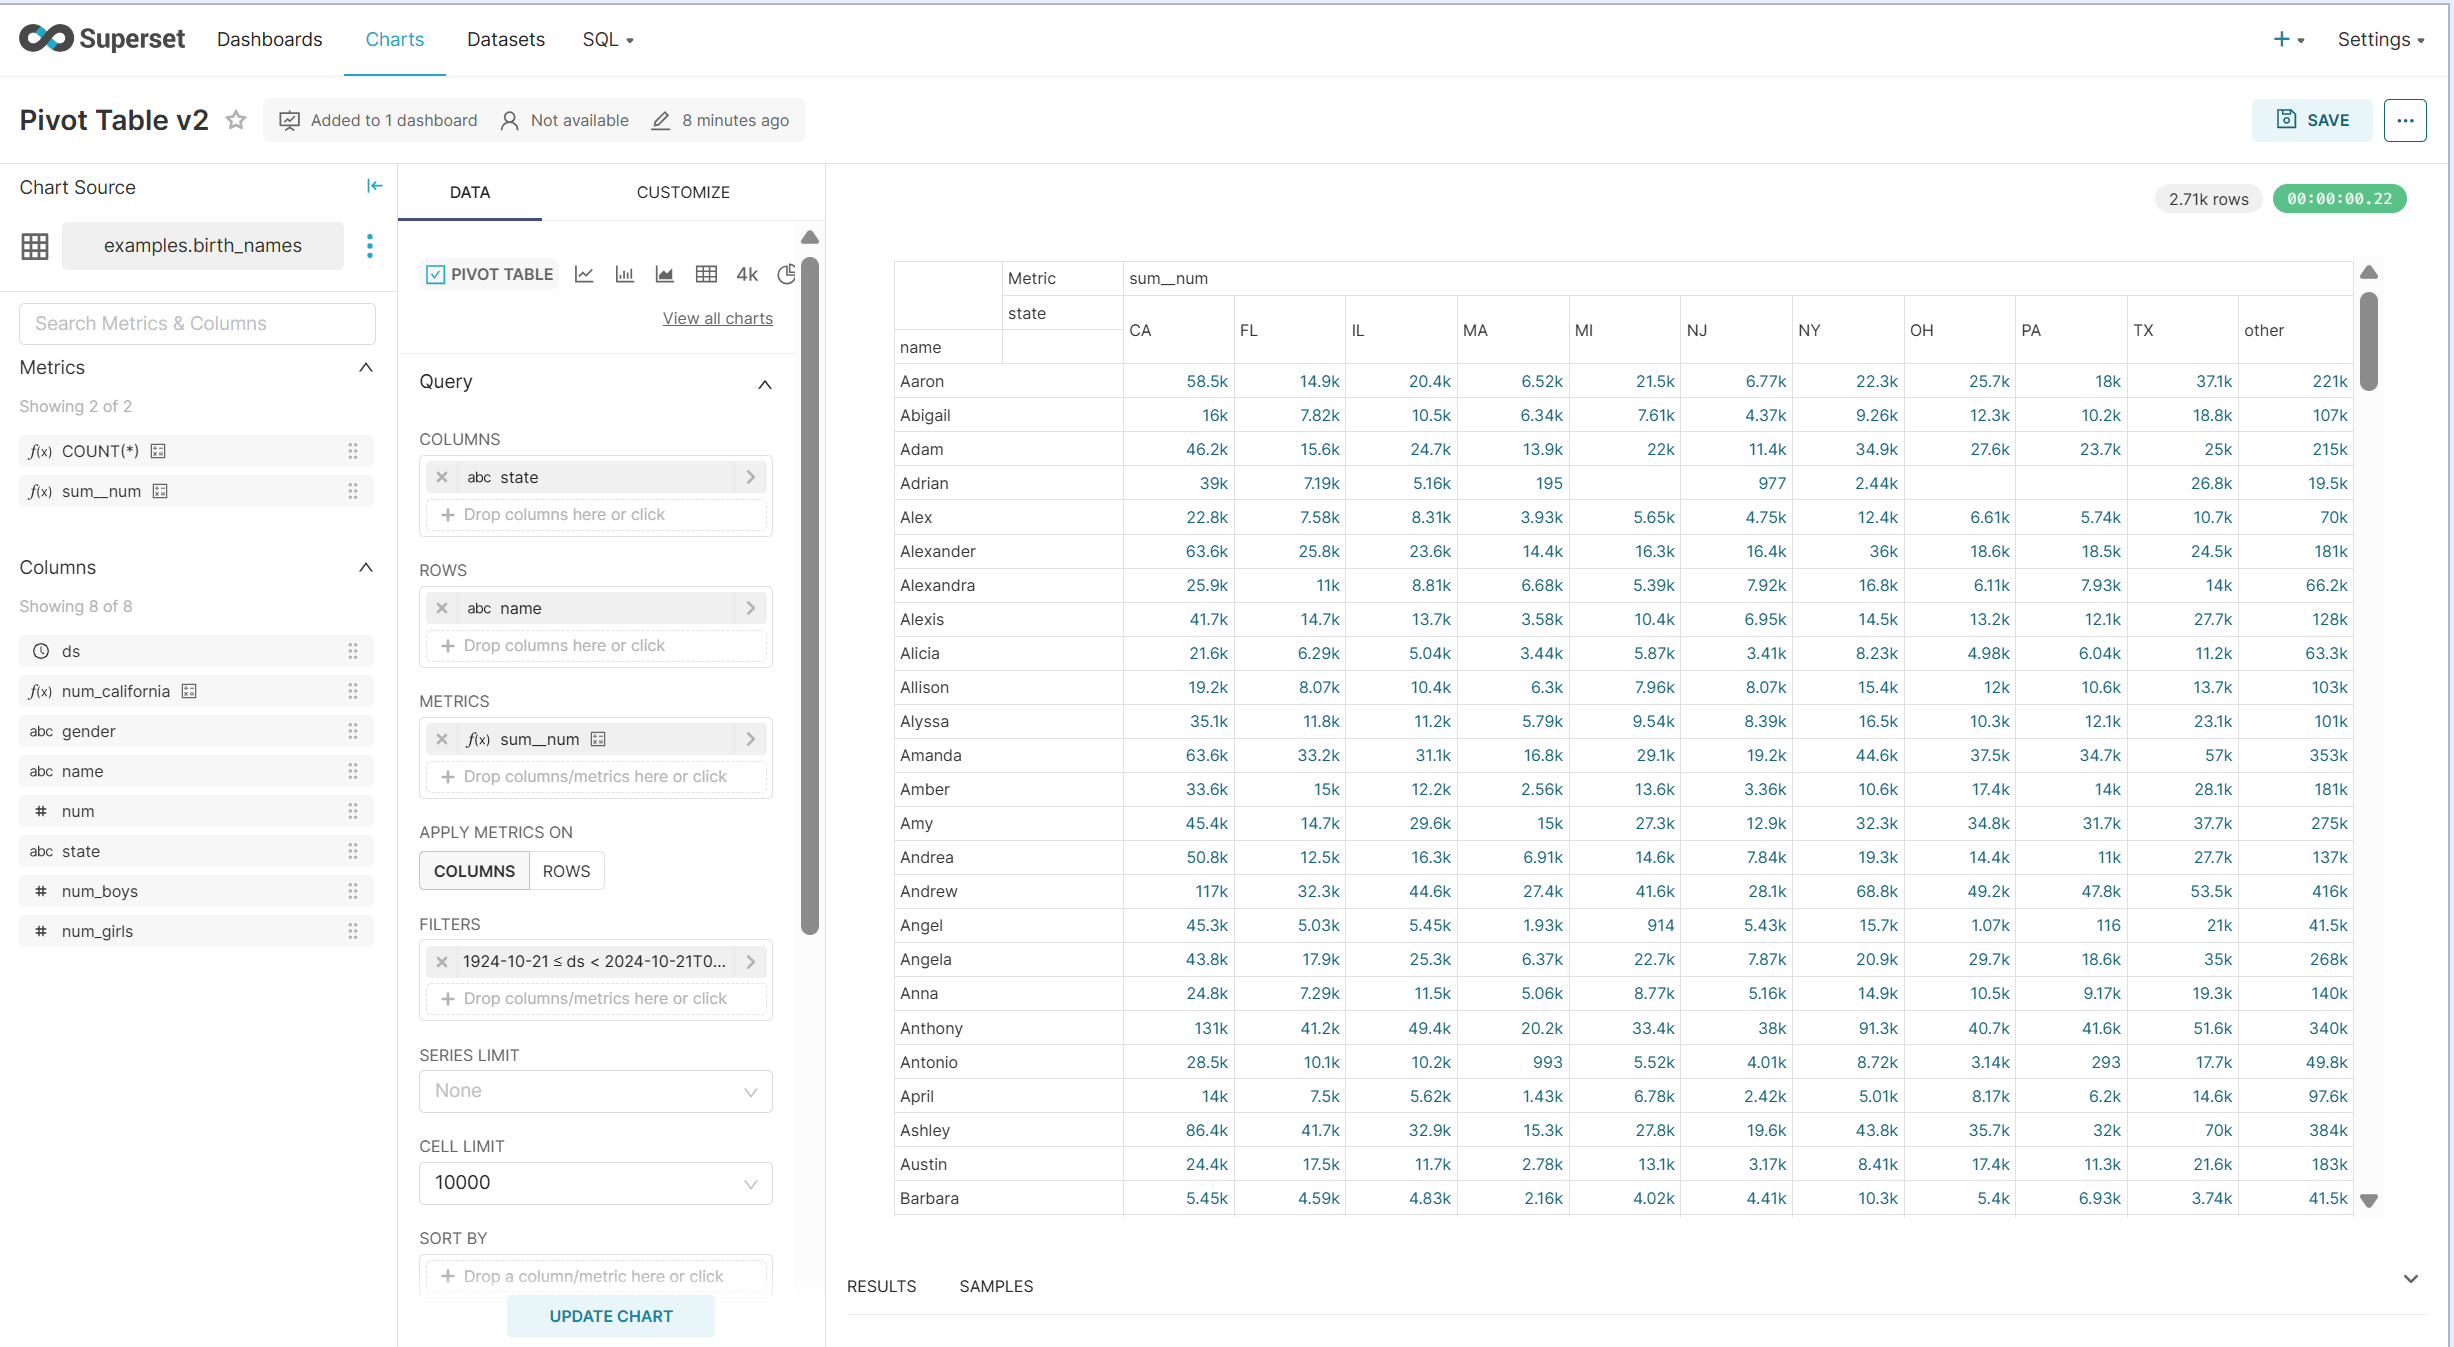
-
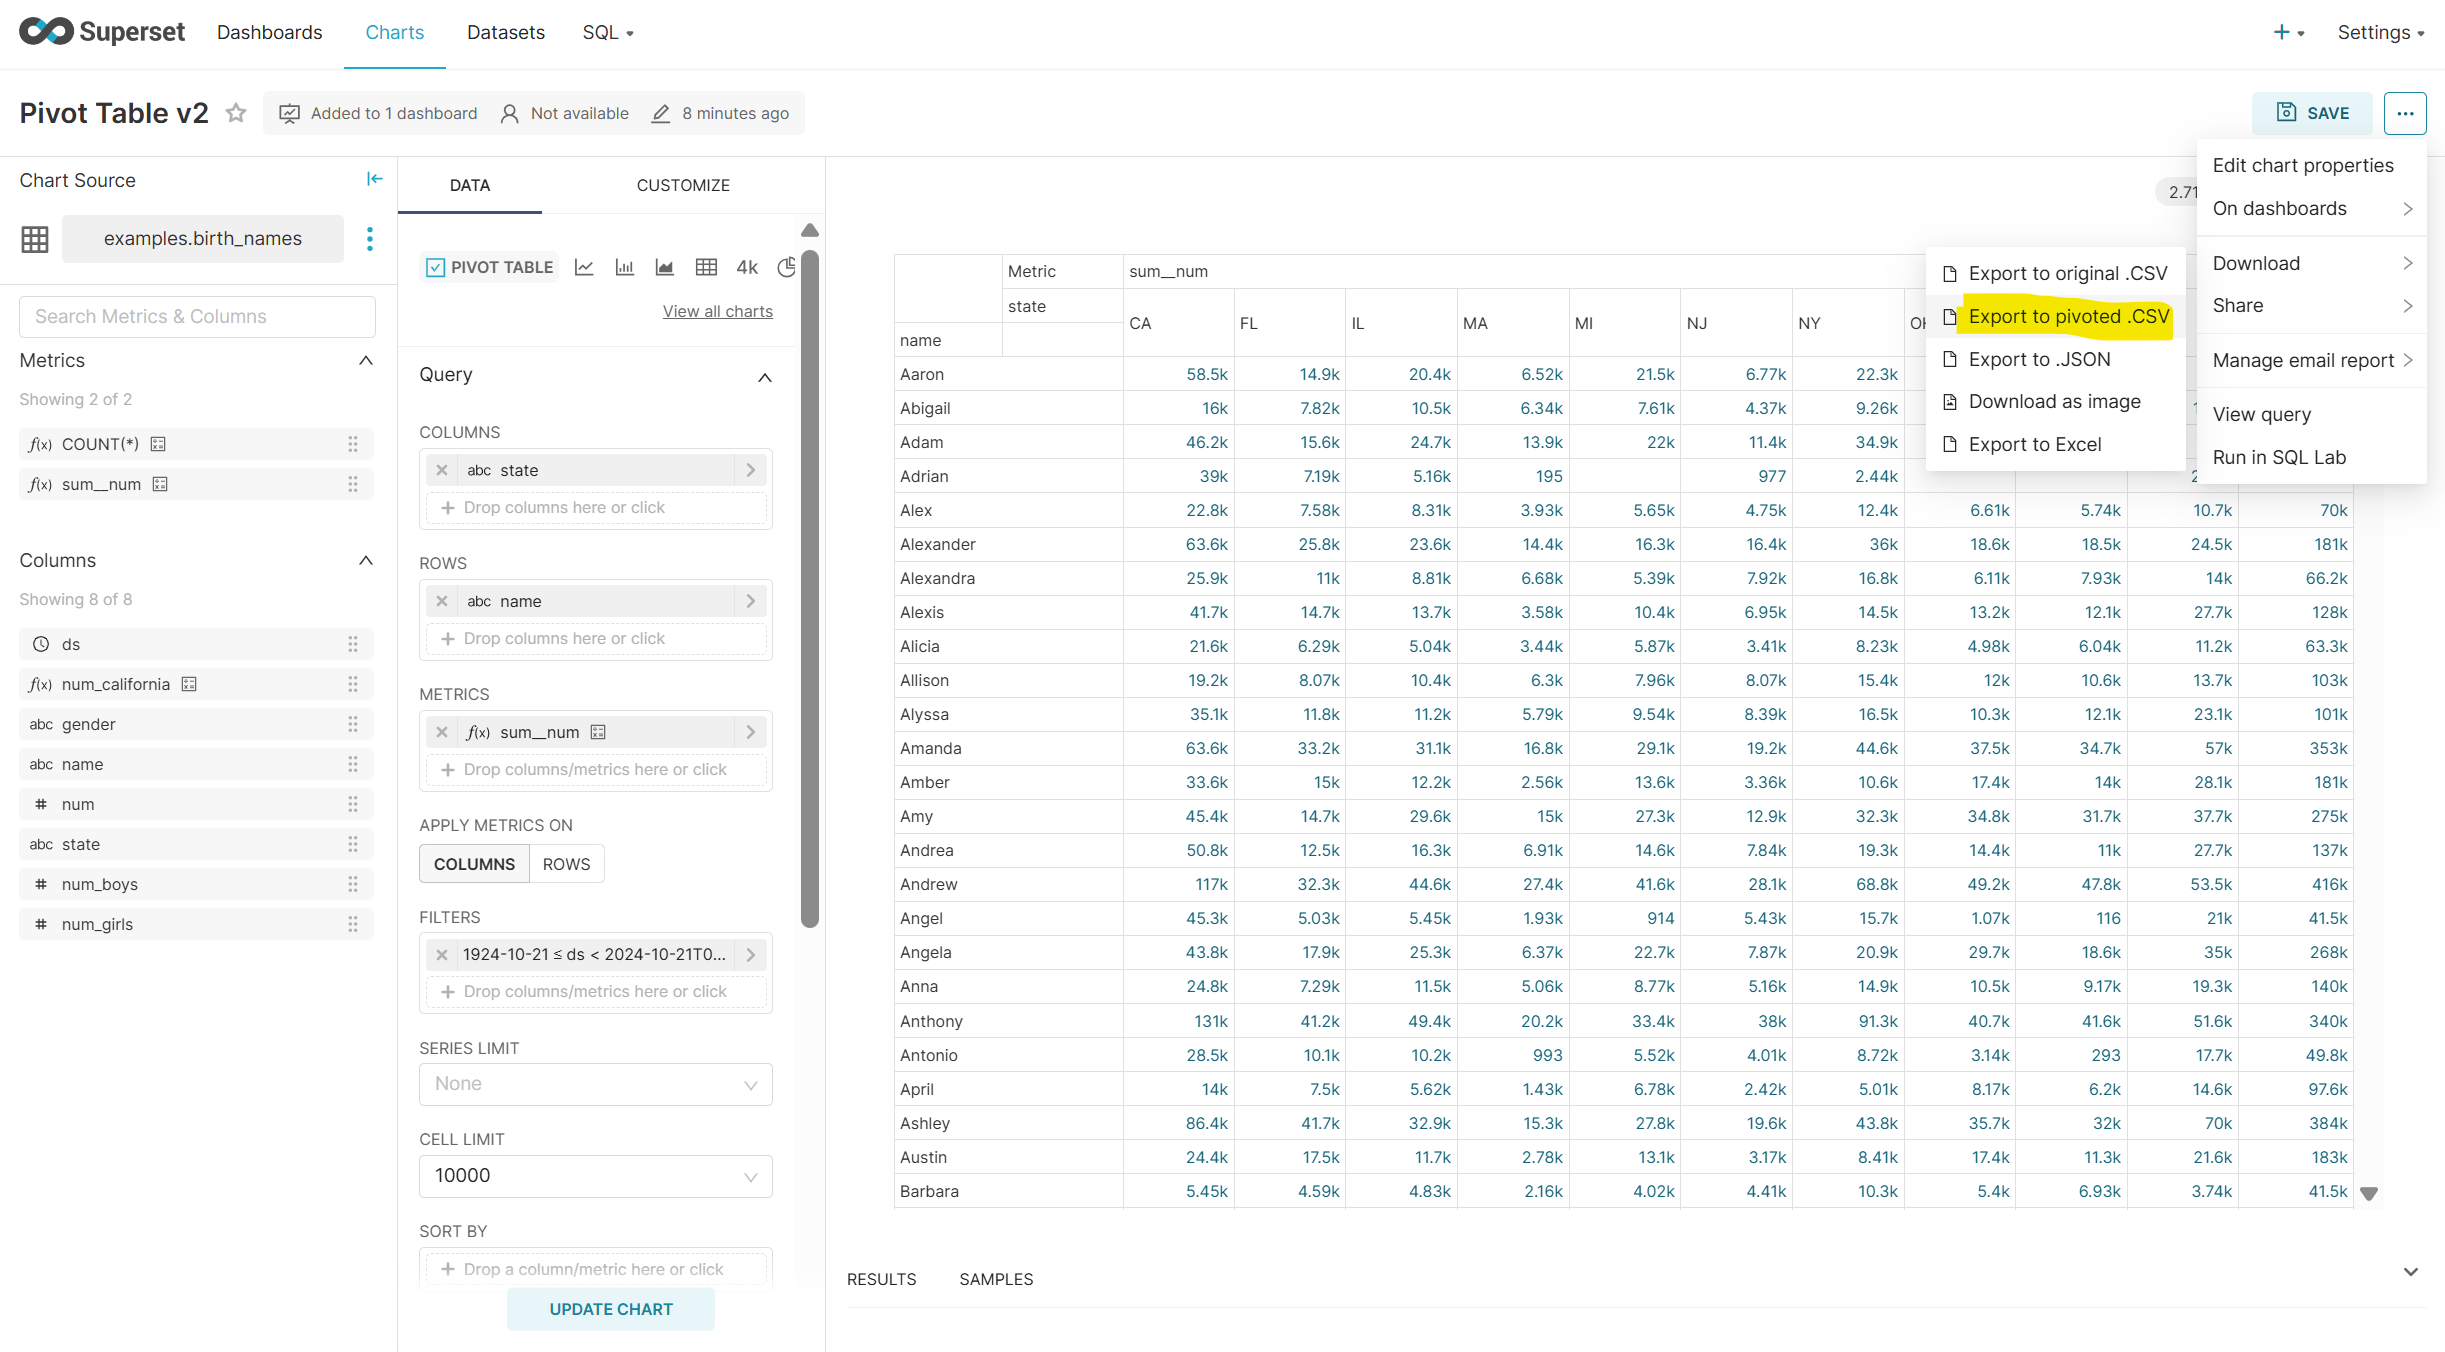
Click on Download > Export to Pivoted .CSV
-
Download is blocked by an error.
Cause: The error is generated by an anomaly in the input DataFrame df, which has the following format (a single column with all distinct fields separated by a semicolon separator):
,state;name;sum__num
0,other;Michael;1047996
1,other;Christopher;803607
2,other;James;749686
Fix: Added a bug fix to split the first column using ";" and expand it into multiple columns, then reassign the original column names.
Code Changes:
###### BUGFIX ##############
# Split the first column using ";" and expand it into multiple columns
# Backup the original column names to reassign them later
columns_backup = df.columns[0].split(";")
df = df.iloc[:,0].str.split(';', expand=True)
df.columns = columns_backup
############################
Complete Code
def pivot_df(  # pylint: disable=too-many-locals, too-many-arguments, too-many-statements, too-many-branches
    df: pd.DataFrame,
    rows: list[str],
    columns: list[str],
    metrics: list[str],
    aggfunc: str = "Sum",
    transpose_pivot: bool = False,
    combine_metrics: bool = False,
    show_rows_total: bool = False,
    show_columns_total: bool = False,
    apply_metrics_on_rows: bool = False,
) -> pd.DataFrame:
    metric_name = __("Total (%(aggfunc)s)", aggfunc=aggfunc)

    if transpose_pivot:
        rows, columns = columns, rows

    # to apply the metrics on the rows we pivot the dataframe, apply the
    # metrics to the columns, and pivot the dataframe back before
    # returning it
    if apply_metrics_on_rows:
        rows, columns = columns, rows
        axis = {"columns": 0, "rows": 1}
    else:
        axis = {"columns": 1, "rows": 0}

    # pivot data; we'll compute totals and subtotals later
    if rows or columns:
        ###### BUGFIX ##############
        # Split the first column using ";" and expand it into multiple columns
        # Backup the original column names to reassign them later
        columns_backup = df.columns[0].split(";")
        df = df.iloc[:,0].str.split(';', expand=True)
        df.columns = columns_backup
        ############################
        # pivoting with null values will create an empty df
        df = df.fillna("NULL")
        df = df.pivot_table(
            index=rows,
            columns=columns,
            values=metrics,
            aggfunc=pivot_v2_aggfunc_map[aggfunc],
            margins=False,
        )
    else:
        # if there's no rows nor columns we have a single value; update
        # the index with the metric name so it shows up in the table
        df.index = pd.Index([*df.index[:-1], metric_name], name="metric")

    # if no rows were passed the metrics will be in the rows, so we
    # need to move them back to columns
    if columns and not rows:
        df = df.stack()
        if not isinstance(df, pd.DataFrame):
            df = df.to_frame()
        df = df.T
        df = df[metrics]
        df.index = pd.Index([*df.index[:-1], metric_name], name="metric")

    # combining metrics changes the column hierarchy, moving the metric
    # from the top to the bottom, eg:
    #
    # ('SUM(col)', 'age', 'name') => ('age', 'name', 'SUM(col)')
    if combine_metrics and isinstance(df.columns, pd.MultiIndex):
        # move metrics to the lowest level
        new_order = [*range(1, df.columns.nlevels), 0]
        df = df.reorder_levels(new_order, axis=1)

        # sort columns, combining metrics for each group
        decorated_columns = [(col, i) for i, col in enumerate(df.columns)]
        grouped_columns = sorted(
            decorated_columns, key=lambda t: get_column_key(t[0], metrics)
        )
        indexes = [i for col, i in grouped_columns]
        df = df[df.columns[indexes]]
    elif rows:
        # if metrics were not combined we sort the dataframe by the list
        # of metrics defined by the user
        df = df[metrics]

    # compute fractions, if needed
    if aggfunc.endswith(" as Fraction of Total"):
        total = df.sum().sum()
        df = df.astype(total.dtypes) / total
    elif aggfunc.endswith(" as Fraction of Columns"):
        total = df.sum(axis=axis["rows"])
        df = df.astype(total.dtypes).div(total, axis=axis["columns"])
    elif aggfunc.endswith(" as Fraction of Rows"):
        total = df.sum(axis=axis["columns"])
        df = df.astype(total.dtypes).div(total, axis=axis["rows"])

    # convert to a MultiIndex to simplify logic
    if not isinstance(df.index, pd.MultiIndex):
        df.index = pd.MultiIndex.from_tuples([(str(i),) for i in df.index])
    if not isinstance(df.columns, pd.MultiIndex):
        df.columns = pd.MultiIndex.from_tuples([(str(i),) for i in df.columns])

    if show_rows_total:
        # add subtotal for each group and overall total; we start from the
        # overall group, and iterate deeper into subgroups
        groups = df.columns
        for level in range(df.columns.nlevels):
            subgroups = {group[:level] for group in groups}
            for subgroup in subgroups:
                slice_ = df.columns.get_loc(subgroup)
                subtotal = pivot_v2_aggfunc_map[aggfunc](df.iloc[:, slice_], axis=1)
                depth = df.columns.nlevels - len(subgroup) - 1
                total = metric_name if level == 0 else __("Subtotal")
                subtotal_name = tuple([*subgroup, total, *([""] * depth)])
                # insert column after subgroup
                df.insert(int(slice_.stop), subtotal_name, subtotal)

    if rows and show_columns_total:
        # add subtotal for each group and overall total; we start from the
        # overall group, and iterate deeper into subgroups
        groups = df.index
        for level in range(df.index.nlevels):
            subgroups = {group[:level] for group in groups}
            for subgroup in subgroups:
                slice_ = df.index.get_loc(subgroup)
                subtotal = pivot_v2_aggfunc_map[aggfunc](
                    df.iloc[slice_, :].apply(pd.to_numeric), axis=0
                )
                depth = df.index.nlevels - len(subgroup) - 1
                total = metric_name if level == 0 else __("Subtotal")
                subtotal.name = tuple([*subgroup, total, *([""] * depth)])
                # insert row after subgroup
                df = pd.concat(
                    [df[: slice_.stop], subtotal.to_frame().T, df[slice_.stop :]]
                )

    # if we want to apply the metrics on the rows we need to pivot the
    # dataframe back
    if apply_metrics_on_rows:
        df = df.T

    return df
Screenshots/recordings
No response
Superset version
4.0.2
Python version
3.10
Node version
16
Browser
Chrome
Additional context
No response
Checklist
- [X] I have searched Superset docs and Slack and didn't find a solution to my problem.
- [X] I have searched the GitHub issue tracker and didn't find a similar bug report.
- [X] I have checked Superset's logs for errors and if I found a relevant Python stacktrace, I included it here as text in the "additional context" section.
Comment From: dosubot[bot]
Hey there, @frlm! I'm here to assist you with any bugs, questions, or contributions you have. Let's tackle this together!
The error you're encountering is due to the pivot_df function trying to access a column named 'Births' that doesn't exist in the DataFrame. The provided bug fix addresses this issue by splitting the first column of the DataFrame using a semicolon (;) and expanding it into multiple columns, then reassigning the original column names. This ensures that the DataFrame has the correct structure before the pivot operation is attempted.
Here's a summary of the fix:
- Split the First Column: The first column of the DataFrame is split using the semicolon as a delimiter, expanding it into multiple columns.
- Reassign Column Names: The original column names are backed up and reassigned to the newly expanded DataFrame.
This fix should resolve the KeyError by ensuring that the DataFrame has the expected columns before the pivot operation is performed. Make sure that the DataFrame is correctly formatted before calling pivot_df, as this function expects a well-structured DataFrame with the necessary columns for pivoting.
To continue talking to Dosu, mention @dosu.
Comment From: frabenetti
Hi, I have the very identical issue and I see you found the solution as well. I tested your solution and it works for me. It would be nice to have it fixed in a release
Best Regards Francesco
Comment From: rusackas
@frlm would you be willing to open a PR with the change? That would be fantastic, and could auto-close this issue if/when merged.
Comment From: rusackas
@frim @frabenetti do either of you have an easy to reproduce test case? It seems trivial to take this small change and open a PR, but it would be nice to have a failing unit test we can make pass here, or at least a way to manually test the PR for success.
CC @villebro @kgabryje in case either of you (or someone you can hot-potato this to) have any interest here.
Comment From: frlm
Hi, I'm sorry for the late, next week I will prepare a PR with the fix. Best regards
Il ven 15 nov 2024, 23:32 Evan Rusackas @.***> ha scritto:
@frim https://github.com/frim @frabenetti https://github.com/frabenetti do either of you have an easy to reproduce test case? It seems trivial to take this small change and open a PR, but it would be nice to have a failing unit test we can make pass here, or at least a way to manually test the PR for success.
CC @villebro https://github.com/villebro @kgabryje https://github.com/kgabryje in case either of you (or someone you can hot-potato this to) have any interest here.
— Reply to this email directly, view it on GitHub https://github.com/apache/superset/issues/30658#issuecomment-2480054582, or unsubscribe https://github.com/notifications/unsubscribe-auth/AWXUXJBUKEZSR3VNKJ7DH4D2AZZBLAVCNFSM6AAAAABQJ65EYOVHI2DSMVQWIX3LMV43OSLTON2WKQ3PNVWWK3TUHMZDIOBQGA2TINJYGI . You are receiving this because you were mentioned.Message ID: @.***>
Comment From: frlm
UPDATING implemented fix and added it in following PR: https://github.com/apache/superset/pull/30961
Title: fix(csv_export): use custom CSV_EXPORT parameters in pd.read_csv
Bug description
Function: apply_post_process
The issue is that pd.read_csv uses the default values of pandas instead of the parameters defined in CSV_EXPORT in superset_config. This problem is rarely noticeable when using the separator , and the decimal .. However, with the configuration CSV_EXPORT='{"encoding": "utf-8", "sep": ";", "decimal": ","}', the issue becomes evident. This change ensures that pd.read_csv uses the parameters defined in CSV_EXPORT.
Steps to reproduce error:
- Configure
CSV_EXPORTwith the following parameters: ```python CSV_EXPORT = { "encoding": "utf-8", "sep": ";", "decimal": "," } - Open a default chart in Superset of the Pivot Table type. In this example, we are using Pivot Table v2 within the USA Births Names dashboard:
-
Click on Download > Export to Pivoted .CSV
-
Download is blocked by an error.
Cause: The error is generated by an anomaly in the input DataFrame df, which has the following format (a single column with all distinct fields separated by a semicolon separator):
,state;name;sum__num
0,other;Michael;1047996
1,other;Christopher;803607
2,other;James;749686
Fix: Added a bug fix to read data with right CSV_EXPORT settings
Code Changes:
        elif query["result_format"] == ChartDataResultFormat.CSV:
            df = pd.read_csv(StringIO(data),
                             delimiter=superset_config.CSV_EXPORT.get('sep'),
                             encoding=superset_config.CSV_EXPORT.get('encoding'),
                             decimal=superset_config.CSV_EXPORT.get('decimal'))
Complete Code
def apply_post_process(
    result: dict[Any, Any],
    form_data: Optional[dict[str, Any]] = None,
    datasource: Optional[Union["BaseDatasource", "Query"]] = None,
) -> dict[Any, Any]:
    form_data = form_data or {}

    viz_type = form_data.get("viz_type")
    if viz_type not in post_processors:
        return result

    post_processor = post_processors[viz_type]

    for query in result["queries"]:
        if query["result_format"] not in (rf.value for rf in ChartDataResultFormat):
            raise Exception(  # pylint: disable=broad-exception-raised
                f"Result format {query['result_format']} not supported"
            )

        data = query["data"]

        if isinstance(data, str):
            data = data.strip()

        if not data:
            # do not try to process empty data
            continue

        if query["result_format"] == ChartDataResultFormat.JSON:
            df = pd.DataFrame.from_dict(data)
        elif query["result_format"] == ChartDataResultFormat.CSV:
            df = pd.read_csv(StringIO(data),
                             delimiter=superset_config.CSV_EXPORT.get('sep'),
                             encoding=superset_config.CSV_EXPORT.get('encoding'),
                             decimal=superset_config.CSV_EXPORT.get('decimal'))

        # convert all columns to verbose (label) name
        if datasource:
            df.rename(columns=datasource.data["verbose_map"], inplace=True)

        processed_df = post_processor(df, form_data, datasource)

        query["colnames"] = list(processed_df.columns)
        query["indexnames"] = list(processed_df.index)
        query["coltypes"] = extract_dataframe_dtypes(processed_df, datasource)
        query["rowcount"] = len(processed_df.index)

        # Flatten hierarchical columns/index since they are represented as
        # `Tuple[str]`. Otherwise encoding to JSON later will fail because
        # maps cannot have tuples as their keys in JSON.
        processed_df.columns = [
            " ".join(str(name) for name in column).strip()
            if isinstance(column, tuple)
            else column
            for column in processed_df.columns
        ]
        processed_df.index = [
            " ".join(str(name) for name in index).strip()
            if isinstance(index, tuple)
            else index
            for index in processed_df.index
        ]

        if query["result_format"] == ChartDataResultFormat.JSON:
            query["data"] = processed_df.to_dict()
        elif query["result_format"] == ChartDataResultFormat.CSV:
            buf = StringIO()
            processed_df.to_csv(buf)
            buf.seek(0)
            query["data"] = buf.getvalue()

    return result
Comment From: rusackas
The last PR link is still open, but is in need of a rebase. If anyone wants to review/update/rebase that, please be my guest, or we'd be open to a new/adopted PR applying the fix. If not, this might eventually be closed out as not-planned, since it's already been silent here for ~5 months.
Comment From: rusackas
Closing as not-planned (unless anyone wants to volunteer, in which case I'll happily reopen this!)