The benchmark is to call @Cacheable method: https://github.com/vlsi/aop-benchmarks/blob/f304fb811910aca8dd97c0fc0ced8d1b45d8a62b/src/main/java/io/github/vlsi/benchmarks/aop/cacheable/PlainCalculator.java#L6
Spring 6.2.9 + Java 21 results in ~500 bytes allocated per call.
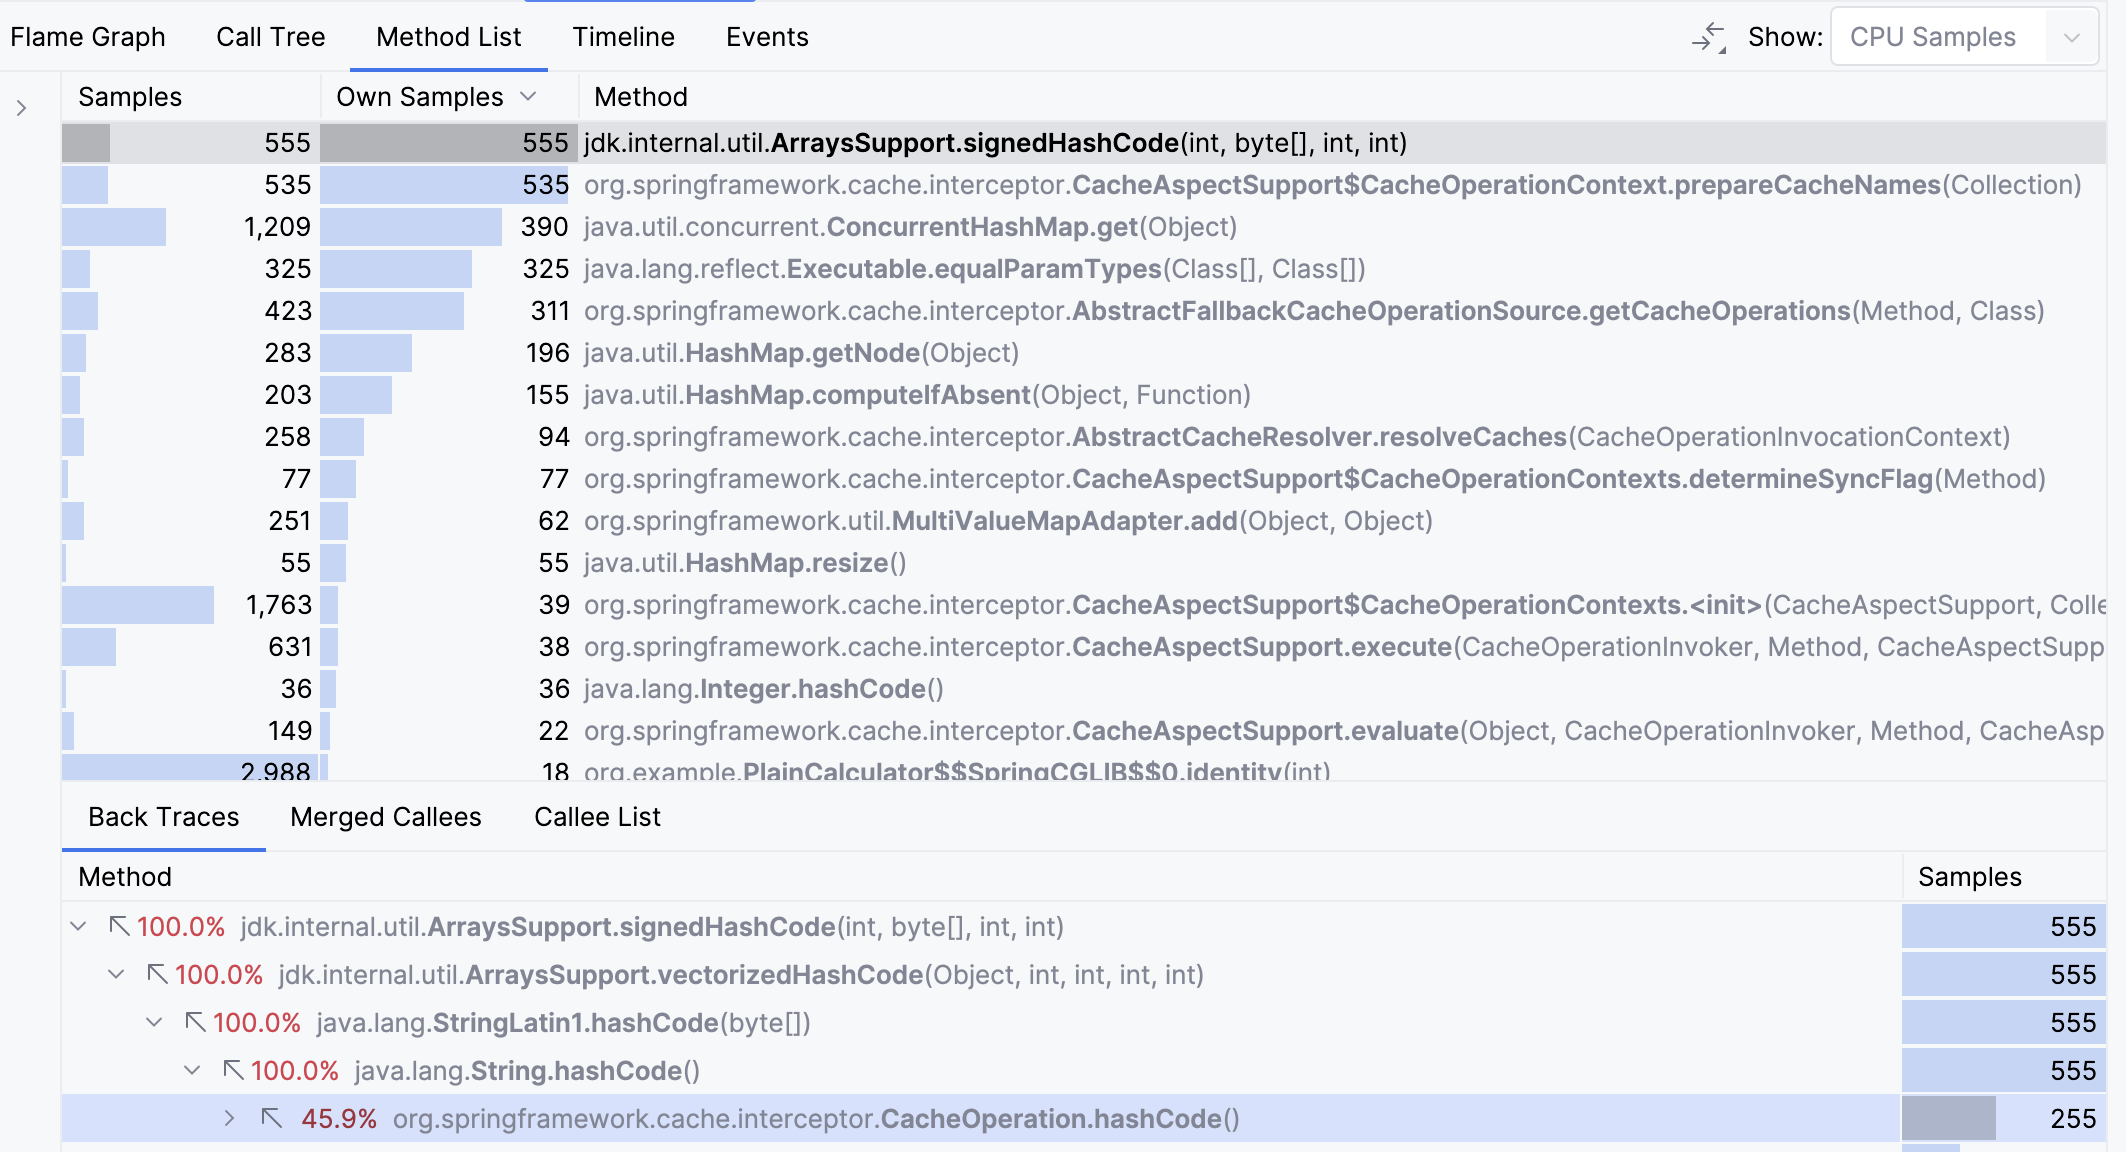
I see notable time is spent in hashCode: https://github.com/spring-projects/spring-framework/blob/8ec0c21b0a0ef6c725c27d787c4e27ae5fe328f4/spring-context/src/main/java/org/springframework/cache/interceptor/CacheOperation.java#L115C10-L115C18
I believe the root cause is that CacheOperation itself is not cached, so it results in building the new string every time, thus JVM has to recompute the string every time.
Of course, it would be nice to reuse CacheOperation, however, it might be a more significant change, so I suggest a simpler approach instead:
1) Build tostring lazily in case it would really be needed. I assume CacheOperation#toString() should never really be called in production
2) Compute the hashcode in the constructor based on the hashcodes of the components
3) Use subcomponents for equals instead of toString().equals(that.toString())
Note: I believe the issue was not fixed with https://github.com/spring-projects/spring-framework/pull/957 as #957 did not remove toString() from the hot path.
Profiling results
This was profiled with async-profiler 4, macOS, Java 21
Async profiler results (in JFR format): cacheable_jfrs.zip
Comment From: jhoeller
As far as I was able to test, CacheOperation instances get consistently reused. So it seems that the problem in your profiling scenario is not recalculation of the same CacheOperation Strings but rather unintended reinstantiation of CacheOperation instances or some other String hashCode calculations showing up?
Comment From: vlsi
It its strange that the profiler attributes CacheOperation->String.hashCode. Will analyze it later