Screenshot
Description
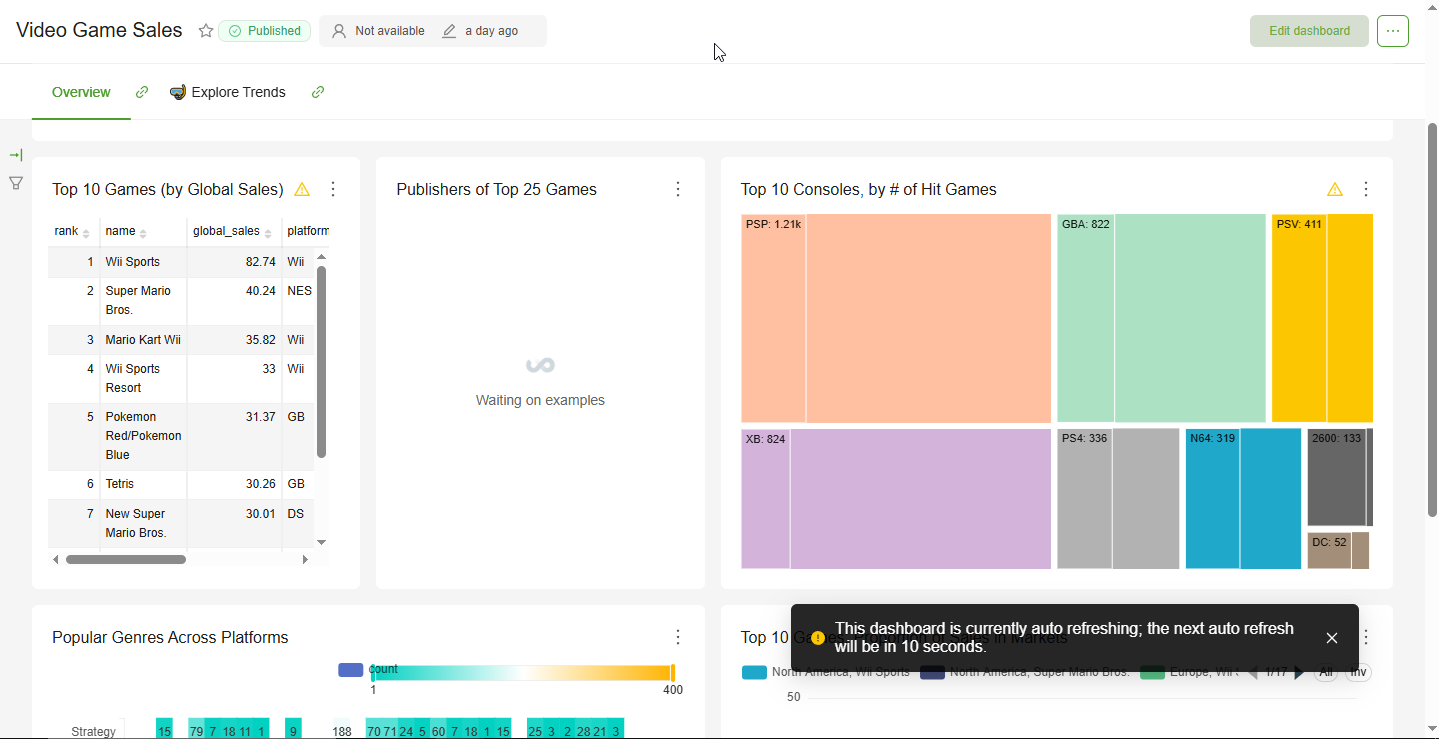
Currently, when a dashboard refreshes, Superset hides each chart and shows only the loading animation until the new data is rendered. On dashboards with multiple charts refreshing at different speeds, this can cause noticeable flickering and distracting visual changes, especially for users who monitor dashboards continuously.
Are there any specific reasons for fully hiding charts during refresh beyond emphasizing the loading state and ensuring loading animation visibility?
Proposed Improvement
In many use cases, keeping the previous chart visible until the updated data is ready would create a more subtle, less disruptive user experience. This way, users would simply see the chart update once the refresh completes, without repeated disappear/reappear cycles. If the main concern with preserving chart visibility is ensuring that the loading animation remains noticeable, a more flexible approach could be to allow configuring the loading indicator’s position and style — for example, placing it in a specific location within the chart area (e.g. header whitespace in the chart corner), so it remains visible without interfering with the chart content. This would keep the loading feedback clear and accessible while minimizing disruption to users who are actively monitoring dashboards.
Some things I have done
For our needs, I’ve modified the Chart.tsx component to call renderChartContainer() even during loading, overlaying the chart with the loading animation instead of replacing it. This could be considered as a potential default behavior in Superset.
However, the most flexible approach would be to make this configurable — for example, adding a checkbox in the "Edit chart" options to allow users to choose whether charts remain visible during refresh. I’ve tested this by:
1. Adding a new CheckboxControl in sharedControls.tsx
2. Accessing the checkbox control’s value from formData in Chart.tsx to control renderChartContainer() based on the user’s choice and loading state
3. Updating controlPanel.tsx for the desired chart type to include the new control
However, this currently requires applying step 3 to each chart type’s controlPanel.tsx. Is there a more efficient way to make this available across all chart types?
Design input
What is the Superset team’s opinion and vision on this? If you agree this could improve UX, I’m happy to open a PR with an implementation. @kasiazjc @rusackas @mistercrunch
Thanks in advance! Best regards!
Comment From: dosubot[bot]
There aren't any technical or architectural constraints forcing Superset charts to be hidden during refresh—the current approach is mainly a traditional UX choice to clearly indicate loading and avoid showing potentially stale or inconsistent visuals. The logic in Chart.tsx and ChartRenderer.jsx fully replaces the chart with a loading spinner when chartStatus is 'loading', which causes the flickering you described on dashboards with many charts refreshing at different times. There's no built-in option to preserve chart visibility during refresh, but overlaying a loading indicator on top of the existing chart is entirely feasible and can be implemented by adjusting the render logic in these components (source).
Controls in Superset are defined as reusable components, but each chart type's control panel is configured separately. However, you can define a new global control in controls.jsx and reference it in multiple chart types, or potentially add it to a shared section if you want to make this option widely available without duplicating code (source). The codebase is modular enough that adding a global or per-chart toggle for this behavior should be straightforward and robust.
No documentation, tickets, or PRs were found that discuss or implement a configurable option for this, so your proposal would be a novel UX improvement for Superset.
To reply, just mention @dosu.
How did I do? Good | Irrelevant | Incorrect | Verbose | Hallucination | Report 🐛 | Other 


Comment From: rusackas
Totally agree, I've been hoping to tackle this for years. If superset could just pass through updated data to the root chart, we could animate that chart rather than reloading/refreshing. There are a slew of intriacies here, about how we tackle it, including tying it into the websocket from the Global Async Queries feature. It'll be a huge improvement, but for now, I'm thinking we tackle this as a feature request rather than a bug report. We're open to collaboration/contributions here.
Comment From: mistercrunch
It's good to know that it's working though! Maybe a more subtle, perhaps overlaid spinner on top of the chart would make sense? @kasiazjc
Comment From: rusackas
I'd vote for a spinner overlaid, and dimming/blurring it (leaving it displayed) while it loads, for now.
Comment From: mistercrunch
+1 on a spinner overlay + light blur or light opacity overlay.
NOTE: now that we have <StatefulChart />, i think it's the right place to do that!
Comment From: VasilijeBursac
@mistercrunch @rusackas
Sorry for the late response. I had to shift away from this for a while to focus on other tasks.
The simplest approach I came up with for our needs was to modify the Chart.tsx component to call renderChartContainer() even during loading, overlaying the chart with the loading animation instead of replacing it.
Specifically, I changed the following lines in Chart.tsx (specific lines are highlighted for easier navigation) https://github.com/apache/superset/blob/master/superset-frontend/src/components/Chart/Chart.tsx#L386-L388 to:
{this.renderChartContainer()}
{isLoading && this.renderSpinner(databaseName)}
While I do agree that adding a light blur or opacity overlay on the chart might improve the visibility of the spinner, it would still preserve the core problem of noticeable flickering and distracting visual changes, just to a lesser extent.
I’ve recorded a before-and-after comparison so you can see the difference and let me know what you think.
Before: https://github.com/user-attachments/assets/861f6081-6f53-48ca-a4a0-f3e2f68a1e61
After: https://github.com/user-attachments/assets/d7d5f628-31a9-4c1c-a0b0-fe2a406c0341
Comment From: mistercrunch
Looks great! Should probably open as a PR for review. We modernized the spinner recently and offer different options around size and a muted prop (50% transparency I think).
NOTE: I believe echarts and maybe other libs will be able to generate animations when fed a new data objects (if done properly), like bars in a bar chart animating to show the new data, no flickering involved. Unclear how various viz plugins will react, some might need a lower-level re-render, but would be nice to get this right. Picture a minute time grain bar chart where the last bar animates and grows on the most-recent bar on the chart as data load up, and bars migrate the the left as a new minute starts to accumulate :)
Comment From: NemesisMate
The chart flickering on each update is very annoying for constant refresh dashboards (e.g., every 10 seconds). In my case, I would prefer them not to show anything at all, just refresh with the new data (normally with animations disabled since many of them start from "zero"). Therefore, this feature would ideally come as an optional "flickering mode" that would be applied at chart/dashboard level and that allows multiple options (hide, blur, spinner overlay, none, ...).