Uncertainty intervals of forecast never goes negative.
How to reproduce the bug
1 Take any data that includes negative values. 2 Run a forecast, including uncertainty interval
Expected results
I'd expect the uncertainty to be around the forecast.
Actual results
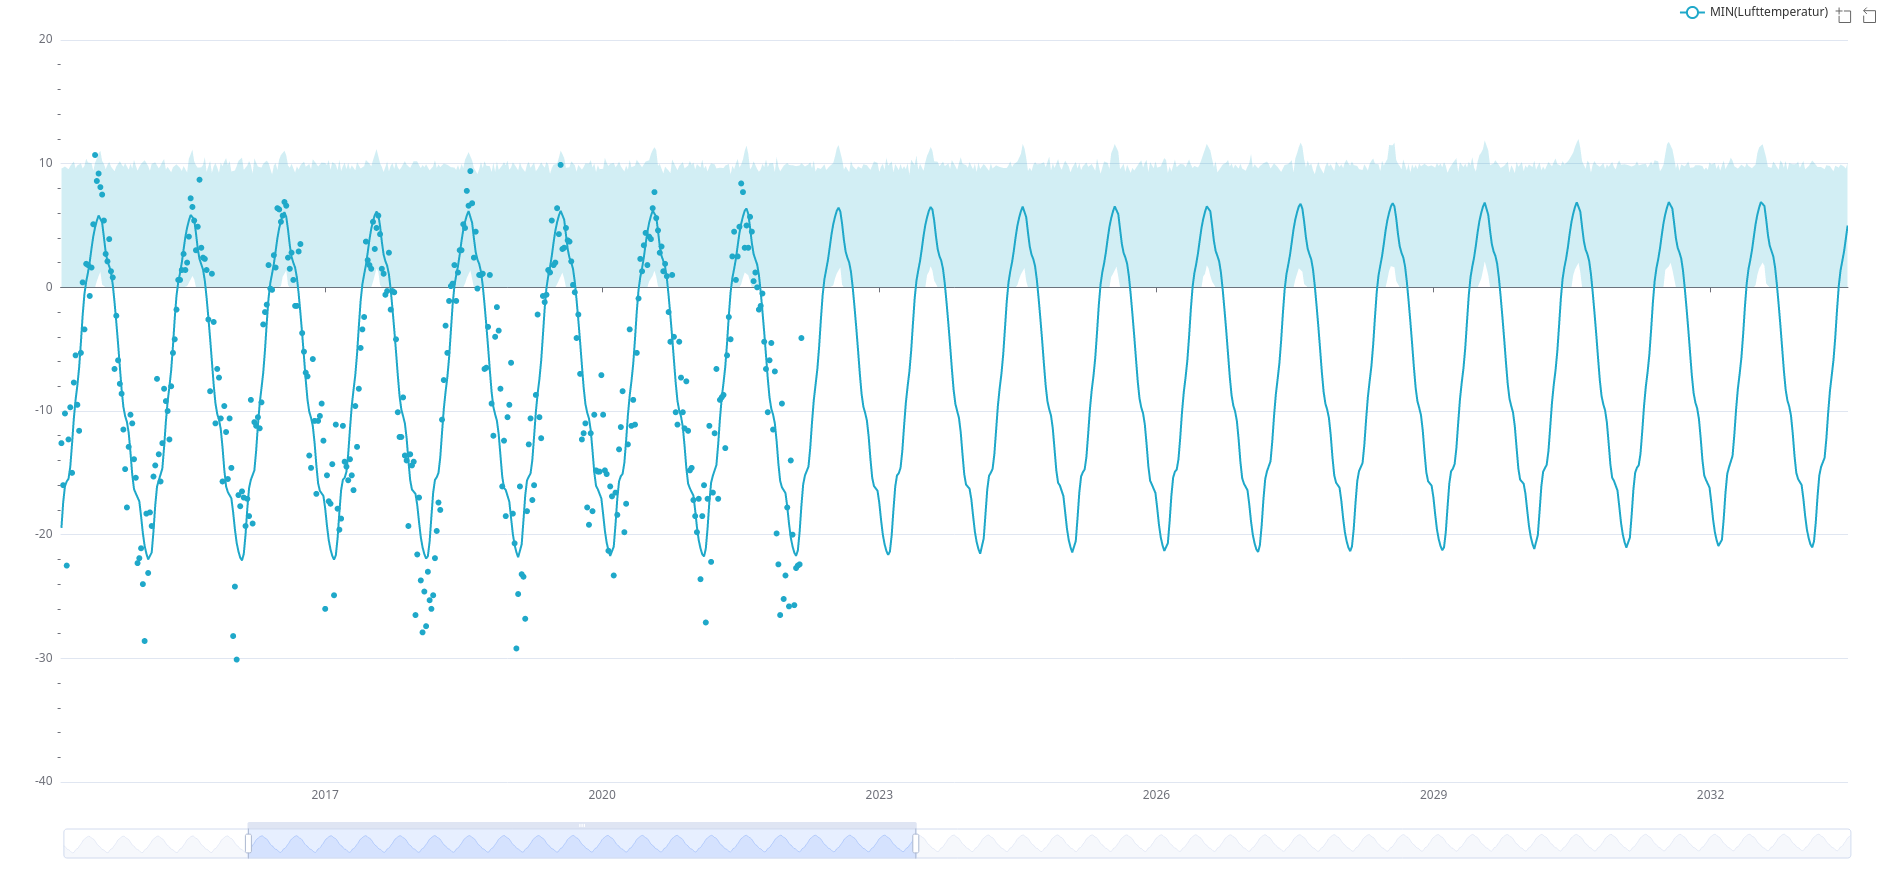
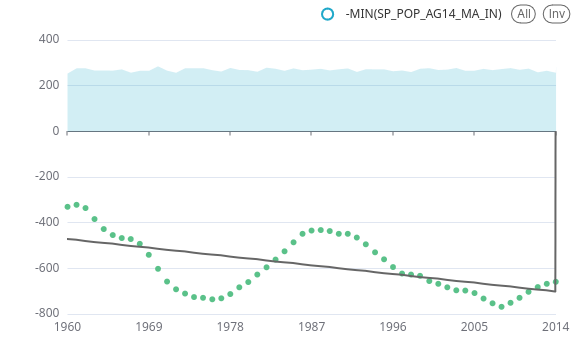
The uncertainty interval is clipped from below at 0, and behaves oddly.
Screenshots
Environment
(please complete the following information):
- browser type and version: Firefox 105.0.2
- superset version: 2.0.0
- python version: 3.8.14
- prophet version: 1.1.1
- any feature flags active: run as per the tutorial
Checklist
Make sure to follow these steps before submitting your issue - thank you!
- [x] I have checked the superset logs for python stacktraces and included it here as text if there are any.
- [x] I have reproduced the issue with at least the latest released version of superset.
- [x] I have checked the issue tracker for the same issue and I haven't found one similar.
Additional context
Here is some data one can use. I used Date as the X axis and min(temperature) for Y (days, weeks, or months, work fine). Note that using max(temperature) instead yields nice-looking results, since almost all of it is positive.
Comment From: ShaliniIruvuru
Hi it will be very help for us to resolve this issue if you provide detailed information,
Comment From: rusackas
I'm not sure if this is still an issue in current versions of Superset (3.x). If it is, we can re-open this, or feel free to open a new issue with updated context and a reproducible case using example data. We're no longer supporting Superset 2.x or prior, and it's been a while since this thread saw any activity, so I'm closing this as stale.
Comment From: Dapid
The problem is still here in 3.1. You need any data with negative values.
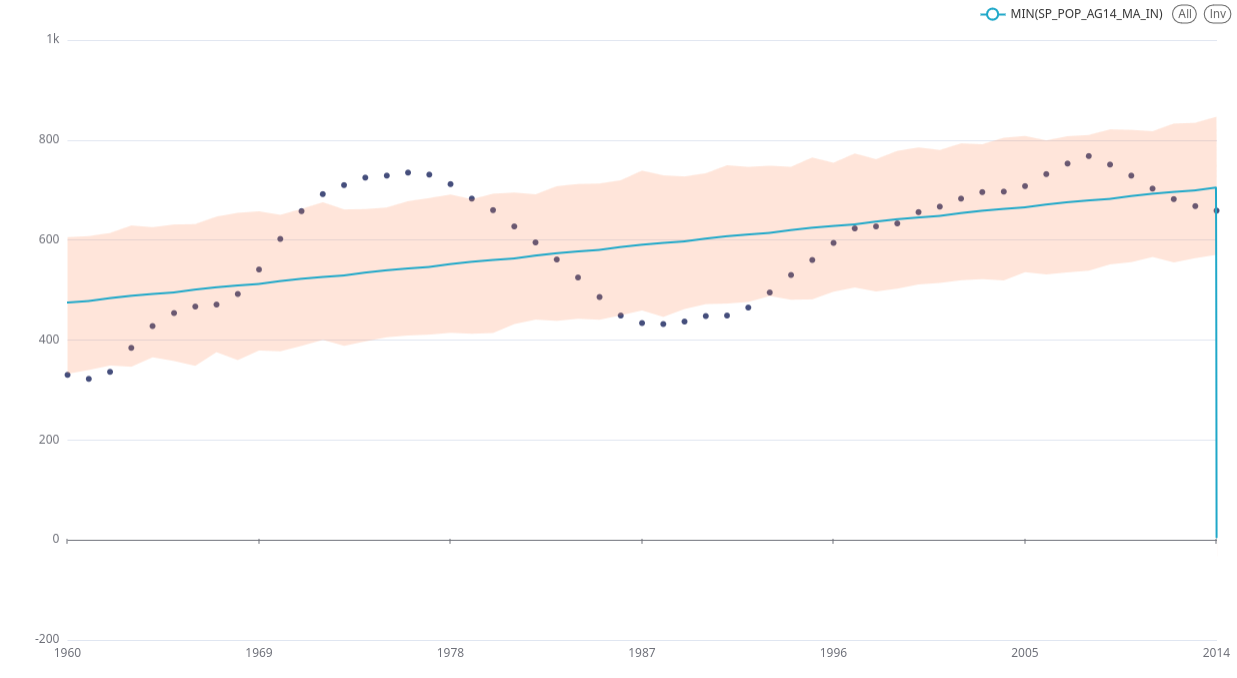
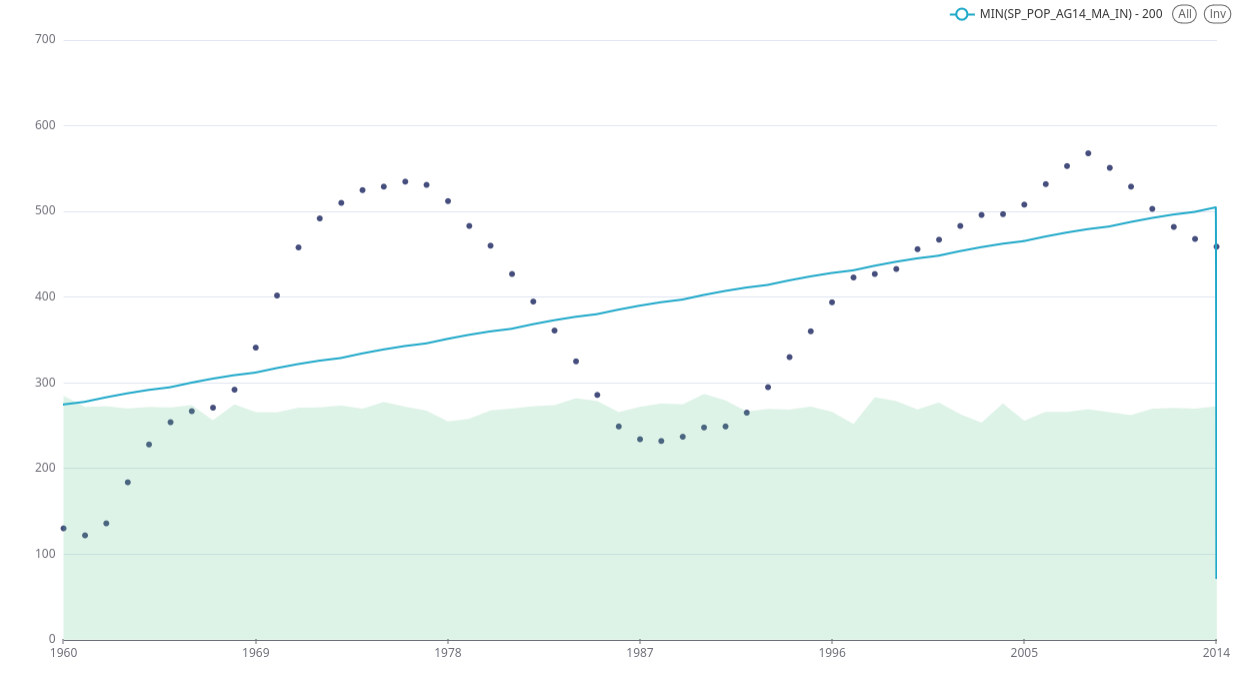
For example, creating a line chart based on this query, and adding a forecast works as expected:
SELECT DATETIME(year, 'start of day') AS year,
       MIN(SP_POP_AG14_MA_IN) AS "MIN(SP_POP_AG14_MA_IN)"
FROM main.wb_health_population
GROUP BY DATETIME(year, 'start of day')
ORDER BY "MIN(SP_POP_AG14_MA_IN)" DESC
LIMIT 10000
OFFSET 0;
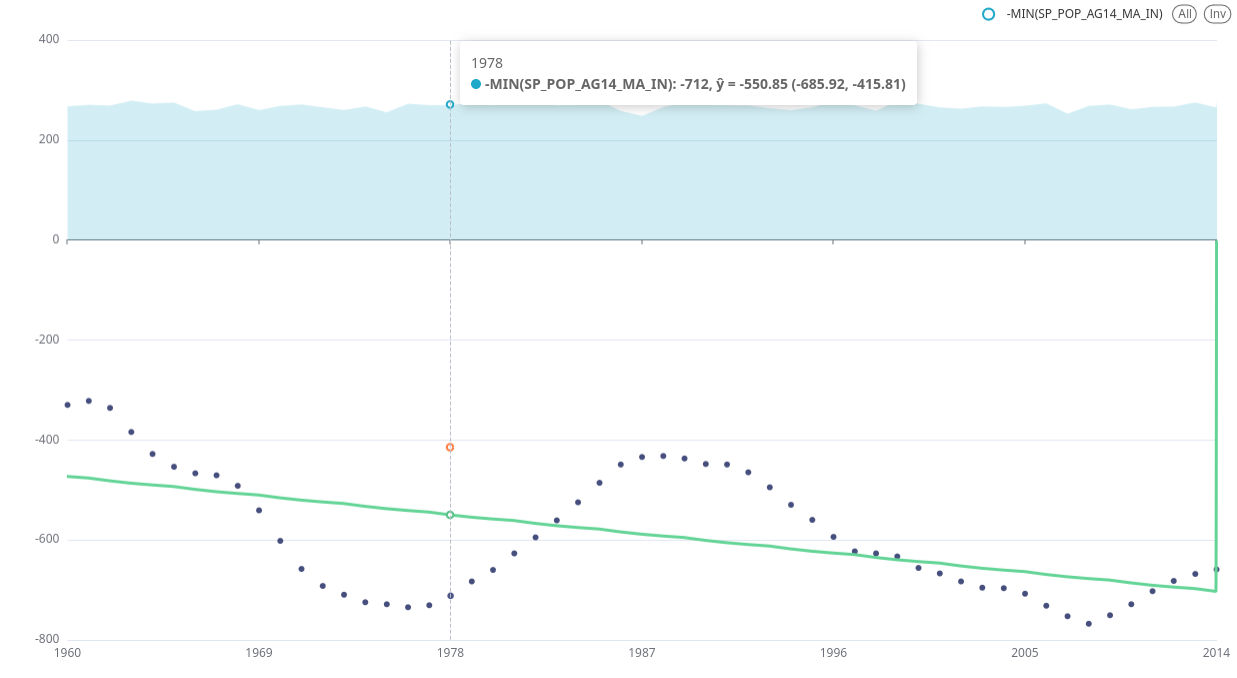
Changing the sign of the value yields instead:
And in fact, plotting MIN(SP_POP_AG14_MA_IN) - 170 works fine:
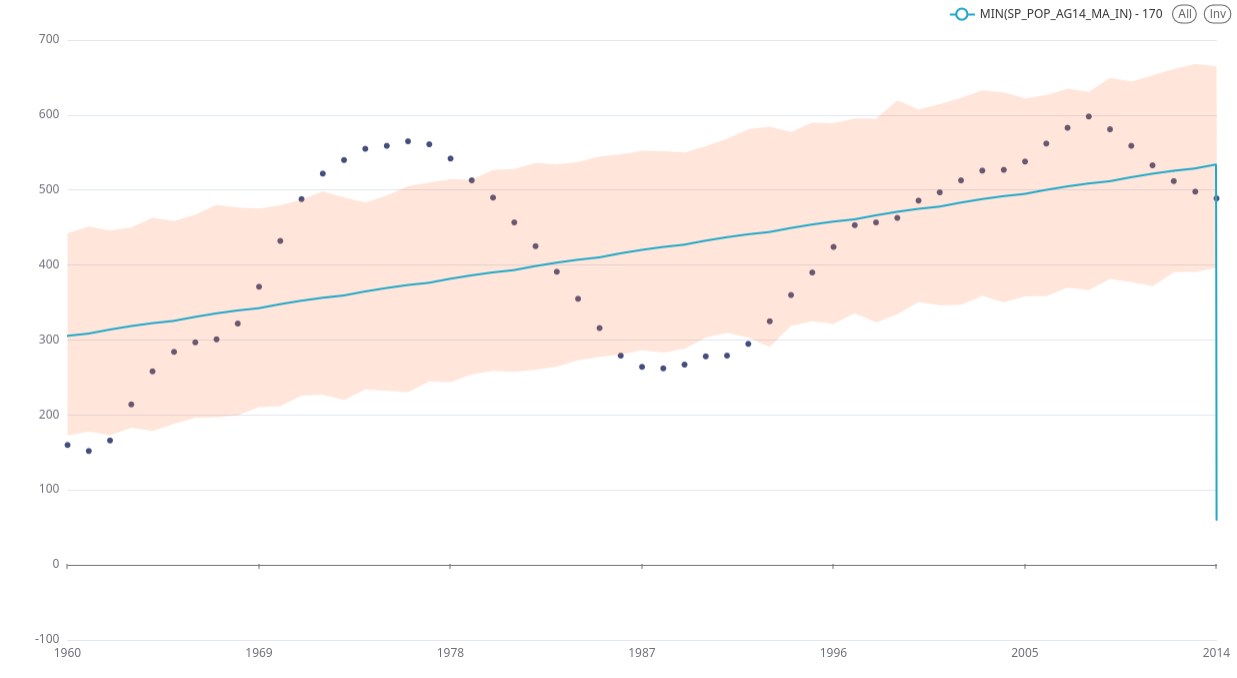
But plotting MIN(SP_POP_AG14_MA_IN) - 172 is odd again, even though there aren't any negative values.
Comment From: rusackas
Ahh, thanks for the context! Re-opening!
Comment From: rusackas
This issue has gone stale, but I'm hesitant to close it. Not sure if @villebro took a look at it and/or has any clues to go on.
Comment From: Dapid
The problem remains on v4.0.2.
I can't find where the plot is actually being done, so I haven' been able to track down the problem further. But I have checked the raw data, and prophet is modelling it correctly, is just the display.
The issue doesn't have much activity, but the bug persists, so I think closing it is wrong.
Comment From: rogerlga
I'm struggling with this issue as well. Any attention would be greatly appreciated.
Comment From: rusackas
Sorry this one hasn't been prioritized by the usual suspects (core committers). We're very much open to PRs here from anyone being affected by this. Might take some digging, but it might just languish here otherwise.
Comment From: Dapid
I tried to hunt it, but I got lost in the layers. Is there a developers guide or something that explains the structure of the code?
Comment From: javacatknight
Commenting, as I'm also interested in investigating but am a beginner (is there an introductory guide by any chance?)
I see that this issue was discussed and had some kind of fix in 2022 https://github.com/apache/superset/discussions/19145#discussioncomment-3591267 but further in the discussion, there are other recent reports of similar issues to Dapid's report.