Bug description
When plotting the bar chart using stack bars, the value of each bar is shown on top of the segment, rather than within the segment.

For example, in the screenshot above, the light blue bar (inbound) has a value of 75. The displayed text is in the navy blue bar, which could cause confusion.
How to reproduce the bug
- create a bar chart
- In Customize tab, select Show Value
- Change the stacked style to Stack
- un-select Only Total
Screenshots/recordings
No response
Superset version
3.0.4
Python version
3.9
Node version
16
Browser
Chrome
Additional context
No response
Checklist
- [ ] I have searched Superset docs and Slack and didn't find a solution to my problem.
- [ ] I have searched the GitHub issue tracker and didn't find a similar bug report.
- [ ] I have checked Superset's logs for errors and if I found a relevant Python stacktrace, I included it here as text in the "additional context" section.
Comment From: rusackas
This is interesting... I kind of agree that it should go above the bar if there's a single segment (often the case). If it's split like this, I agree, this is confusing, and it might make more sense inside the bar. Then again, that's an inconsistent behavior, which is also problematic. Also problematic is that if a bar segment is too short for the text, then where would it go?
This might warrant some competitive research to see how other libraries (or even default echarts) handle it. Maybe @kasiazjc has some opinions here?
Comment From: shexiaobin
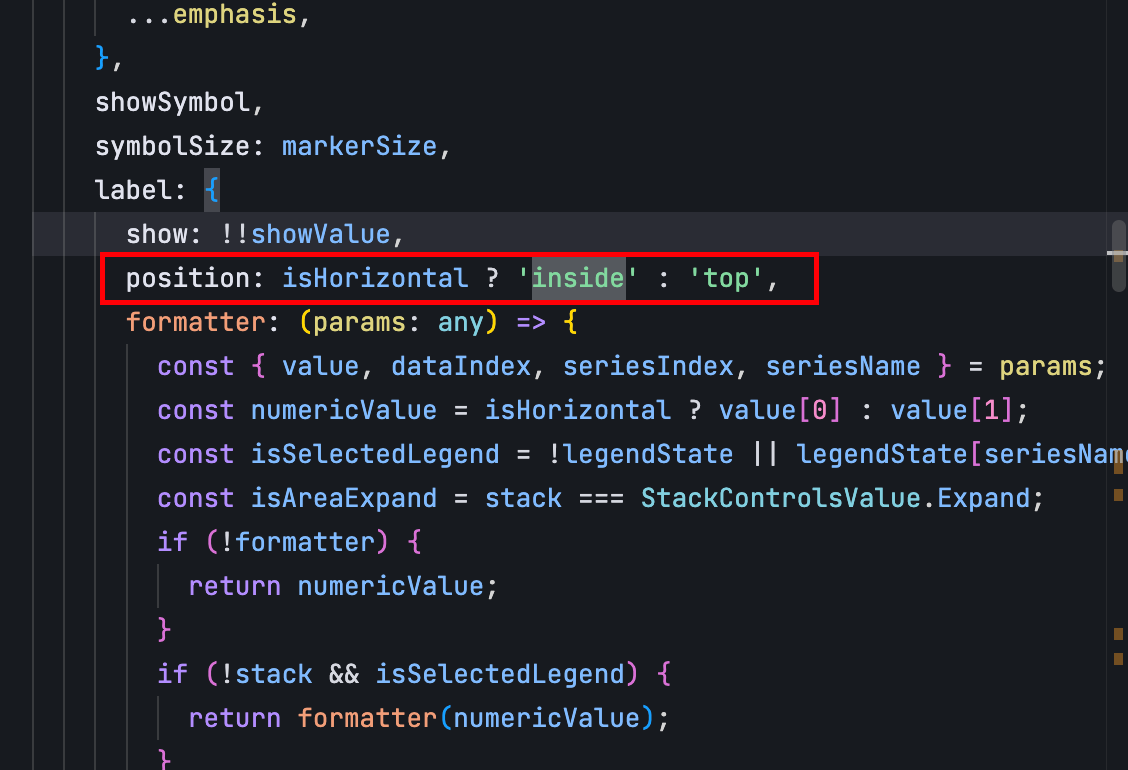
It is possible to attempt to solve the problem by modifying the source code. The solution is as follows: Locate the configuration file, which is superset-4.1.1/superset-frontend/plugins/plugin-chart-echarts/src/Timeseries/transformers.ts.
Replace the line "position: isHorizontal ? " with the appropriate code. 'right' : 'top', The position: isHorizontal ? 'inside' : 'top' will do. Just recompile the code.

Comment From: rusackas
Anyone want to open the suggested PR so we can close this out? Not sure if @kasiazjc has feelngs on moving the label.