A clear and concise description of what the bug is.
How to reproduce the bug
- Create two datasets and fill that with one column of same data on both datasets and different data on both datasets
- Create charts with both datasets
- Add Charts to dashboard
- try cross-filters between those two charts
Expected results
two chart successfully cross-filtered
Actual results
only chart with same table could be cross-filtered
do i hit a bug or this is work as intended?
Screenshots
If applicable, add screenshots to help explain your problem.
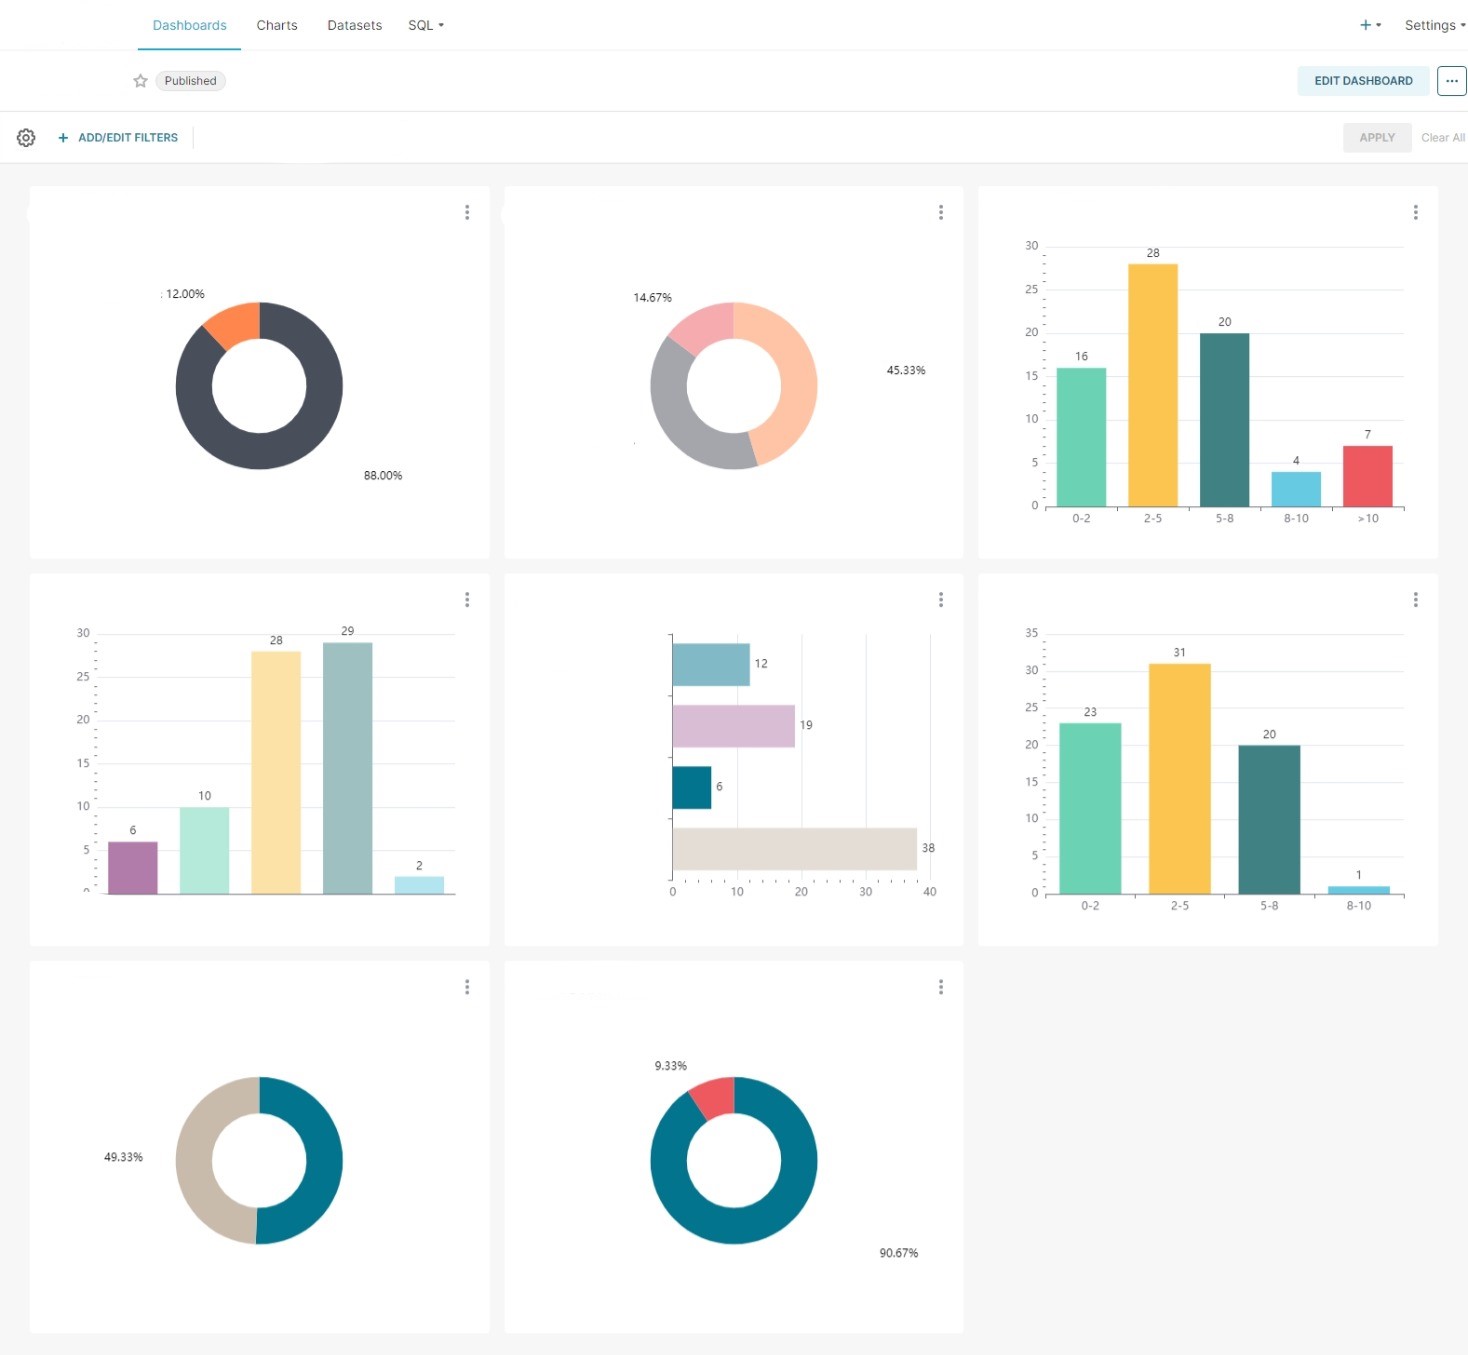
without cross-filter applied
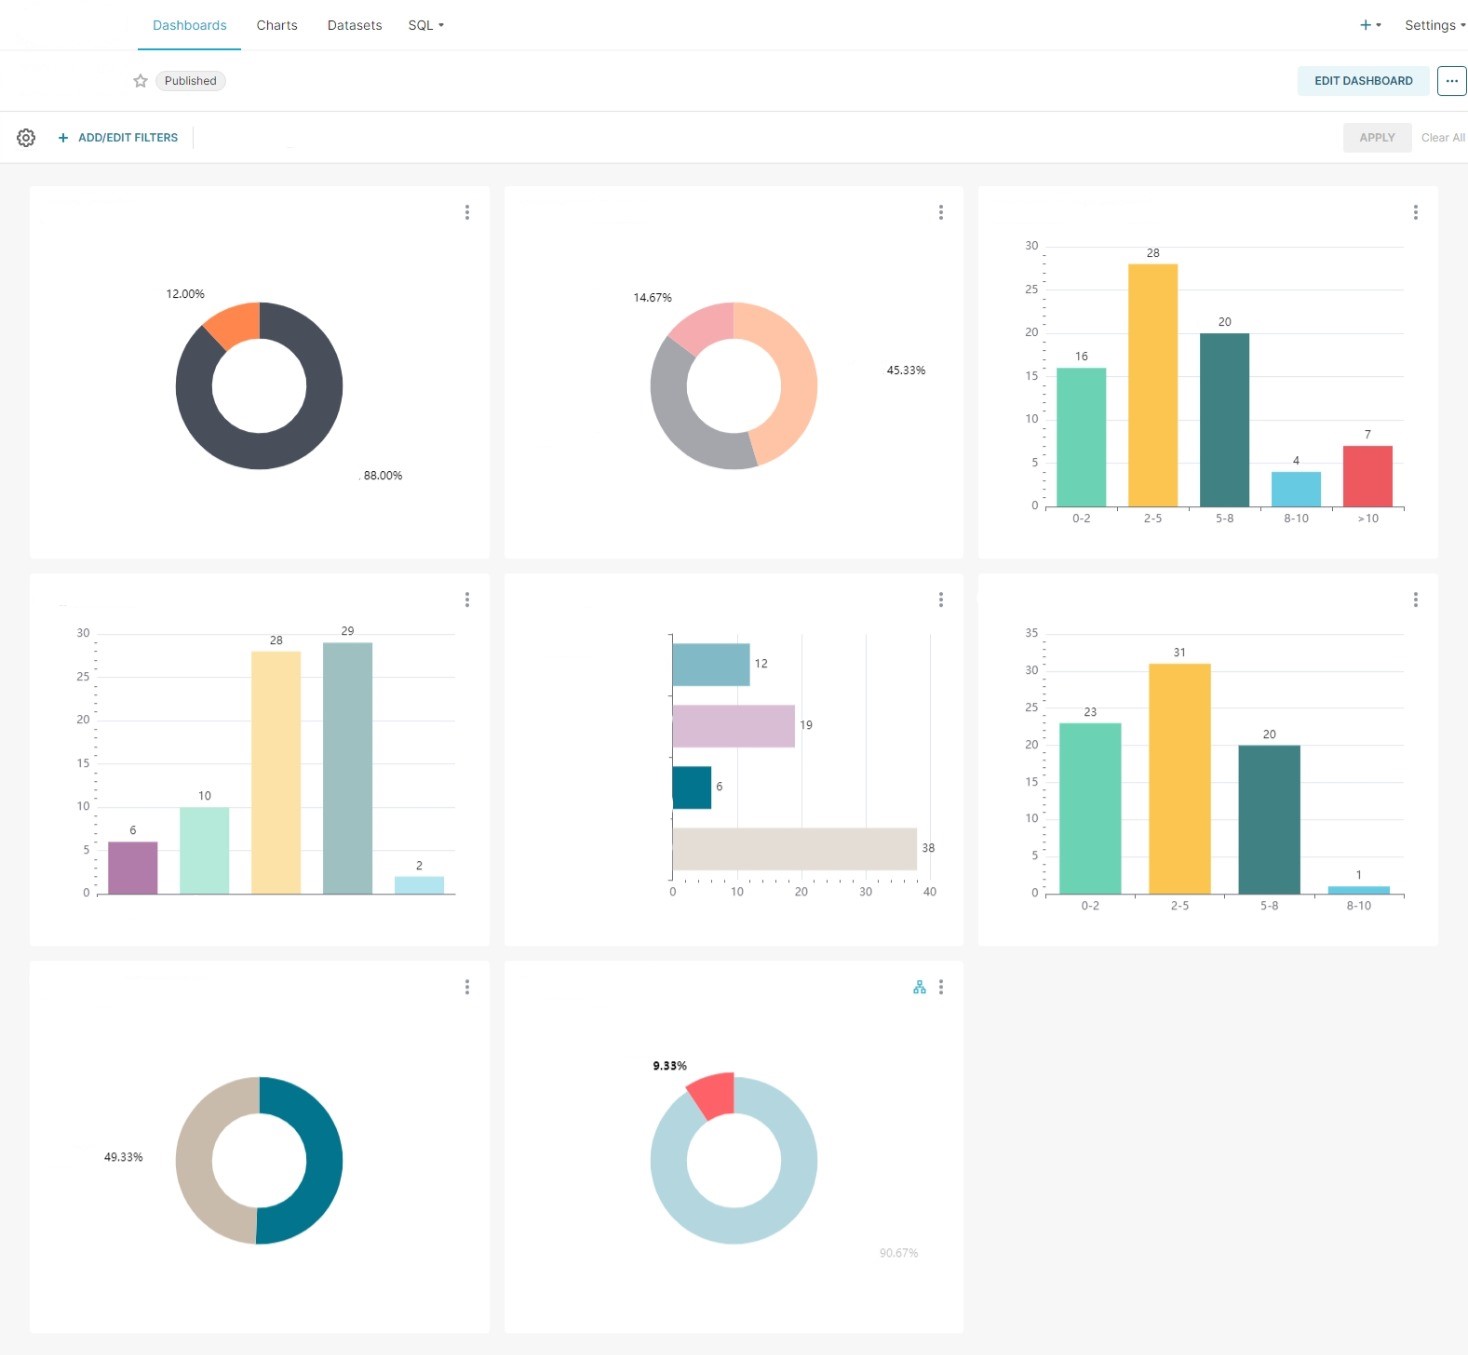
cross-filter applied to the chart on the bottom center of dashboard with different dataset as the rest of the charts
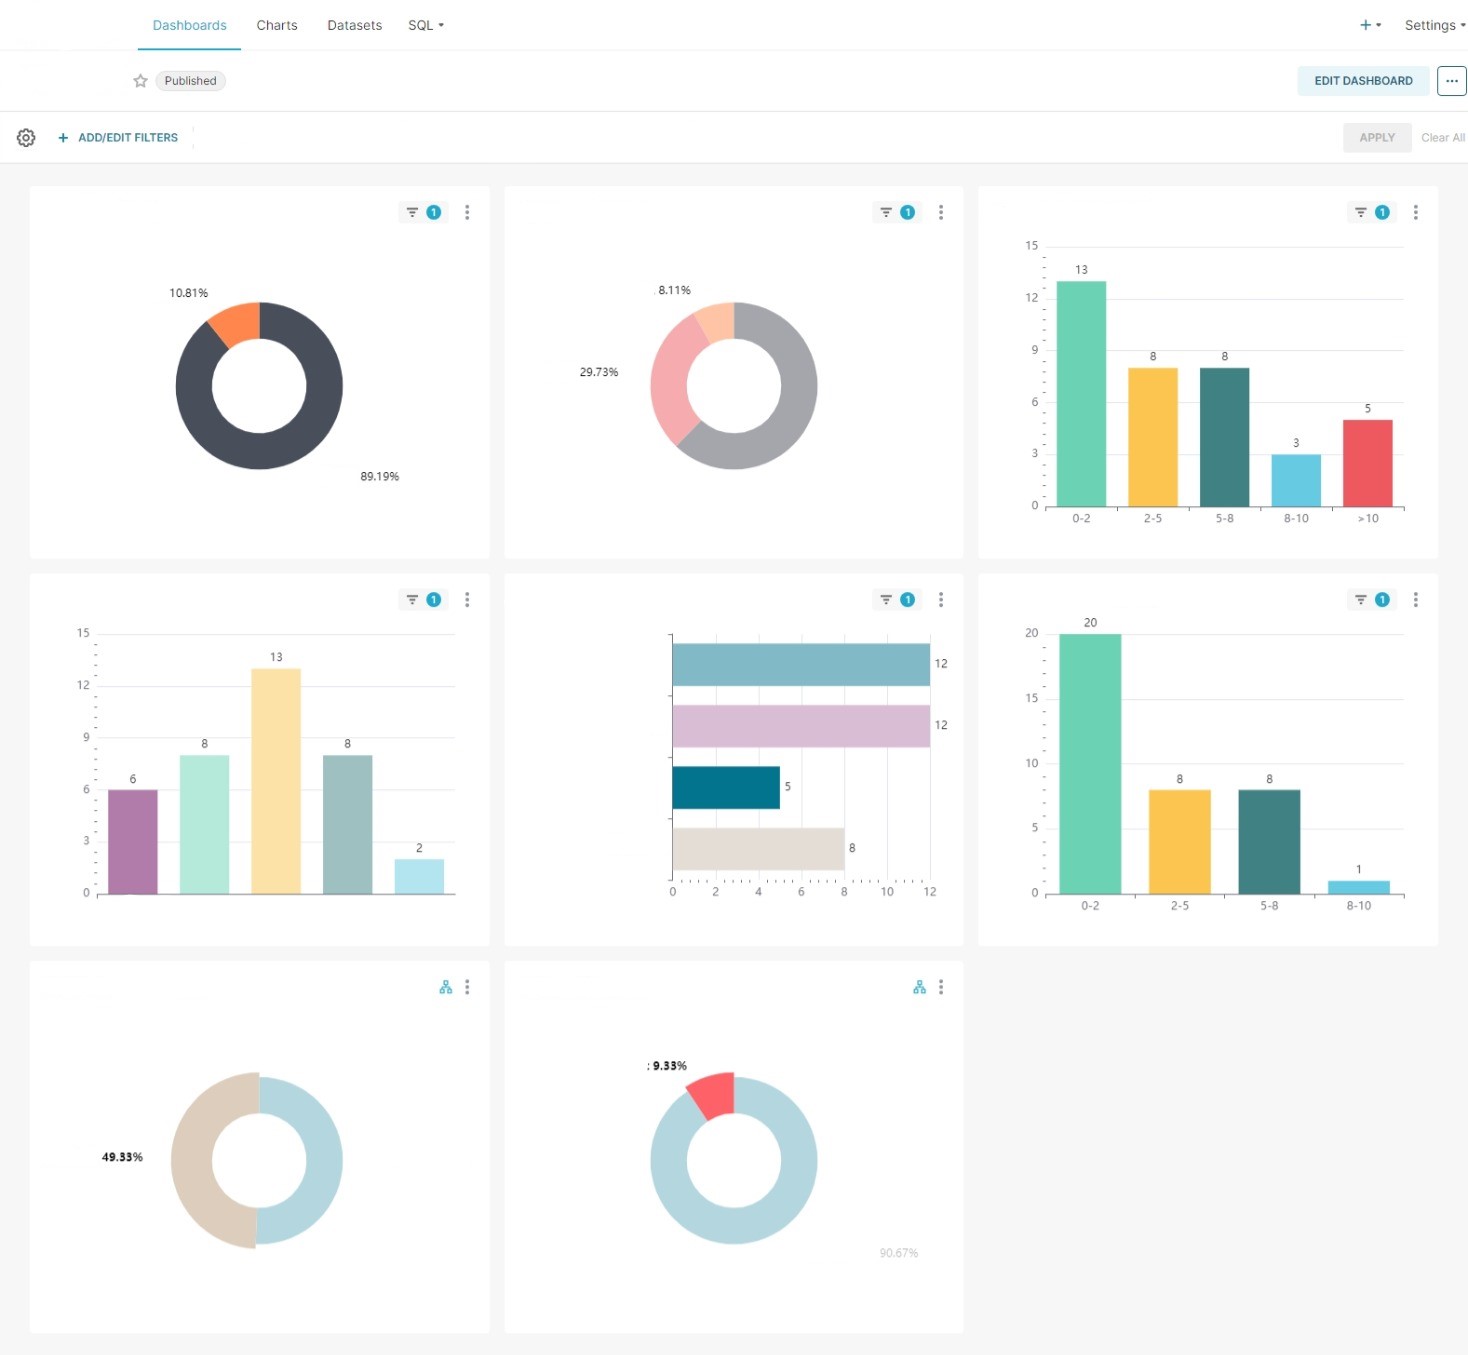
cross-filter applied to chart on the bottom left of dashboard with same dataset as the rest of the charts
Environment
(please complete the following information):
- browser type and version: edge 119.0.2151.44
- superset version: 3.0.0
- python version:
python --version - node.js version:
node -v - any feature flags active:
Checklist
Make sure to follow these steps before submitting your issue - thank you!
- [x] I have checked the superset logs for python stacktraces and included it here as text if there are any.
- [x] I have reproduced the issue with at least the latest released version of superset.
- [x] I have checked the issue tracker for the same issue and I haven't found one similar.
Additional context
on my observation with different dashboard it seem cross-filter should work with different datasets if only using same data across datasets like when using "name" because i had "name" column across datasets to cross-filter the chart and doesn't work when using dimensions like "place = japan"
Comment From: 0DGG
Any update on this? I think I'm facing a similar issue.
I tried adding two simple datasets and corresponding graph. They both have a common column.
For simplicity, let's say a Drinks and a Diet dataset with EmployeeId as a common column. I added the Drinks filter, the Diet filter and a EmployeeId filter (this last one with the values dependent on the other filters). If I select a drink in the Drinks filter it updates only the Drinks chart and the dependent EmployeeId filter. If I select a diet in the Diet filter it updates only the Diets chart and the dependent EmployeeId filter.
Was looking for when I select any of the filters, it would update all charts since they have cross-filtering by the EmployeeId, in the same way they update the dependent EmployeeId filter.
Any ideia how that would work?
Thanks
Comment From: rusackas
I think that if the column name is in both datasets, filters should apply to both datasets (whether cross-filters or regular filters). It's a little hard to tell what the series/column names are here, since they aren't displayed. If you could let us know more detail about the column names, that would help. Also let us know if dashboard filters are working as expected, or if it's just a cross-filter issue. Thanks!
Comment From: rusackas
It's been nearly a year without response to the above, and we no longer support 3.0, so I'll close this, but we can revisit/reopen with updated context pertaining to 4.1.1 or newer if it's still an issue.
Comment From: personofnorank
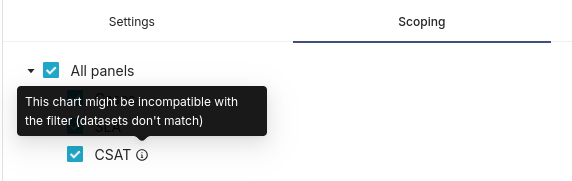
I believe I have just encountered this issue in 5.0.0. I have a dashboard using two datasets containing a column of the same name (account) and type (varchar). The dashboard has cross-filtering enabled, and a value filter on that field. Depending on which dataset I select in the filter configuration, the filter is only ever applied to the charts using that dataset and not the other one. There is an info message in the scoping section over the charts that don't use the dataset selected in the filter configuration, saying "This chart might be incompatible with the filter (datasets don't match)". I have had this work in the past and I'm not sure what is different in this instance.