Go version
go1.20 - go 1.24 linux/amd64
Output of go env in your module/workspace:
AR='ar'
CC='clang'
CGO_CFLAGS='-O2 -g'
CGO_CPPFLAGS=''
CGO_CXXFLAGS='-O2 -g'
CGO_ENABLED='1'
CGO_FFLAGS='-O2 -g'
CGO_LDFLAGS='-O2 -g'
CXX='clang++'
GCCGO='gccgo'
GO111MODULE=''
GOAMD64='v1'
GOARCH='amd64'
GOAUTH='netrc'
GOBIN=''
GOCACHE='/Users/edy/Library/Caches/go-build'
GOCACHEPROG=''
GODEBUG=''
GOENV='/Users/edy/Library/Application Support/go/env'
GOEXE=''
GOEXPERIMENT=''
GOFIPS140='off'
GOFLAGS=''
GOGCCFLAGS='-fPIC -arch x86_64 -m64 -pthread -fno-caret-diagnostics -Qunused-arguments -fmessage-length=0 -ffile-prefix-map=/var/folders/kc/p5h1tshd1r5dldk97dglrgrh0000gn/T/go-build2170672662=/tmp/go-build -gno-record-gcc-switches -fno-common'
GOHOSTARCH='amd64'
GOHOSTOS='darwin'
GOMOD='/dev/null'
GOMODCACHE='/Users/edy/go/pkg/mod'
GOOS='linux'
GOPATH='/Users/edy/go'
GOPROXY='https://goproxy.cn,direct'
GOROOT='/usr/local/go'
GOSUMDB='sum.golang.org'
GOTELEMETRY='local'
GOTELEMETRYDIR='/Users/edy/Library/Application Support/go/telemetry'
GOTMPDIR=''
GOTOOLCHAIN='auto'
GOTOOLDIR='/usr/local/go/pkg/tool/darwin_amd64'
GOVCS=''
GOVERSION='go1.24.6'
GOWORK=''
PKG_CONFIG='pkg-config'
What did you do?
package main

import (
    "fmt"
    "net/http"
    _ "net/http/pprof"
    "os"
    "runtime"
    "runtime/trace"
    "sync"
    "time"

    "github.com/go-resty/resty/v2"
)

var (
    profilingOnce sync.Once
)

func CpuProfiling() {
    profilingOnce.Do(func() {
        profilingDone := make(chan struct{})
        timestamp := time.Now().Format("2006-01-02-15-04-05")
        //profFileName := fmt.Sprintf("cpu-%s.prof", timestamp)
        profFileName := fmt.Sprintf("trace-%s.out", timestamp)
        f, err := os.Create(profFileName)
        if err != nil {
            fmt.Println("create cpu profile file error:", err)
            close(profilingDone)
            return
        }
        defer f.Close()
        fmt.Print("Timestamp:", time.Now().Format("2006-01-02 15:04:05"))
        fmt.Println(" Profiling start")
        if err := trace.Start(f); err != nil {
            //if err := pprof.StartCPUProfile(f); err != nil {
            fmt.Println("start cpu profile error:", err)
            close(profilingDone)
            return
        }

        go func() {
            time.Sleep(3 * time.Second)
            fmt.Print("Timestamp:", time.Now().Format("2006-01-02 15:04:05"))
            fmt.Println(" Profiling stopped after 3 seconds")
            //pprof.StopCPUProfile()
            trace.Stop()
            fmt.Print("Timestamp:", time.Now().Format("2006-01-02 15:04:05"))
            fmt.Println(" Profiling stopped")
            close(profilingDone)
        }()

        // 等待profiling完成
        <-profilingDone
    })

}

func main() {
    runtime.GOMAXPROCS(runtime.NumCPU())

    // 启动HTTP服务器用于pprof
    go func() {
        fmt.Println("Starting pprof server on :6060")
        if err := http.ListenAndServe(":6060", nil); err != nil {
            fmt.Printf("pprof server error: %v\n", err)
        }
    }()

    //client := httpclient.NewRestyClientWithDNSCache()
    client := resty.New()
    //client := xhttp.Client(context.Background())
    var lock sync.RWMutex
    dnsMaxDelay := float64(0)

    ticker := time.NewTicker(time.Second / 6000)
    defer ticker.Stop()

    requestChan := make(chan int, 100000)
    go func() {
        for i := 0; ; i++ {
            select {
            case <-ticker.C:
                requestChan <- i
            }
        }
    }()

    for {
        select {
        case i := <-requestChan:
            go func() {
                //resp, _ := xhttp.Client(context.TODO()).DNSCache(false).Request().

                resp, _ := client.R().EnableTrace().
                    Get("http://host:8080/api/test")
                ti := resp.Request.TraceInfo()
                d := ti.DNSLookup.Seconds() * float64(1000)
                lock.Lock()
                if d > dnsMaxDelay {
                    dnsMaxDelay = d
                }
                lock.Unlock()
                if d > 300 {
                    fmt.Print("Timestamp:", time.Now().Format("2006-01-02 15:04:05"))
                    fmt.Print(", Request #", i)
                    fmt.Print(", Status Code: ", resp.StatusCode())
                    fmt.Print(", DNSLookup: ", d)
                    fmt.Println(", MaxDNSLookup: ", dnsMaxDelay)
                    // start profiling
                    CpuProfiling()
                }
            }()
        default:
            continue
        }
    }
}

type User struct {
    ID    int            `json:"id"`
    Name  string         `json:"name"`
    Tags  []string       `json:"tags"`
    Extra map[string]any `json:"extra"`
}
What did you see happen?
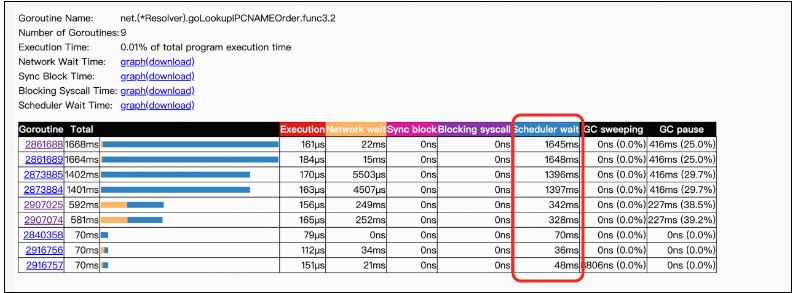
You need to replace the address used in the resty request in the above code with a URL that is accessible to you. After executing the code, within a few minutes, you will notice numerous DNS-related errors. These errors are not caused by the resty package but are due to delays in the Go scheduler. The documentation provides detailed troubleshooting steps.
What did you expect to see?
We hope the official team can optimize this issue in future versions, as using Go’s standard net package for HTTP requests is a widespread scenario that may affect a large number of Go developers. We look forward to seeing better and improved versions of the Go language in the future.
Comment From: keon2024
Comment From: seankhliao
If this isn't caused by resty, the reproducer shouldn't use it either.
Comment From: gabyhelp
Related Issues
- runtime/pprof: collecting mutex or block profiles add ~100ms of wall time #63078 (closed)
- net/http/pprof: Index doesn't include Symbol #69897 (closed)
- runtime/pprof: collecting a CPU profile takes ~200ms of wall time #63043
- net/http/pprof: Negative allocation counts produced by /debug/pprof/allocs?seconds=1 #49171 (closed)
- runtime: async preemption causes short sleep in tickspersecond #63103 (closed)
- net: netgo dns resolver latency / timeout issues #22406 (closed)
- runtime/pprof: under-samples work on short-lived threads #40435 (closed)
- runtime: unnecessary return in netpoll #49026
- runtime: cgo calls are way faster when enabling CPU profile #38325
- net: BSD: DNS go resolver loses first UDP outbound packet if onlink target not in neighbor cache #43398
(Emoji vote if this was helpful or unhelpful; more detailed feedback welcome in this discussion.)
Comment From: keon2024
If this isn't caused by resty, the reproducer shouldn't use it either.
I think what you said makes sense. I have revised the code accordingly—please take a look. If there are any further issues, feel free to reach out to me. (Since we initially encountered this issue while using the resty package, the demo was written based on it.)
package main

import (
    "fmt"
    "net/http"
    "net/http/httptrace"
    _ "net/http/pprof"
    "os"
    "runtime"
    "runtime/trace"
    "sync"
    "time"
)

var profilingOnce sync.Once

func CpuProfiling() {
    profilingOnce.Do(func() {
        timestamp := time.Now().Format("2006-01-02-15-04-05")
        f, err := os.Create(fmt.Sprintf("trace-%s.out", timestamp))
        if err != nil {
            fmt.Println("create trace file error:", err)
            return
        }
        defer f.Close()

        fmt.Println("Profiling start:", timestamp)
        if err := trace.Start(f); err != nil {
            fmt.Println("trace start error:", err)
            return
        }
        time.Sleep(3 * time.Second)
        trace.Stop()
        fmt.Println("Profiling stopped:", time.Now().Format("2006-01-02 15:04:05"))
    })
}

func main() {
    runtime.GOMAXPROCS(runtime.NumCPU())

    // pprof server
    go func() {
        fmt.Println("pprof server :6060")
        http.ListenAndServe(":6060", nil)
    }()

    client := &http.Client{Timeout: 5 * time.Second}

    var lock sync.RWMutex
    dnsMaxDelay := float64(0)

    ticker := time.NewTicker(time.Second / 6000) // 6000 QPS
    defer ticker.Stop()

    requestChan := make(chan int, 100000)
    go func() {
        for i := 0; ; i++ {
            <-ticker.C
            requestChan <- i
        }
    }()

    for {
        i := <-requestChan
        go func(id int) {
            var dnsStart, dnsEnd time.Time
            trace := &httptrace.ClientTrace{
                DNSStart: func(info httptrace.DNSStartInfo) {
                    dnsStart = time.Now()
                },
                DNSDone: func(info httptrace.DNSDoneInfo) {
                    dnsEnd = time.Now()
                },
            }

            req, _ := http.NewRequest("GET", "http://host:8080/api/test", nil)
            req = req.WithContext(httptrace.WithClientTrace(req.Context(), trace))

            resp, err := client.Do(req)
            if err == nil {
                resp.Body.Close()
            }

            if !dnsStart.IsZero() && !dnsEnd.IsZero() {
                d := dnsEnd.Sub(dnsStart).Seconds() * 1000 // ms
                lock.Lock()
                if d > dnsMaxDelay {
                    dnsMaxDelay = d
                }
                lock.Unlock()

                if d > 300 {
                    fmt.Printf("Timestamp:%s, Request #%d, DNSLookup: %.2f ms, MaxDNSLookup: %.2f ms\n",
                        time.Now().Format("2006-01-02 15:04:05"), id, d, dnsMaxDelay)
                    CpuProfiling()
                }
            }
        }(i)
    }
}
Comment From: keon2024
@seankhliao The following is the printed output after reproducing the issue using the native net package instead of the resty package.
Timestamp:2025-09-18 18:12:17, Request #6387884, DNSLookup: 368.00 ms, MaxDNSLookup: 4999.21 ms Timestamp:2025-09-18 18:12:17, Request #6387908, DNSLookup: 347.39 ms, MaxDNSLookup: 4999.21 ms Timestamp:2025-09-18 18:12:17, Request #6387874, DNSLookup: 377.27 ms, MaxDNSLookup: 4999.21 ms Timestamp:2025-09-18 18:12:17, Request #6387876, DNSLookup: 375.21 ms, MaxDNSLookup: 4999.21 ms Timestamp:2025-09-18 18:12:17, Request #6387877, DNSLookup: 374.19 ms, MaxDNSLookup: 4999.21 ms Timestamp:2025-09-18 18:12:17, Request #6387885, DNSLookup: 366.97 ms, MaxDNSLookup: 4999.21 ms Timestamp:2025-09-18 18:12:17, Request #6387886, DNSLookup: 365.92 ms, MaxDNSLookup: 4999.21 ms Timestamp:2025-09-18 18:12:17, Request #6387892, DNSLookup: 361.82 ms, MaxDNSLookup: 4999.21 ms Timestamp:2025-09-18 18:12:17, Request #6387891, DNSLookup: 361.80 ms, MaxDNSLookup: 4999.21 ms Timestamp:2025-09-18 18:12:17, Request #6387894, DNSLookup: 359.79 ms, MaxDNSLookup: 4999.21 ms Timestamp:2025-09-18 18:12:17, Request #6387887, DNSLookup: 364.87 ms, MaxDNSLookup: 4999.21 ms Timestamp:2025-09-18 18:12:17, Request #6387897, DNSLookup: 356.67 ms, MaxDNSLookup: 4999.21 ms Timestamp:2025-09-18 18:12:17, Request #6387899, DNSLookup: 355.65 ms, MaxDNSLookup: 4999.21 ms Timestamp:2025-09-18 18:12:17, Request #6387898, DNSLookup: 356.67 ms, MaxDNSLookup: 4999.21 ms Timestamp:2025-09-18 18:12:17, Request #6387861, DNSLookup: 388.71 ms, MaxDNSLookup: 4999.21 ms Timestamp:2025-09-18 18:12:17, Request #6387602, DNSLookup: 611.67 ms, MaxDNSLookup: 4999.21 ms Timestamp:2025-09-18 18:12:17, Request #6388882, DNSLookup: 300.14 ms, MaxDNSLookup: 4999.21 ms Timestamp:2025-09-18 18:12:17, Request #6388842, DNSLookup: 330.83 ms, MaxDNSLookup: 4999.21 ms Timestamp:2025-09-18 18:12:17, Request #6388878, DNSLookup: 308.86 ms, MaxDNSLookup: 4999.21 ms Timestamp:2025-09-18 18:12:17, Request #6388848, DNSLookup: 321.52 ms, MaxDNSLookup: 4999.21 ms Timestamp:2025-09-18 18:12:17, Request #6388846, DNSLookup: 322.23 ms, MaxDNSLookup: 4999.21 ms Timestamp:2025-09-18 18:12:17, Request #6388881, DNSLookup: 325.93 ms, MaxDNSLookup: 4999.21 ms Timestamp:2025-09-18 18:12:17, Request #6387895, DNSLookup: 358.74 ms, MaxDNSLookup: 4999.21 ms Timestamp:2025-09-18 18:12:17, Request #6388849, DNSLookup: 321.16 ms, MaxDNSLookup: 4999.21 ms Timestamp:2025-09-18 18:12:17, Request #6388852, DNSLookup: 320.13 ms, MaxDNSLookup: 4999.21 ms
Comment From: keon2024
Related Issues
- runtime/pprof: collecting mutex or block profiles add ~100ms of wall time #63078 (closed)
- net/http/pprof: Index doesn't include Symbol #69897 (closed)
- runtime/pprof: collecting a CPU profile takes ~200ms of wall time #63043
- net/http/pprof: Negative allocation counts produced by /debug/pprof/allocs?seconds=1 #49171 (closed)
- runtime: async preemption causes short sleep in tickspersecond #63103 (closed)
- net: netgo dns resolver latency / timeout issues #22406 (closed)
- runtime/pprof: under-samples work on short-lived threads #40435 (closed)
- runtime: unnecessary return in netpoll #49026
- runtime: cgo calls are way faster when enabling CPU profile #38325
- net: BSD: DNS go resolver loses first UDP outbound packet if onlink target not in neighbor cache #43398
(Emoji vote if this was helpful or unhelpful; more detailed feedback welcome in this discussion.)
net: netgo dns resolver latency / timeout issues #22406 (closed) Thank you. This issue is highly relevant to mine, but the reported problem occurred in a very old version (1.9) and appears to have been closed. However, I am still experiencing the issue on a much newer version (1.24.6). Currently, the only workaround is to implement local DNS caching.