Hello everyone,
Go text-based bench output is good, but not the best to compare. So a chart would be a great fit for it. I downloaded the BENCHMARKS.md file and ran the following command.
vizb BENCHMARKS.md -o output.html -p s_n
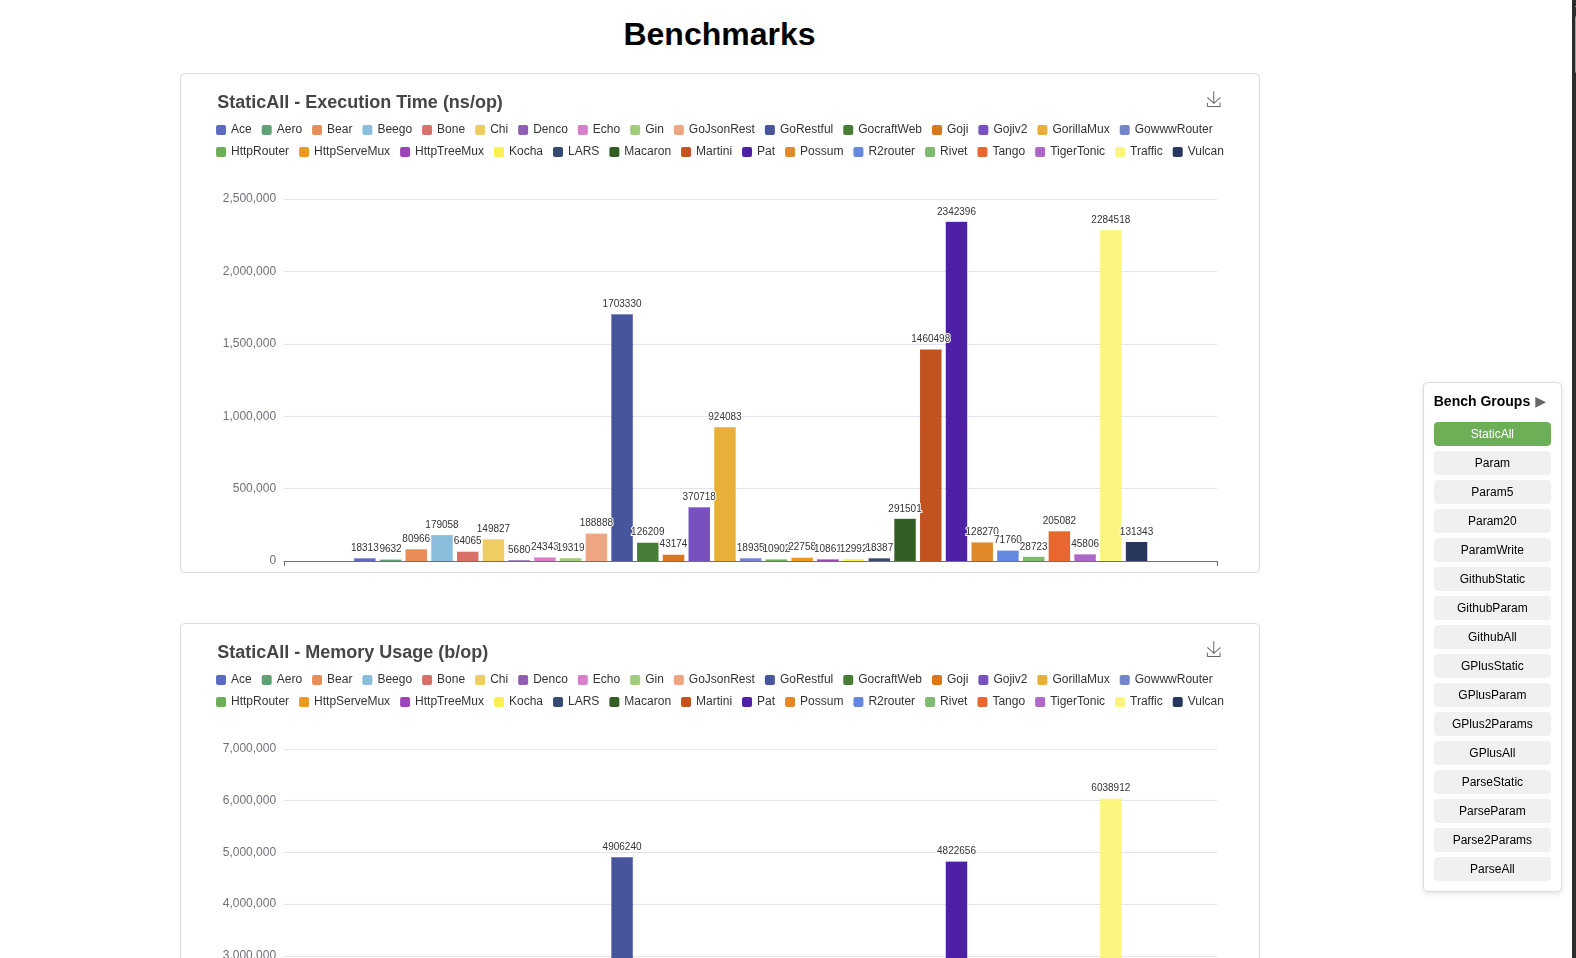
It generates this interactive chart: https://gin-benchmarks.netlify.app
the cli repo: https://github.com/goptics/vizb
Willing to hear your opinions on adding this chart link to the BENCHMARKS.md file.
Thank you!
Comment From: The5cheduler
I can contribute on this!