Pandas version checks
-
[X] I have checked that this issue has not already been reported.
-
[X] I have confirmed this bug exists on the latest version of pandas.
-
[X] I have confirmed this bug exists on the main branch of pandas.
Reproducible Example
import pandas as pd
import requests

# URL for data from University of California Irvine
url = 'https://archive.ics.uci.edu/ml/machine-learning-databases/00492/Metro_Interstate_Traffic_Volume.csv.gz'

file = 'Metro_Interstate_Traffic_Volume.csv.gz'

content = requests.get(url).content
with open(file, 'wb') as f:
    f.write(content)

df = pd.read_csv(file, compression='gzip')
  holiday    temp  rain_1h  snow_1h  clouds_all weather_main weather_description            date_time  traffic_volume
0     NaN  288.28      0.0      0.0          40       Clouds    scattered clouds  2012-10-02 09:00:00            5545
1     NaN  289.36      0.0      0.0          75       Clouds       broken clouds  2012-10-02 10:00:00            4516
2     NaN  289.58      0.0      0.0          90       Clouds     overcast clouds  2012-10-02 11:00:00            4767
3     NaN  290.13      0.0      0.0          90       Clouds     overcast clouds  2012-10-02 12:00:00            5026
4     NaN  291.14      0.0      0.0          75       Clouds       broken clouds  2012-10-02 13:00:00            4918
               temp       rain_1h       snow_1h    clouds_all  traffic_volume
count  48204.000000  48204.000000  48204.000000  48204.000000    48204.000000
mean     281.205870      0.334264      0.000222     49.362231     3259.818355
std       13.338232     44.789133      0.008168     39.015750     1986.860670
min        0.000000      0.000000      0.000000      0.000000        0.000000
25%      272.160000      0.000000      0.000000      1.000000     1193.000000
50%      282.450000      0.000000      0.000000     64.000000     3380.000000
75%      291.806000      0.000000      0.000000     90.000000     4933.000000
max      310.070000   9831.300000      0.510000    100.000000     7280.000000
Plotting
fig, (ax1, ax2) = plt.subplots(1, 2, figsize=(15, 6))
# pandas.DataFrame.plot / pandas.DataFrame.plot.hist
df.plot(kind='hist', column='traffic_volume', legend=False, ax=ax1)
ax1.bar_label(ax1.containers[0])
ax1.set_title('pandas.DataFrame.plot does not\nseem to correctly determine df.traffic_volume.max()')
# pandas.Series.plot / pandas.Series.plot.hist
df.traffic_volume.plot(kind='hist', ax=ax2)
_ = ax2.bar_label(ax2.containers[0])
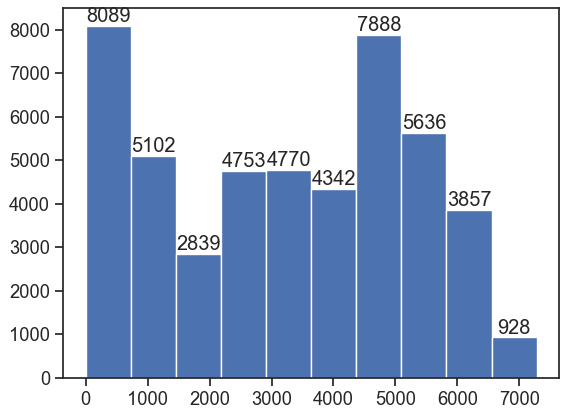
ax2.set_title('pandas.Series.plot produces the expected result')
Issue Description
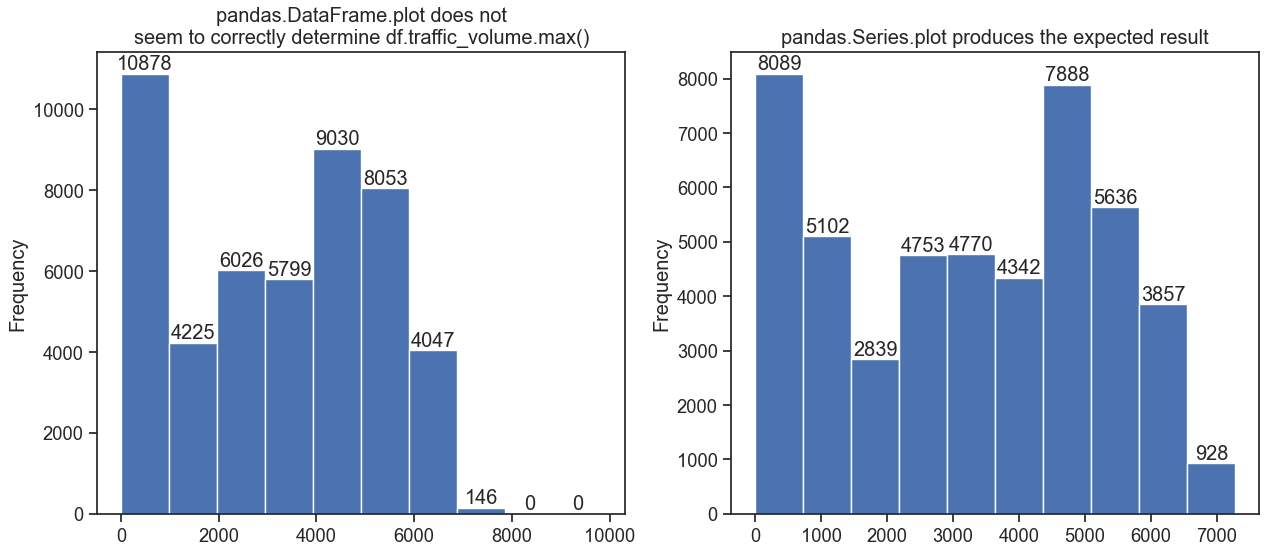
The plot produced by pandas.DataFrame.plot does not match the plot produced by pandas.Series.plot. kind='hist' for both.
Also see Different results when plotting histogram using DataFrame.plot.hist and Series.plot.hist
df[['traffic_volume', 'clouds_all']].plot(kind='hist', column='traffic_volume') produces the expected plot
df[['traffic_volume']].plot(kind='hist', column='traffic_volume') produces the expected plot
df[['traffic_volume', 'rain_1h']].plot(kind='hist', column='traffic_volume') produces the incorrect plot.
It seems def _calculate_bins applies to the entire numeric portion of the DataFrame, even if column='traffic_volume' is specified.
Expected Behavior
The expected behavior is the plot produced by pandas.Series.plot or matplotlib.axes.Axes.hist
pandas.DataFrame.hist and pandas.Series.hist also both produce the expected plot.
fig, ax = plt.subplots()
ax.hist(df.traffic_volume, bins=10)
_ = ax.bar_label(ax.containers[0])
I expect def _calculate_bins to calculate only on the specified columns, if column= is used. The column parameter here states If passed, will be used to limit data to a subset of columns.
Installed Versions
Comment From: mittal-aakriti
I tried to reproduce this issue but it seems like it's working correctly now, the plots using all the different methods mentioned above look correct. Is there anything else that needs to be done to close the issue?