The current catapult trace viewer is bit rotting and struggles with large traces. Perfetto UI could offer better performance and UX.
This was already proposed in https://github.com/golang/go/issues/57175 but no dedicated issue existed yet.
Also see https://github.com/golang/go/issues/57159 which could be a follow-up enhancement.
Comment From: gopherbot
Change https://go.dev/cl/457716 mentions this issue: cmd/trace: experimental support for perfetto
Comment From: felixge
The CL linked above implements a prototype for this. In practice it looks like this:
Notes on the big trace: - The catapult UI frequently freezes up completely while trying to view it. Perfetto seems to handle it without issues. I'm not showing it in the video because I don't want to share too much details from the big trace. - The perfetto integration currently requires two clicks. This perfetto-dev thread explains the underlaying browser popup blocking issue.
Comment From: ianlancetaylor
CC @golang/runtime
Comment From: prattmic
Thanks for filing this! We certainly need to replace Catapult and Perfetto is the best alternative that I have seen, so overall I am very supportive of this.
Regarding https://github.com/golang/go/issues/57315#issuecomment-1352369141, until recently I hadn't really considered adding Perfetto support without implementing the trace proto format (https://github.com/golang/go/issues/57159), as previously Perfetto didn't handle the JSON very well. But I tried again a few days ago, and it seems to work surprisingly well.
The Perfetto format looks daunting due to a huge number of custom event types for Chrome/Android [1], but the core ones (TracePacket, TrackEvent) seem straightforward, so I don't think that implementing proto support would be too difficult.
Perhaps we could add "experimental" links like in https://go.dev/cl/457716, and also work on the proto format. If both end up in the same release, great. If not, JSON is an OK fallback.
[1] These make me wonder if they would be open to adding Go-specific types for Ps and Gs rather than hacking them into existing constructs.
Comment From: prattmic
One issue I did see was that some (but not all) flow events displayed incorrectly.
For example, these events somehow became a loop in Perfetto?
Catapult:

Perfertto:

Comment From: felixge
Perhaps we could add "experimental" links like in https://go.dev/cl/457716, and also work on the proto format. If both end up in the same release, great. If not, JSON is an OK fallback.
Sounds good.
My colleague @nsrip-dd is already looking into the proto format. It looks daunting, but as you said, perhaps we just need to worry about a small subset of it.
One issue I did see was that some (but not all) flow events displayed incorrectly.
I could imagine other issues as well. I'm hesitant to spend a lot of time debugging this before we have a prototype for the protobuf format is ready. So maybe let's give that a few more weeks before deciding on the JSON option.
Meanwhile it would be great to know if the deep link integration itself seems okay. IMO the only thing that would have to change is the URLs if we switch to protobuf.
Comment From: prattmic
Meanwhile it would be great to know if the deep link integration itself seems okay. IMO the only thing that would have to change is the URLs if we switch to protobuf.
Of course I'd prefer a direct link, but from https://perfetto.dev/docs/visualization/deep-linking-to-perfetto-ui it seems like this is our only option, so it is what it is.
On the scalability front, it would be even better if Perfetto didn't need to load the entire trace up front and instead loaded only what it needed on demand, which would eliminate the need for us to cut the trace into chunks for the browser.
Perfetto has a tool [1] for this, where a local process parses the trace and the UI makes RPC queries against it for the current view. In an ideal world, go tool trace could implement that RPC interface to get a really streamlined browser experience.
Unfortunately, that RPC interface is fairly large, and IIUC the core of it is a SQL query interface against the trace data. I think implementing this full API in Go and keeping it up to date as Perfetto evolves is probably too high of a maintenance burden.
I don't think we could ship the trace_processor binary either [2], as we don't have the tooling to build a C++ application for all ports during the release process. We could perhaps check PATH, and use that binary as an optimization if users have installed it themselves?
[1] My understanding is that this same processor is compiled to WASM and run in the browser for the typical full-file mode.
[2] Way out idea is to build trace_processor to WASM and run that from Go!
Comment From: felixge
On the scalability front, it would be even better if Perfetto didn't need to load the entire trace up front and instead loaded only what it needed on demand, which would eliminate the need for us to cut the trace into chunks for the browser.
Yeah, that'd be awesome. But I think CL 457716 already gets us a little bit closer. I'm able to bump the split size from 100 to 500MB like shown below, and the Perfetto UI still works really well on the large trace I have.
-   s, c := splittingTraceConsumer(100 << 20) // 100M
+   s, c := splittingTraceConsumer(500 << 20) // 500M
But if I go to 1000MB it fails:
Unfortunately, that RPC interface is fairly large, and IIUC the core of it is a SQL query interface against the trace data. I think implementing this full API in Go and keeping it up to date as Perfetto evolves is probably too high of a maintenance burden.
Agreed.
[1] My understanding is that this same processor is compiled to WASM and run in the browser for the typical full-file mode. > [2] Way out idea is to build
trace_processorto WASM and run that from Go!
That would be a fun thing to try out at some point :). But this would still require the Go runtime to ship a WASM runtime such as wazero (Apache 2). Is that realistic?
Comment From: prattmic
Yeah, that'd be awesome. But I think CL 457716 already gets us a little bit closer. I'm able to bump the split size from 100 to 500MB like shown below, and the Perfetto UI still works really well on the large trace I have.
Nice. I imagine that the proto format will be even better here, as it should be more information dense.
That would be a fun thing to try out at some point :). But this would still require the Go runtime to ship a WASM runtime such as wazero (Apache 2). Is that realistic?
I don't know, it was just a fun thought, not particularly serious. :)
Comment From: felixge
Yeah, that'd be awesome. But I think CL 457716 already gets us a little bit closer. I'm able to bump the split size from 100 to 500MB like shown below, and the Perfetto UI still works really well on the large trace I have.
Nice. I imagine that the proto format will be even better here, as it should be more information dense.
It's possible, but the Visualising large traces page hints at a 0.5-1GB file size limit even for protobuf inputs (2GB divided by 2-4x), so I wouldn't bet on it.
I don't know, it was just a fun thought, not particularly serious. :)
Okay :). Alternatively we could just document how to use trace_processor for people working with very large traces.
Comment From: mknyszek
Asking this as someone who knows very little about perfetto: does perfetto have any kind of protocol for like, streaming the trace? In other words, is there something like a perfetto "server" protocol wherein the client tells the server what time slice it wants to look at, and the server provides data for that time slice (potentially aggregating/approximating to limit the size of the data sent)?
Comment From: prattmic
Asking this as someone who knows very little about perfetto: does perfetto have any kind of protocol for like, streaming the trace? In other words, is there something like a perfetto "server" protocol wherein the client tells the server what time slice it wants to look at, and the server provides data for that time slice (potentially aggregating/approximating to limit the size of the data sent)?
The trace processor mentioned in https://github.com/golang/go/issues/57315#issuecomment-1353394253 has an RPC interface, but the interface is SQL queries about the trace data. i.e., much higher level than just chunks of raw trace data.
I think what you are describing/what we'd want is an interface below the trace processor, which sends chunks of raw trace proto. AFAIK that doesn't exist. In fact, I think the trace processor currently depends on parsing the entire trace proto before it can serve SQL queries.
Comment From: felixge
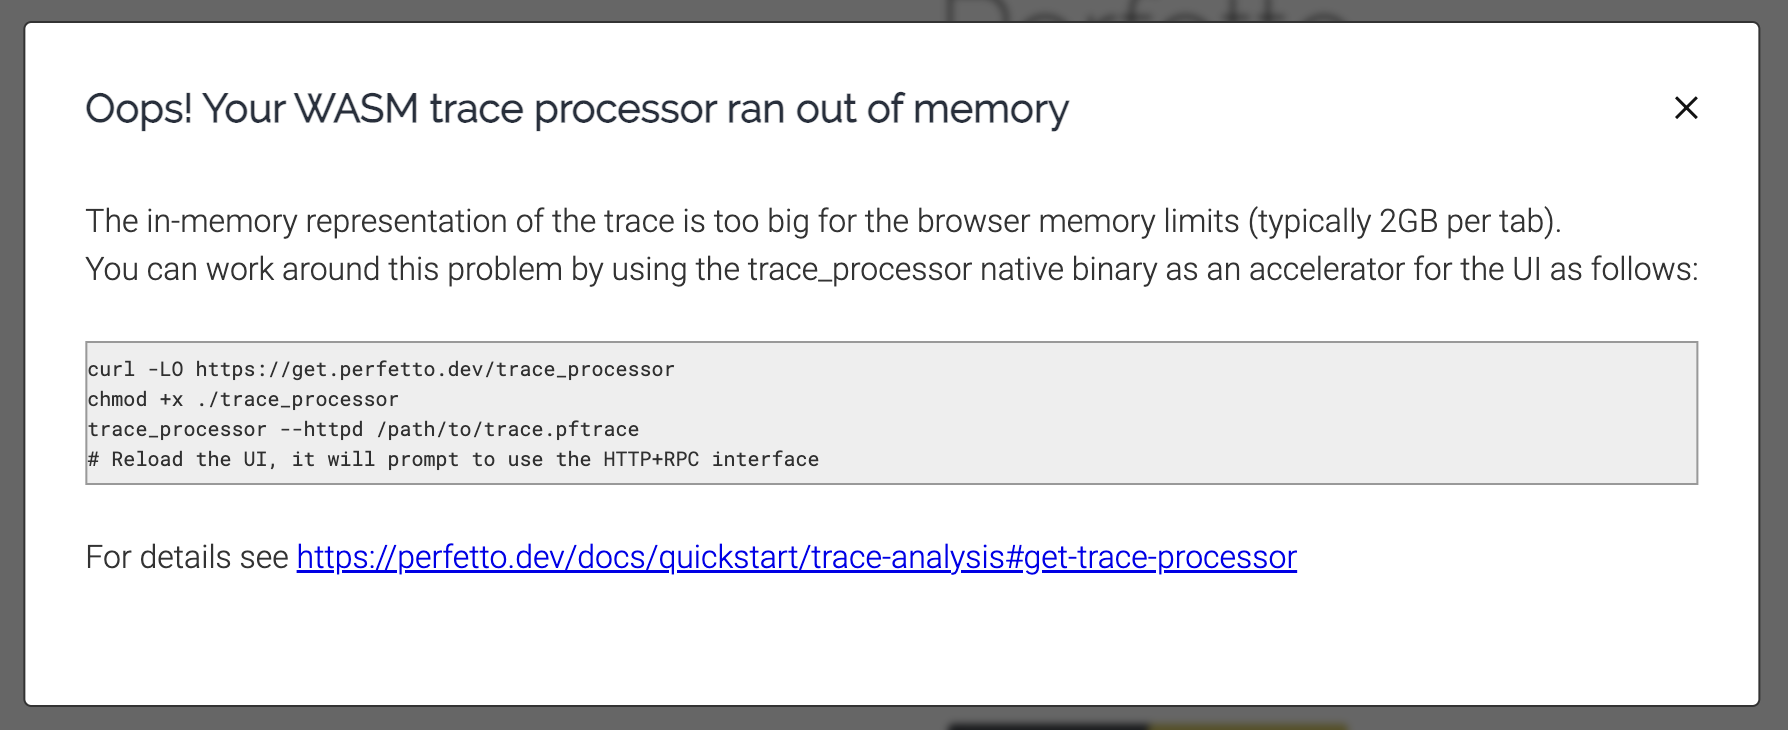
I just used the trace_processor on the 280MB trace I have laying around. I first converted it to JSON by hitting the /tracejson endpoint. This resulted in 8.8GB of JSON. Running ./trace_processor --httpd big.json took 7.5min before being ready. After that the experience was fairly good. But as @prattmic says, there seems to be no streaming. Everything is loaded into an in-memory column store on startup. The UI then queries this store using various SQL queries over a websocket connection.
So at this point I don't think Perfetto will allow us to "stream" very large traces to the UI. And given the high startup time of trace_processor, I probably prefer the current trace splitting done by go tool trace in most cases.
That being said, we should probably raise this in the perfetto-dev mailing list at some point.
Comment From: rsc
The current thing we use is unmaintained, and we have to move to something. Perfetto seems like the best game in town and it sounds like people here are generally positive about moving. Do I have that right? Are there any objections to agreeing to move to Perfetto? (I realize there is work to be done...)
Comment From: mknyszek
I'm not sure there are any specific objections.
Finding the right point of integration to get all the features (e.g. trace streaming) looks like it's going to be somewhat hard. We may want to reach out to the Perfetto maintainers for guidance.
In the meantime, we can always start with the simple thing of just using the legacy JSON interface, which is I think already better than what we currently have.
Comment From: rsc
This proposal has been added to the active column of the proposals project and will now be reviewed at the weekly proposal review meetings. — rsc for the proposal review group
Comment From: chrisguiney
For what it's worth, the json endpoints used by the current trace implementation are importable into perfetto. It's not perfect, because you can't import the entire trace. Going off of a rough memory of my attempts, the server would only output information about a given task.
I'd went as far as looking into forking the trace command to be able to translate the entire trace output to the json format. I ultimately decided not to pursue, just due to the time investment combined with not knowing what the future of the trace tool would be.
Comment From: felixge
For what it's worth, the json endpoints used by the current trace implementation are importable into perfetto. It's not perfect, because you can't import the entire trace. Going off of a rough memory of my attempts, the server would only output information about a given task.
Not sure what issue you hit with importing an entire trace. It works fine for me (unless the trace is too big, but that's handled by splitting).
I'd went as far as looking into forking the trace command to be able to translate the entire trace output to the json format. I ultimately decided not to pursue, just due to the time investment combined with not knowing what the future of the trace tool would be.
You might want to take a look at my patch here and this video showing it in action. Feedback welcome!
Comment From: rsc
Based on the discussion above, this proposal seems like a likely accept. — rsc for the proposal review group
Comment From: rsc
No change in consensus, so accepted. 🎉 This issue now tracks the work of implementing the proposal. — rsc for the proposal review group
Comment From: felixge
Awesome. Next steps:
- I could use some feedback on my patch for adding perfetto as an option to the current HTML pages.
- My colleague @nsrip-dd is looking into emitting perfetto's protocol buffer format instead of JSON. Hopefully this will solve problems with event linking not working correctly right now.
- More work needs to go into comparing the output produced by both viewers to make sure there is nothing else broken or problematic in Perfetto.
- We need to decide how long we want to keep the old viewer around. But I'd suggest to keep it at least for the first release that includes Perfetto.
Comment From: martin-sucha
There are no updates in this thread since this proposal was accepted, so I wanted to post a summary here.
@felixge, in the 2023 discussion about your Perfetto patch, you commented on 2023-04-05:
Abandoned
Putting this on hold for now due to the difficulties encountered with Perfetto. I'm currently in favor of watching the evolution of gotraceui before picking this back up again.
I also see some discussion from August 2024 in https://github.com/golang/go/issues/57175#issuecomment-2291849685
If I understand correctly, the issues with using Perfetto for Go traces were:
- Event linking not working correctly with the JSON format.
- Missing support for streaming data.
- Missing support for stack traces / associating stack traces with time slices.
Did I get the gist of it right? I couldn't find any details about the protocol buffer format implementation.
Comment From: LalitMaganti
FWIW I remain interested in getting Go traces working on Perfetto.
Comments from my side: - We now have a guide to write the protobuf format: https://perfetto.dev/docs/getting-started/converting - However, my usual suggestion is to write a importer in trace processor rather than a converter to make the experience more seamless. - We can now use 16GB of browser memory instead of 4GB we were limited to before due to the rise of memory64 which makes loading large traces much more tractable without needing to have native accelerator etc - Other folks have requested for adding callstack support for trackevent (https://github.com/google/perfetto/issues/1338). Having thought about the problem more since it was discussed there, I've come round to adding support for it inline in the UI. Needs some thought but should be possible. - We're adding support for "merging" different traces collected at the same time (https://github.com/google/perfetto/issues/1018). This might be interesting for e.g. correlating Linux scheduler activity with what is happening on goroutines (e.g. to see wakeup chains off-CPU.
I might write up a native importer for Go traces at some point if I have spare cycles.
Comment From: prattmic
Thanks for the updates! I'm glad to hear there is interest.
The conversion guide is really nice, even just for understanding how common scenarios are represented. I've previously found going straight to the proto definition rather daunting due to its size.
Regarding an importer, we have a nice parsing library at https://pkg.go.dev/golang.org/x/exp/trace [1]. Do you have any precedent for including Go in Perfetto? I imagine not since you must build to WASM? Implementing a trace parser in C++ is of course possible, but parsing is somewhat complex, so it would be an unfortunate maintenance burden to have two independent parsers.
Go traces get big very quickly, so the ability to stream to the browser is another important aspect for Go. Access to 16GB of memory is nice, but I'd rather avoid loading that much memory in the first place. If I recall correctly, this is possible by running the trace processor locally, but there were several pain points that I recall: * (Minor) it only listens on localhost * As a complex C++ application, it would likely be difficult to build and ship for all platforms that Go supports * Go traces are broken up into self-contained "generations". If you wish to view a region prior to the end of a generation, it is not necessary to parse the trace beyond the end of the generation at all. Conversion to Perfetto protos prior to starting the trace processor probably precludes this optimization. Maybe a native importer could take advantage of this, though I have my doubts (see below).
I initially thought that we could resolve this by having our trace tooling provide its own implementation of Perfetto's remote API with our own custom implementation. I was quickly scared off by discovering that the API is (more-or-less) arbitrary SQL queries to a quite large and complex sqlite database. Duplicating that database and determining the correct way to insert data seems daunting, and also seems difficult to apply an on-demand parsing optimization to.
[1] This is the "experimental" package path, but the API is mostly ready for stabilization.
Comment From: LalitMaganti
Do you have any precedent for including Go in Perfetto? I imagine not since you must build to WASM? Implementing a trace parser in C++ is of course possible, but parsing is somewhat complex, so it would be an unfortunate maintenance burden to have two independent parsers.
Unfortunately no including any other language is not really possible. Doubly so because of the number of different contexts trace processor is built in. FWIW trace processor has support for several ad-hoc binary formats already so we have quite lot of infrastructure to support that. While it's not ideal to have two implementations at the end of the day you need to have the mapping of go -> Perfetto data model somewhere and IMO it's always nicer for that to be closer to where the trace is being parsed to better preserve the semantics of the format.
Go traces get big very quickly, so the ability to stream to the browser is another important aspect for Go. Access to 16GB of memory is nice, but I'd rather avoid loading that much memory in the first place.
Trace processor running on the host does not really help you. The trace processor also loads the full trace into memory (I think I mentioned this in an email to Felix): TP on host is basically just a native version of what's running in the browser: that's it.
Moving to a streaming model would be a significant change in how the UI works. And even if you do this, it's not clear to me what the UX for the UI should be with "streaming" of traces. Like if you zoom in (or select a region), what would happen? Would we parse the trace at that point? That would mean the user has to wait for the trace to be parsed at that point?
Perfetto supports search and area aggregation. How does that work if you've not parsed the trace? How about SQL to find events? Flows between slices which are located in different generations? What happens if you merge a Go trace with e.g. a scheduler trace?
There's a lot of UX questions which are hard problems and I don't see easy solutions to them. If you have opinions on these, would really love to hear them
(Minor) it only listens on localhost
We've added support for listening on arbitrary ports and ips.
Go traces are broken up into self-contained "generations". If you wish to view a region prior to the end of a generation, it is not necessary to parse the trace beyond the end of the generation at all.
This is definitely a cool feature for a trace format to have and a pre-requisite for streaming but I think the blocker is not technical but UX based.
I initially thought that we could resolve this by having our trace tooling provide its own implementation of Perfetto's remote API with our own custom implementation. I was quickly scared off by discovering that the API is (more-or-less) arbitrary SQL queries to a quite large and complex sqlite database. Duplicating that database and determining the correct way to insert data seems daunting, and also seems difficult to apply an on-demand parsing optimization to.
Same as above: UI does a query to search for a slice and then what do you do? I don't think the problem is who provides this functionality (if we have solutions to the above problems, I'd love to make trace processor have native support for this itself) but all the UX challenges of how the UI should behave.
Comment From: mknyszek
While it's not ideal to have two implementations at the end of the day you need to have the mapping of go -> Perfetto data model somewhere and IMO it's always nicer for that to be closer to where the trace is being parsed to better preserve the semantics of the format.
IMO having two parsers is somewhat of a non-starter to me. I don't think we have the engineering bandwidth to support two parsers, and it's not a great experience for upstream to lag behind (it would be odd if go tool trace couldn't support the latest trace).
To be clear, parsing the binary format isn't bad at all (it's consistently just a header byte, followed by a lookup in a table, followed by parsing some number of LEB128 varints), and if it was only that, then fine. But ordering events and validating them is complicated, which is what @prattmic was alluding to above. (In an ideal world the wire format would have a specification that anyone could follow, but for various reasons, mostly around the idiosyncratic synchronization around syscalls, the wire format's specifics are tightly coupled to how the Go runtime emits events.)
Then again, the trace data is ordered with respect to a given OS thread. As long as we didn't care about flow events, and we choose to trust timestamps (which, for validation, I am against, but for drawing it's fine) we might not need the precise ordering (though it would be unfortunate to lose flow events).
Comment From: mknyszek
There's a lot of UX questions which are hard problems and I don't see easy solutions to them.
I don't think the UX questions are really all that bad. For example, I'd picture something like displaying a low-resolution summary when zoomed out, which for each "generation" is always held in memory and so is trivial to load into the UI, and display a loading bar for a chunk of data when you need to re-parse it upon zooming in. I don't think we would need to support actual streaming. The chunks are not that big, so the latency of parsing and displaying an individual chunk shouldn't be that bad.
Don't get me wrong, I understand that this is still a lot of effort, but there is a general direction here that I think would work out nicely.
I also acknowledge that supporting this on-demand model would likely be a major fundamental change to how Perfetto interacts with trace data, so I'm certainly not suggesting that Perfetto should go through all that effort just for us.
Comment From: LalitMaganti
IMO having two parsers is somewhat of a non-starter to me. I don't think we have the engineering bandwidth to support two parsers, and it's not a great experience for upstream to lag behind (it would be odd if go tool trace couldn't support the latest trace).
I'm not suggesting you maintain two parsers. The one in Perfetto could be maintained by us and can lag the upstream in a trailing way (i.e. we can "catch up" to the go runtime as and when the go changes, we can enforce only reading some version numbers in trace processor).
You would have to maintain a converter anyway, maybe I'm not understanding why it's more complicated to have a parser vs a converter (IMO the UX is a lot better because there's no separate conversion step).
But ordering events and validating them is complicated, which is what @prattmic was alluding to above.
I'm not sure what "validation" means in this context. I took a quick look at the format last night and I saw the LEB128 varints and figured that was not too bad.
As long as we didn't care about flow events, and we choose to trust timestamps (which, for validation, I am against, but for drawing it's fine) we might not need the precise ordering (though it would be unfortunate to lose flow events).
Sorry maybe I'm being silly but I don't understand how you're able to do tracing without trusting timestamps :) And I don't understand why flows are tied to trusting timestamps.
For example, I'd picture something like displaying a low-resolution summary when zoomed out, which for each "generation" is always held in memory and so is trivial to load into the UI, and display a loading bar for a chunk of data when you need to re-parse it upon zooming in.
So you would only support search/aggregation etc inside the current "chunk"? That would certainly simplify a lot of things but you're also loosing a lot of power from being able to search/aggregate across chunks. But if that's OK with you then works for us!
If I was to just sketch out what the least effortful way to implement this: I think we would actually have one trace processor instance of the zoomed out instance (which would be trace processor configured to not parse the full trace but maybe just "index" the trace i.e. keep track of the chunks etc). And then then UI would maintain the current "active chunk" in another trace processor. Every time we want to switch chunks, we throw away the trace processor and reparse the different chunk.
I also acknowledge that supporting this on-demand model would likely be a major fundamental change to how Perfetto interacts with trace data, so I'm certainly not suggesting that Perfetto should go through all that effort just for us.
FWIW there are other usecases in Perfetto where we'd like to handle really big traces. It's just that most of our users are using traces in the region of 30MB-1GB so it's never bubbled up as a priority. But there are people with 10-100GB traces. It's probable at some point we will get here but not in the short-medium term.
Comment From: mknyszek
I'm not suggesting you maintain two parsers. The one in Perfetto could be maintained by us and can lag the upstream in a trailing way (i.e. we can "catch up" to the go runtime as and when the go changes, we can enforce only reading some version numbers in trace processor).
If we're shipping Perfetto as part of the standard Go distribution, as this issue originally suggests, my understanding is that it cannot lag behind. If it does lag behind, means we're shipping a tool, go tool trace, that is incompatible with traces produced by programs with that toolchain. We would essentially need a guarantee that your team can complete necessary updates between when changes are made and when we actually release a new version of Go. If that's feasible, then great, but my baseline assumption is that such guarantees are not feasible, in which case maintenance would fall to us. :)
You would have to maintain a converter anyway, maybe I'm not understanding why it's more complicated to have a parser vs a converter (IMO the UX is a lot better because there's no separate conversion step).
I may be misusing some of the Perfetto terminology so please bear with me. IIUC, a converter is easier if you already have the parsed data, since it doesn't need to perform any validation. It can make certain assumptions about the trace data than a parser that doesn't do any ordering cannot. And ordering/validation is the hard part (see next part).
I'm not sure what "validation" means in this context. I took a quick look at the format last night and I saw the LEB128 varints and figured that was not too bad.
See https://cs.opensource.google/go/go/+/master:src/internal/trace/order.go;l=1?q=internal%2Ftrace%2Forder.go&sq=&ss=go%2Fgo for the full complexity in all its glory.
Sorry maybe I'm being silly but I don't understand how you're able to do tracing without trusting timestamps :) And I don't understand why flows are tied to trusting timestamps.
We encode the partial orders of events with sequence numbers associated with certain scheduler resources. As a result we're able to reconstruct the correct order of events without any timestamps at all.
We've had years of issues with people running Go in environments where timestamps are unreliable. Worse, we have some cases where we actually cannot guarantee events are emitted (and events are taken) in the right order. If the event in question represents some kind of low-level operation like a single compare-and-swap (for example, what happens on the system call path), then it's very easy for timestamps to lie about the order in which things happened. If we trust them blindly, we get unavoidable and non-deterministic validation issues. See #8976 and #16755.
In the latest trace versions, timestamps are a secondary factor with respect to ordering, and we first order by the logically correct ordering, and then by timestamps. This also places the fewest restrictions on the runtime's implementation of the tracer.
So you would only support search/aggregation etc inside the current "chunk"? That would certainly simplify a lot of things but you're also loosing a lot of power from being able to search/aggregate across chunks. But if that's OK with you then works for us!
I was thinking that you might have several "local" chunks available, but that's a good point, we would lose the ability to search/aggregate across chunks at the UI level.
Though, this is also something that could happen not at the UI level, and instead on the server, wherein the server could perform the search/aggregation in a streaming way, limiting the impact to memory footprint while still maintaining complete expressive power.
(Again, please bear with me if I'm getting something wrong here, I am not super familiar with Perfetto's model.)
If I was to just sketch out what the least effortful way to implement this: I think we would actually have one trace processor instance of the zoomed out instance (which would be trace processor configured to not parse the full trace but maybe just "index" the trace i.e. keep track of the chunks etc). And then then UI would maintain the current "active chunk" in another trace processor. Every time we want to switch chunks, we throw away the trace processor and reparse the different chunk. ... FWIW there are other usecases in Perfetto where we'd like to handle really big traces. It's just that most of our users are using traces in the region of 30MB-1GB so it's never bubbled up as a priority. But there are people with 10-100GB traces. It's probable at some point we will get here but not in the short-medium term.
👍
Comment From: prattmic
I'm not suggesting you maintain two parsers. The one in Perfetto could be maintained by us and can lag the upstream in a trailing way (i.e. we can "catch up" to the go runtime as and when the go changes, we can enforce only reading some version numbers in trace processor).
If we're shipping Perfetto as part of the standard Go distribution, as this issue originally suggests, my understanding is that it cannot lag behind.
To add clarity to this, this issue was intended to cover dropping the existing tooling we ship, a binary go tool trace that uses/bundles the old Chromium trace viewer, with an alternate go tool trace with some kind of Perfetto integration. In that case, new releases of Go must be immediately supported.
We could end up choosing to not switch to a Perfetto default, in which case Perfetto could of course choose to support Go traces as an alternate tool and choose to support Go versions on any convenient timeline.
Comment From: mknyszek
Just to be abundantly clear: thank you for taking the time to look into this, @LalitMaganti. It would be awesome to replace our current crusty trace viewer with something modern and performant like Perfetto, and your initiative in engaging with us is very much appreciated. I hope my replies above don't give off the impression of being against more Perfetto support in any way. :)
Comment From: LalitMaganti
If we're shipping Perfetto as part of the standard Go distribution, ... in which case maintenance would fall to us. :)
Fair enough, I'm not able to guarantee that so you should have a converter :)
Maybe I'll prototype that instead.
In the latest trace versions, timestamps are a secondary factor with respect to ordering, and we first order by the logically correct ordering, and then by timestamps.
Ack seems your usecase is significantly more complicated than any sort of tracing we've dealt with before.
Though, this is also something that could happen not at the UI level, and instead on the server, wherein the server could perform the search/aggregation in a streaming way, limiting the impact to memory footprint while still maintaining complete expressive power.
To be clear: the UI never does data crunching that's always done by the "backend" i.e. trace processor. But the problem is that today everything is parsed everything up front, nothing is "deferred".
Doing search/aggregation in a streaming way would be a fundamental rewrite of how trace processor works. Could we make it work just for Go: maybe. But honestly I don't think we're ever going to go there. It would mean that many actions in the UI would take O(minutes) as we both parse a very large trace, sort it and aggregate it. This is going to be bad UX.
To add clarity to this, this issue was intended to cover dropping the existing tooling we ship, a binary go tool trace that uses/bundles the old Chromium trace viewer, with an alternate go tool trace with some kind of Perfetto integration. In that case, new releases of Go must be immediately supported.
Ack I didn't quite appreciate this which is why I kept suggesting a parser vs a converter. I'm now sold on a converter approach.
I hope my replies above don't give off the impression of being against more Perfetto support in any way. :)
No worries at all, I'm finding the discussion quite constructive!
Comment From: LalitMaganti
As an outcome of all of the discussion above: would it help if I wrote a self contained go program which did the go trace -> proto using the API you linked above and shared it here?
Comment From: mknyszek
As an outcome of all of the discussion above: would it help if I wrote a self contained go program which did the go trace -> proto using the API you linked above and shared it here?
Wow, I really thought I replied here. Yes! That would be helpful in moving this forward, for sure.
Comment From: LalitMaganti
Wow, I really thought I replied here. Yes! That would be helpful in moving this forward, for sure.
Great thanks. When I get some spare cycles, I will look into this.