SPEL expression parser takes more cpu after upgrade from 6.2.8 to 6.2.9,
There is huge affect in performance and we use spel in multi threaded env.
A benchmark that was captured during testing the same code with different spel versions
00:08:33.234019 time with 6.2.9 00:02:36.568206 time with 6.2.8
Any suggestions to be considered to make 6.2.9 run similar to 6.2.8.
We also tried working with 6.2.10 and 6.2.11, both the version exhibit the same issue with performance.
Tried some of the version between 5.3.39 and 6.2.8 which are 6.2.0 and 6.2.5.
6.2.0 and 6.2.5 provided the best performance same as 6.2.8.
The major difference we are seeing with spel is while moving from 6.2.8 to 6.2.9. I have gone through the change logs but could not get the root cause that could be possible for higher cpu time.
Background: We run our application on Quarkus and use spel library for expresssion parsing. We had a vulnerability on 5.3.39 that is when we moved to the latest library that did not have any issues which is 6.2.11.
While backtracking the version we found the conflicting issue of performance happened between 6.2.8 to 6.2.9.
Looking forward for your response.
Thank You
Comment From: bhargavmavram
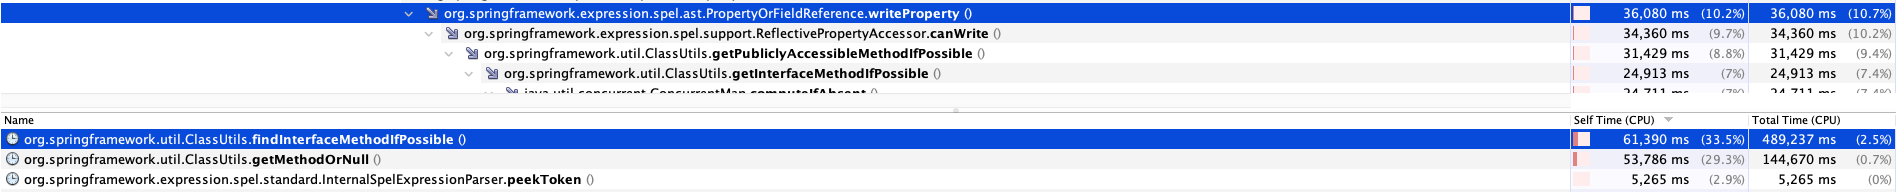
Additional Observation from VM Sampler 6.2.8 performance for max cpu time consumed method

6.2.11 performance for max cpu time consumed method

Assuming the commit that started to cause this issue: https://github.com/spring-projects/spring-framework/commit/ba6166a02d8bc2a7a9e1b57c7431fee4ca3854b1
Comment From: jhoeller
@bhargavmavram thanks for the report! It is surprising that our interface method refinement leads to such a performance impact. While the lookup across a complex class hierarchy may be more costly there, it is supposed to get cached. Are you commonly evaluating expressions across new classes/methods? Is your system under strong GC pressure so that the soft references in the cache might get cleared prematurely?
The most impactful part of our 6.2.9 revision seems to be the former early exit for methods on public classes, whereas we continue the search for interface methods even on public classes now (since even public classes may be concealed by the module system at runtime, not allowing relective invocations on non-exported classes). If this assumption is correct, you would not have hit our ClassUtils caches at all before - but it is still surprising that you are seeing so much impact once those caches are hit.
Comment From: bhargavmavram
@jhoeller Thanks for attending this issue. Yes our class hierarchy is a bit complicated and huge. It is an class generated from Avro and yes we do have call over the instance multiple time as we keep creating new instances for the class and set values to it based from a text file. The CPU is under high pressure now apart of it is GC. We do understand the changes made but cannot rely on the old version now as that has vulnerabilities. Happy to take suggestions to make our application run as before. I am afraid that the caching is not really used for us as we create the Object and set values to it and send it over Kafka and keep continuing creating objects.
Comment From: jhoeller
I have a solution ready that explicitly checks !Module.isExported before trying to resolve an interface method or a public method higher up the class hierarchy, bringing it closer to the 6.2.8 version of the algorithm (with an early exit for public and exported types) while still remaining compatible with the Java Platform Module System. This means that no reflection and no cache access happens for public methods on regular public types at all.
Bringing this into a 6.2.12 snapshot ASAP. It'd be great if you could give it an early try once the snapshot is available.
Comment From: github-actions[bot]
Fixed via a6f6ecfe6c2d2f20b23c3d725614bc36c9c0e8f4