Hello, I'm new into Superset. Trying to move our analytics to this platform, but i met problem as I see no possibility of making Total row correct for non-countable (or non-additive) metric SuperSet version: 3.0.0
Example:
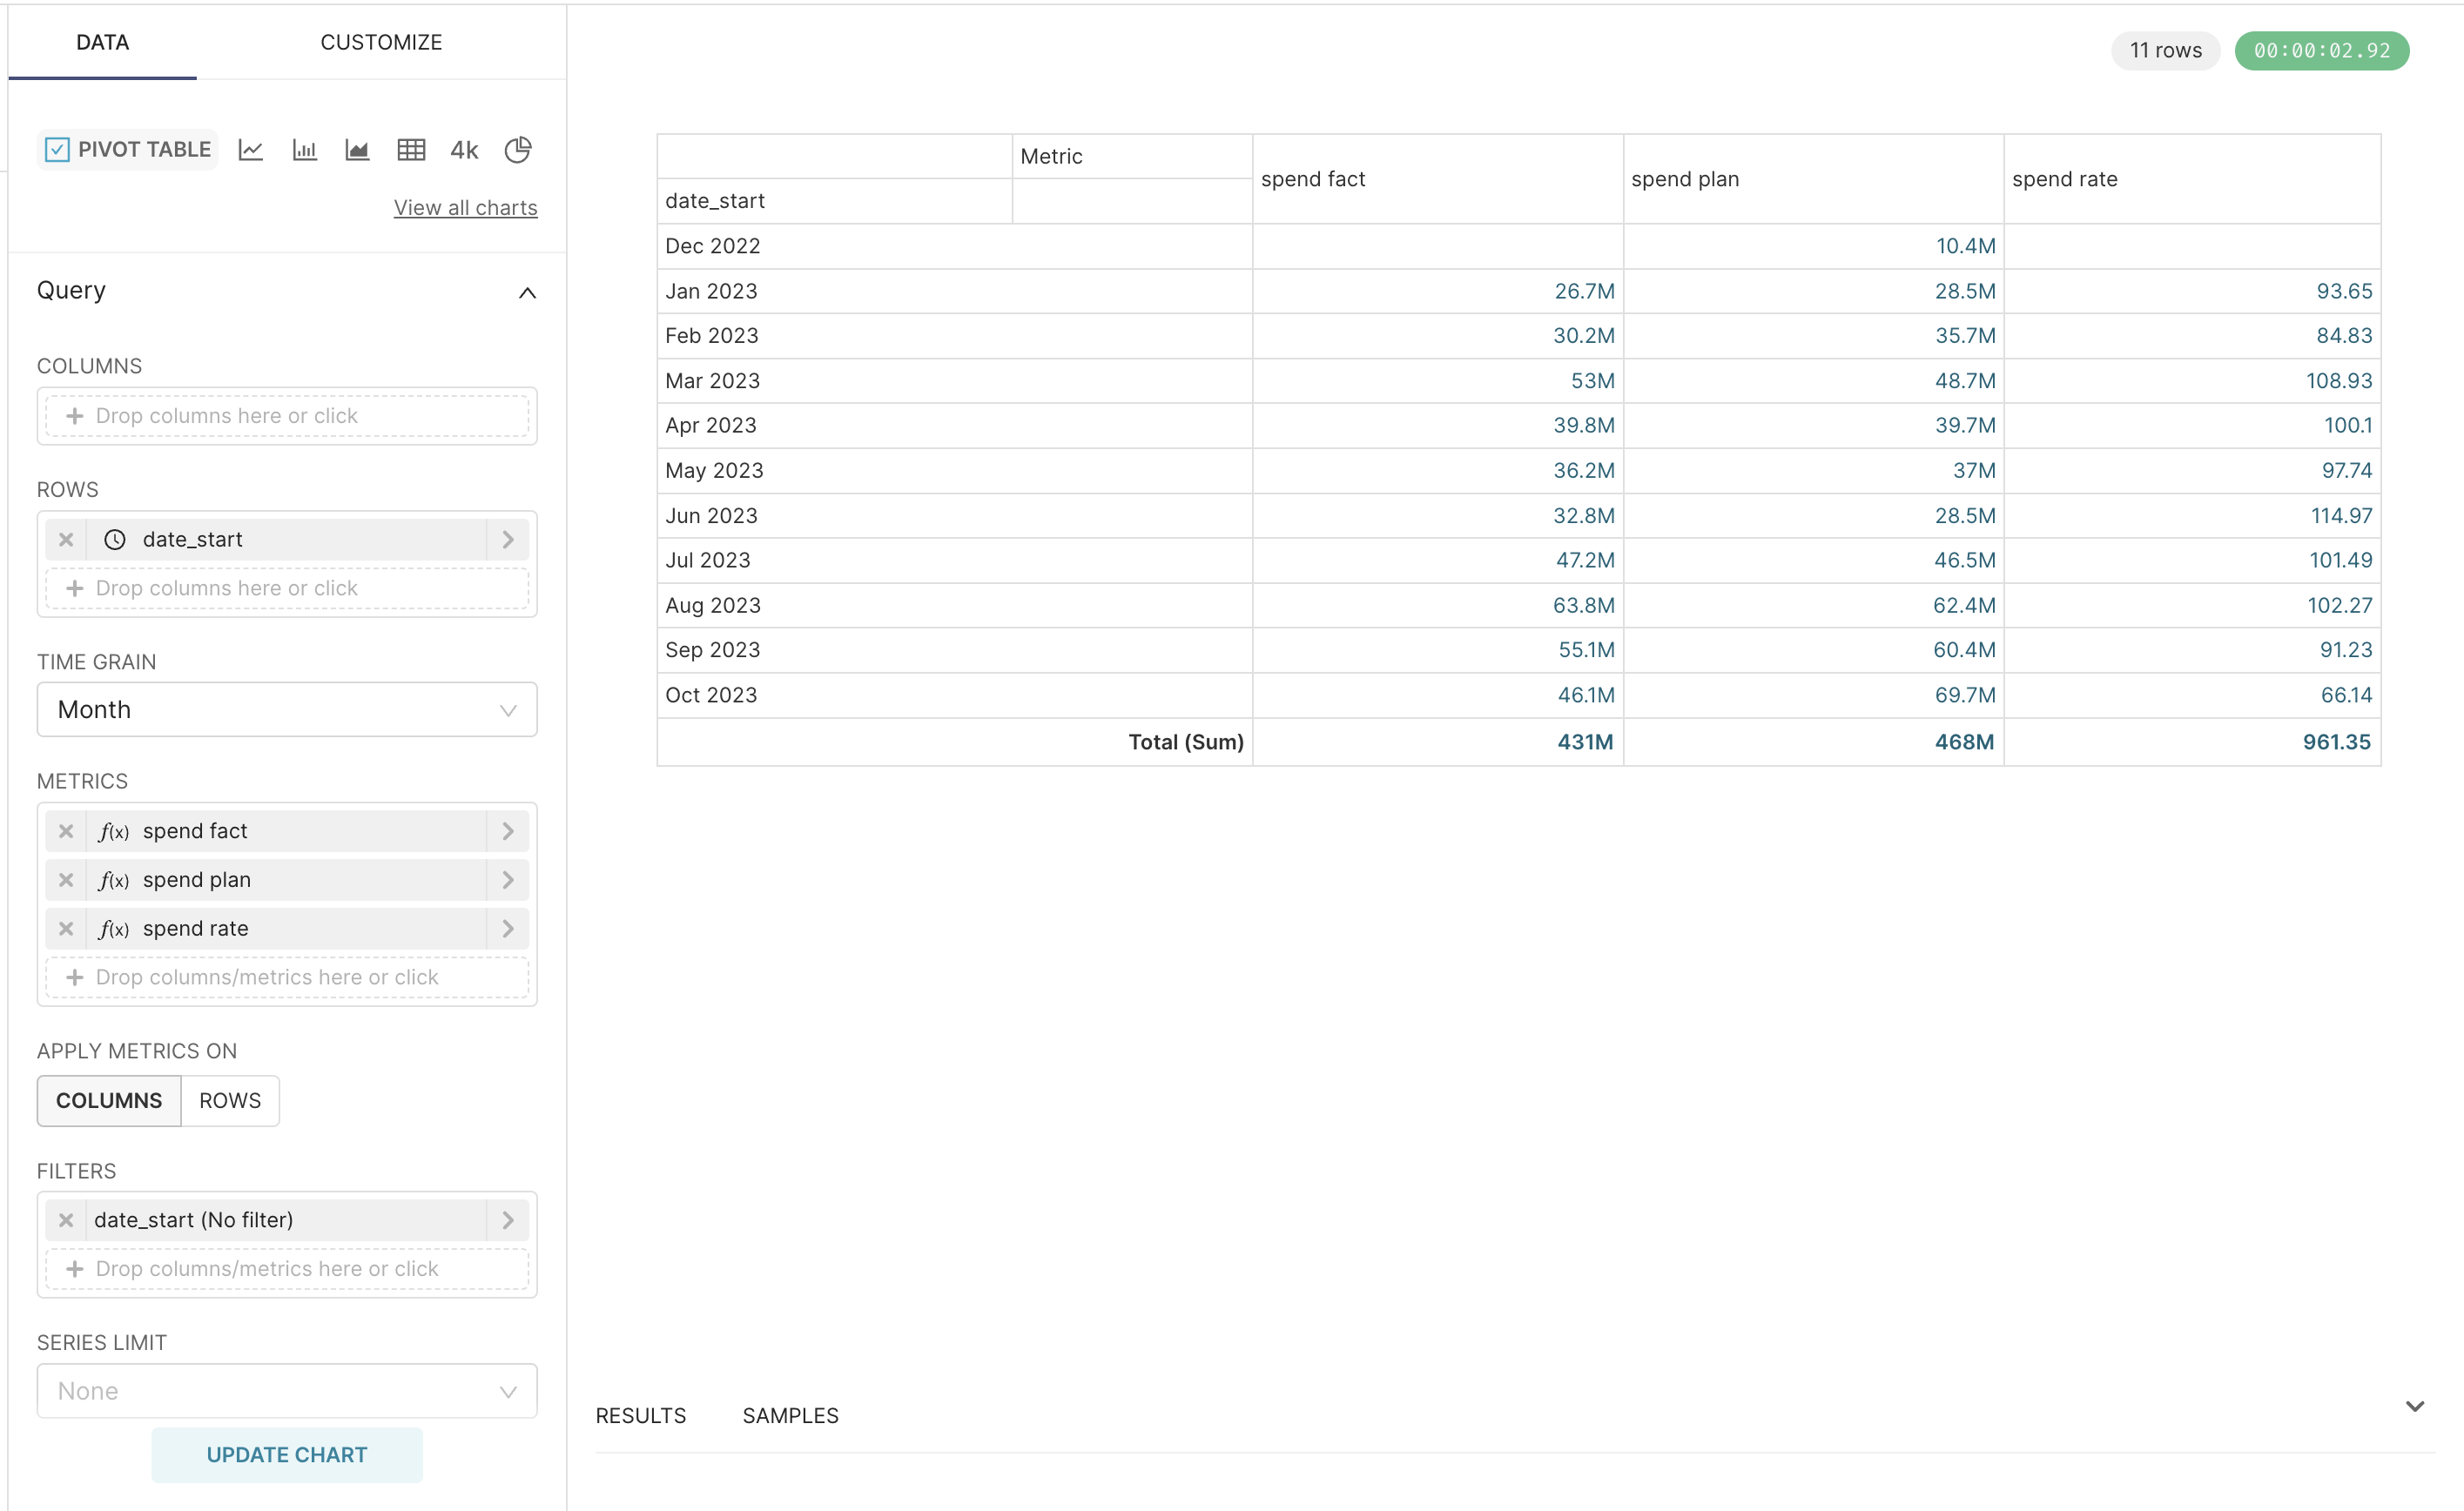
I have three metrics grouped by month:
1. "spend plan" – amount of money company was planning to spend
2. "spend fact" – amount of money company actually spended
3. "spend rate" – ratio of spend fact and spend plan
So, I created pivot table and added totals. "spend plan" and "spend fact" are ok – its totals are sums of all values
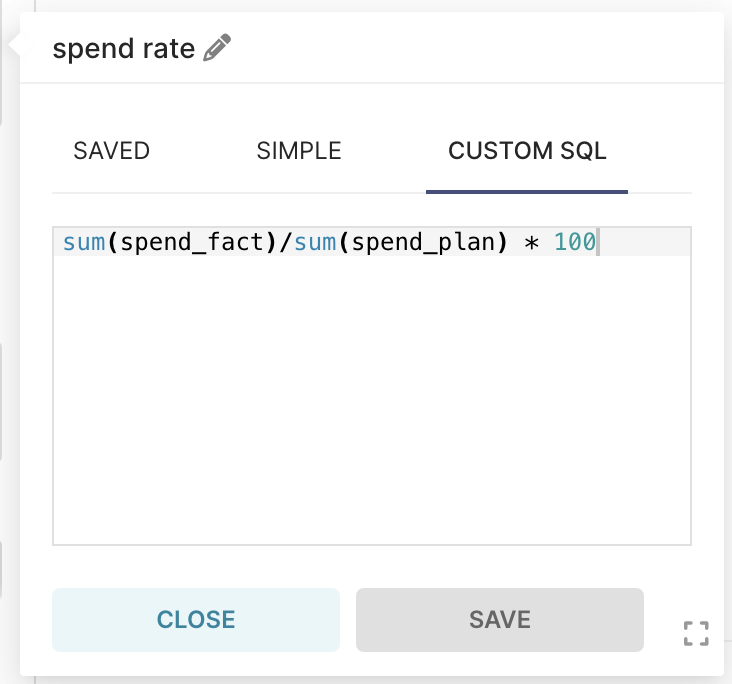
but for "spend rate" I also see sums of all values instead of ratio of "spend fact" and "spend plan" totals
Expected result (using Google Spreadsheets):
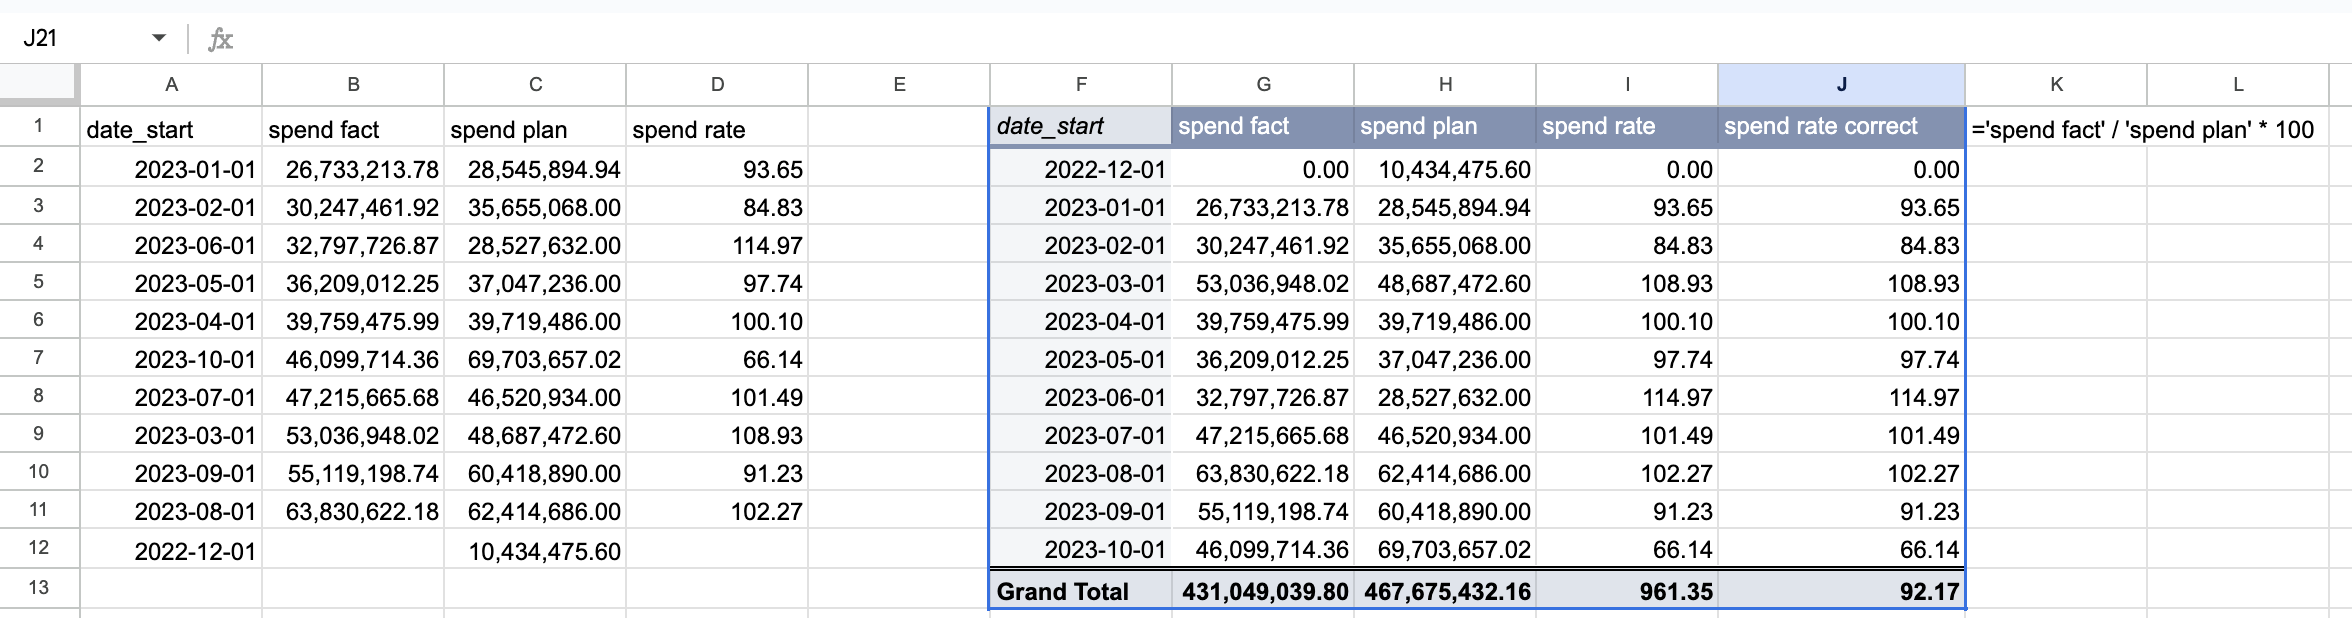
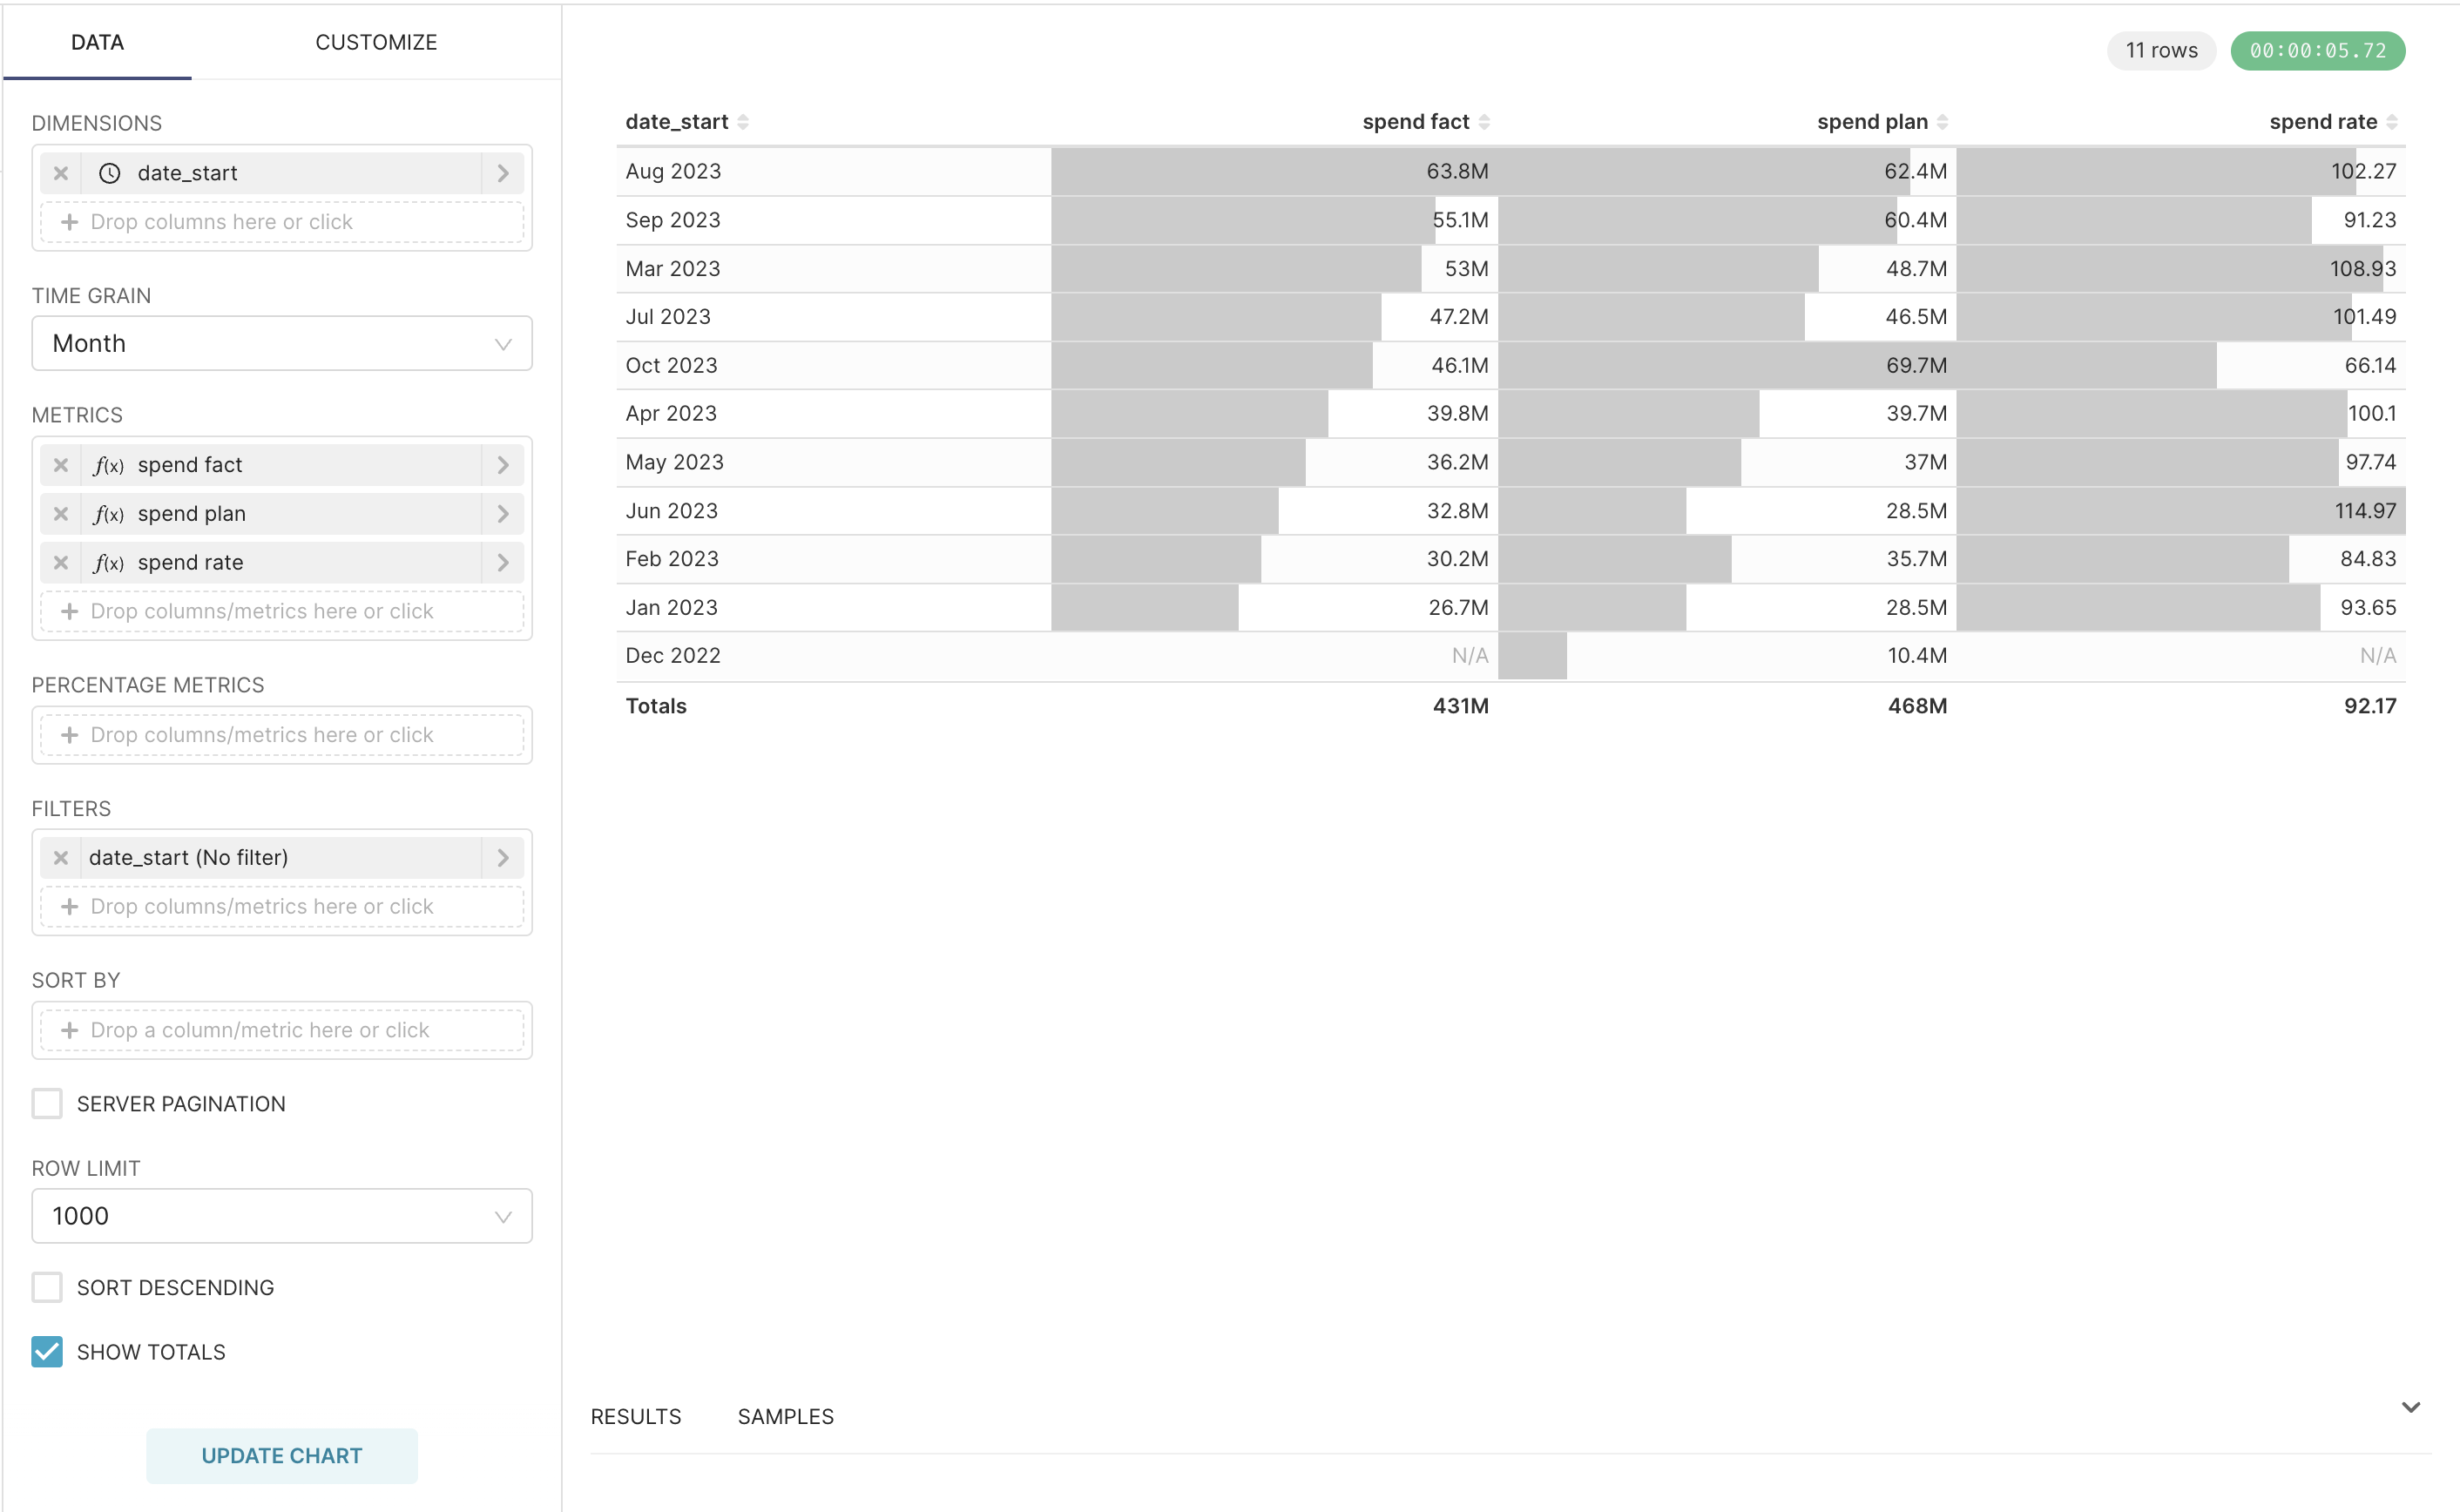
UPD. Found that usual table calculates "spend rate" correctly
Originally posted by @lameapparition in https://github.com/apache/superset/issues/14061#issuecomment-1777176807
Comment From: villebro
This is a known limitation right now. The solution would be to trigger additional queries for all aggregation levels. By doing so even non-additive metrics would display correctly (this is how the table chart does it). However, the required change is rather complex, and requires good knowledge of how the pivot table chart works. IIRC I've discussed this with @kgabryje a few times a while ago (he's the original author of the chart plugin), but we were never able to find the time to work on implementing this improvement.
Comment From: mistercrunch
There'd be two main ways to approach this: - having different semantics around formulas and an engine that's formula-aware, meaning it could pushdown to SQL or render on the backend/frontend. This may work for ratios or averages, but not for distinct counts or percentiles - running multiple queries, one for each aggregation-level. This can get complex if service into sub-totals and multiple dimensions
Both of those would be significant work and add much more complexity to the current SQL-oriented approach.
It could be good though to hide totals for non-additive metrics though, probably through per-metric inference or configuration. If it's a simple metric, we know which aggregation methods are additive and/or why. If it's SQL expression, the user may have to tell us if it's additive or not. A simple quick-fix would be to only show the totals where people use the SUM-type simple metric (which is probably 80%+ of metrics out there).
Interestingly, for things like average we could be smarter, and for things like ratio (ask the db for a SUM(col) and a COUNT(col)) and do our own math. For ratio we could introduce new "not-so-simple" metrics where you specify your numerator metric and denominator metric and we could compute totals properly....
Comment From: rusackas
Hey all,
Just FYI, we have had quite a few issues on this topic. I've closed out a couple of the other ones in favor of this one. lease feel free to do they same as they arise!
Comment From: felipegranado
Hi!
Any update for this? I working in a table and I found same issue about the totals.
Thanks in advance...
Comment From: goldjee
Bumping this because I believe that the ability to aggregate non-additive data is crucial for any BI tool. All of the major tools present on the market can handle that effortlessly.
As we define SQL for measures (and they should be proper SQL aggregates) in dataset options, I think that Superset already has all the required information to calculate subtotals. So,
- For each aggregation level, the pivot table could send a query to the database with properly generated GROUP BY.
- In chart settings, the dropdown that allows to choose aggregation type can be safely removed.
This approach has an obvious drawback of spamming queries if there is a lot of aggregation levels. But realistically no pivot table would have even a dozen of them, so such an overhead should be tolerable.
@mistercrunch @rusackas @villebro Could we expect such a feature in one of the upcoming releases?
Comment From: ramrajsingh
A better/easier way to implement this ( and that will add an additional feature ) is to implement weighted sum. Here in this case while calculating sum ( for rations and % columns ) we need to weight by the value of denominator column and this weighed sum needs to be normalized/divided by sum of denominator column.
This will effectively give sum(numerator)/sum(denominator)
E.g. | Numerator | Denominator | Ratio | Weight (=Denominator) | Weight X Ratio ( Hidden ) -- | -- | -- | -- | -- | -- | 10 | 40 | 0.25 | 40 | 10 | 3 | 80 | 0.0375 | 80 | 3 | 30 | 50 | 0.6 | 50 | 30 | 40 | 80 | 0.5 | 80 | 40 | 35 | 100 | 0.35 | 100 | 35 Totals | 118 | 350 | 1.7375 | 350 | 118
The total of ratio is 1.7375 is current superset behavior. If we implement weighted sum it will be sum of weight*ratio / sum of weights = 118/350 = 0.33714286
From GUI we need to save a dict of which column(s) sum is/are weighed and what is/are the corresponding weight column(s).
Also this will not need additional db hits. We work with the same data we got in original query.
Comment From: mistercrunch
We thought about implementing a mini-language for metrics in the past as some other BI tools do as it would serve other use cases beyond this one. Say if you define a complex metric as a long SUM(CASE WHEN {...} END) and would like to reuse it in a ratio or another metric for whatever reason, currently you have to duplicate the logic which is ok but not ideal.
One approach would be to use the jinja support in place by adding some sort of macro for say {{ dataset.metrics("my_numerator") }} / {{ dataset.metrics("my_numerator") / }}, but this wouldn't work for in-frontend-type computation like the use case we're exploring here.
If we were to come up with a higher level / declarative mini-language for metrics, we'd have the luxury to decide whether to compute on the backend or frontend depending on the use case. Not sure if there are good libs that would work well for this. On the top of my head, it'd have to support metric referencing, inline sql expressions, aggregation semantics (SUM, COUNT_DISTINCT, AVG, ...), and common arithmetic operations, and be interpretable in both javascript and python.
Comment From: rishika-ushur
@mistercrunch Are there any updates on this feature yet? Can you please suggest a work around if available
Comment From: MarcoFranchin96
Hi, is there any update on this? Because it's a pretty basic behaviour for a BI tool
Comment From: mhgapps
Really looking forward to see when this will be solved. I am moving from Tableau mainly because I grew tired of how heavy Prep is, and how long it takes to clean all my data sets. Also because is expensive... But net being able to have a pivot table that subtotals both sum and avg is a major issue. In my current setup in Superset I ended up creating 2 tables, one for $$$ and the other one for % but is a pain for layout purposes in the dashboard.
Comment From: Valerii-Tcvetkov
Is it possible to use custom plugin for chart or smth like that? It's pretty strange, that there're no solution yet...
Comment From: rusackas
This just hit my potential-stale-issue radar, but obviously it's still relevant. I'm not sure whether or not some of the newer solutions @yousoph has been looking into on the Preset side have taken this into account or not.