In my Spring Boot 3.4.0 based application, I have an @Aspect named TenantServiceAspect that intercepts repository method calls to apply multi-tenancy filters using Hibernate filters.
This aspect works perfectly fine in Spring Boot 3.3.10.
However, during load testing, sometimes when the application is restarted under heavy load, the beforeExecution() method of the aspect is not triggered for certain repository calls, especially this one
The problem is not due to the load test. Since the load test constantly tries to make a request while the project is closed, when I restart the project, it probably causes this error because the request comes when the Spring Boot project is not fully ready.
Spring Boot version: 3.4.0
Java version: 21
Batch rest service
@RestController
@RequiredArgsConstructor
@RequestMapping("batch")
public class BatchService {

    private final BatchBusinessService batchBusinessService;

    @GetMapping(value = "/findBatchByCode", produces = {MediaType.APPLICATION_JSON_VALUE})
    ResponseEntity<ServiceResponse<BatchDto>> findBatchByCode(@RequestParam("code") String code) {
        return buildResponseEntity(batchBusinessService.findBatchByCode(code));
    };

}
BatchBusinessService class
package com.example.batch.service;

import com.example.batch.data.domain.Batch;
import com.example.batch.data.dto.BatchDto;
import com.example.batch.data.repository.BatchRepository;
import com.example.batch.mapper.BatchMapper;
import lombok.RequiredArgsConstructor;
import org.springframework.stereotype.Component;

@Component
@RequiredArgsConstructor
public class BatchBusinessService {

    private final BatchRepository batchRepository;

    private final BatchMapper mapper;

    public BatchDto findBatchByCode(String code) {
        Batch batch = batchRepository.findByCode(code).orElse(null);
        return mapper.toDto(batch);
    }
}
BatchRepository interface
package com.example.batch.data.repository;

import com.example.batch.data.domain.Batch;
import org.springframework.data.jpa.repository.JpaRepository;
import org.springframework.data.jpa.repository.JpaSpecificationExecutor;
import org.springframework.data.jpa.repository.Query;
import org.springframework.data.repository.query.Param;
import org.springframework.stereotype.Repository;

import java.util.Optional;

@Repository
public interface BatchRepository extends JpaRepository<Batch, Long>, JpaSpecificationExecutor<Batch> {

    Optional<Batch> findByCode(String code);
}
Aspect class
package com.example.framework.multitenancy.aspect;

import com.example.logger.LogFactory;
import com.example.logger.Logger;
import jakarta.persistence.EntityManager;
import jakarta.persistence.PersistenceContext;
import org.aspectj.lang.JoinPoint;
import org.aspectj.lang.annotation.Aspect;
import org.aspectj.lang.annotation.Before;
import org.aspectj.lang.annotation.Pointcut;
import org.hibernate.Filter;
import org.hibernate.Session;
import org.springframework.stereotype.Component;

@Aspect
@Component
public class TenantServiceAspect {
    private static final Logger LOGGER = LogFactory.getLogger(TenantServiceAspect.class);
    @PersistenceContext
    public EntityManager entityManager;

    public TenantServiceAspect() {
    }

    @Pointcut("execution(* org.springframework.data.jpa.repository.JpaRepository.*(..))")
    void isRepository() {
    }

    @Pointcut("execution(public * com.example..*.repository..*(..))")
    void isCustomRepository() {
    }

    @Before("(isCustomRepository() || isRepository())")
    public void beforeExecution(JoinPoint joinPoint) {
        LOGGER.warn("TenantServiceAspect triggered for method: {}", joinPoint.getSignature());
        Filter filter = ((Session)this.entityManager.unwrap(Session.class)).enableFilter("companyFilter").setParameter("companyId", 1L);
        filter.validate();
    }
}
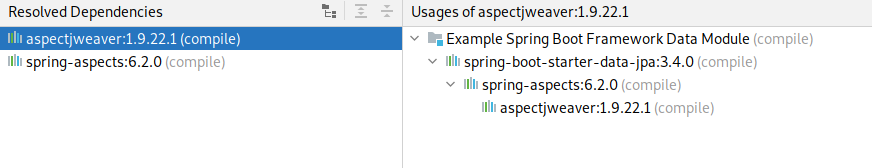
Note: While investigating the root cause, I noticed something strange in Spring Boot's managed dependencies:
- Spring Boot 3.3.10 uses
aspectjweaverversion 1.9.23 - Spring Boot 3.4.0+ (including 3.4.3) uses
aspectjweaverversion 1.9.22.1
3.3.10
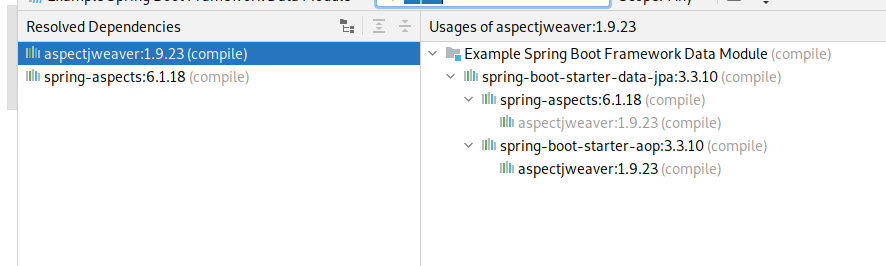
3.4.0
While I haven’t confirmed the exact root cause yet, I’ve noticed that starting from Spring Boot 3.4.0, the spring-boot-starter-data-jpa no longer includes the spring-boot-starter-aop dependency by default:
Release Note: “Remove spring-boot-starter-aop dependency from spring-boot-starter-data-jpa and spring-boot-starter-integration” https://github.com/spring-projects/spring-boot/issues/42934
I’m wondering if this change might somehow be related to the issue I'm facing — specifically, that sometimes my @Aspect (TenantServiceAspect) does not get triggered in version 3.4.0, even though it works fine in 3.3.10.
It’s possible that under some conditions (e.g., app restarts, load), the absence of AOP support could lead to such inconsistent behavior.
Just sharing this in case it helps identify the root cause or helps someone else running into similar issues after upgrading to 3.4.0.
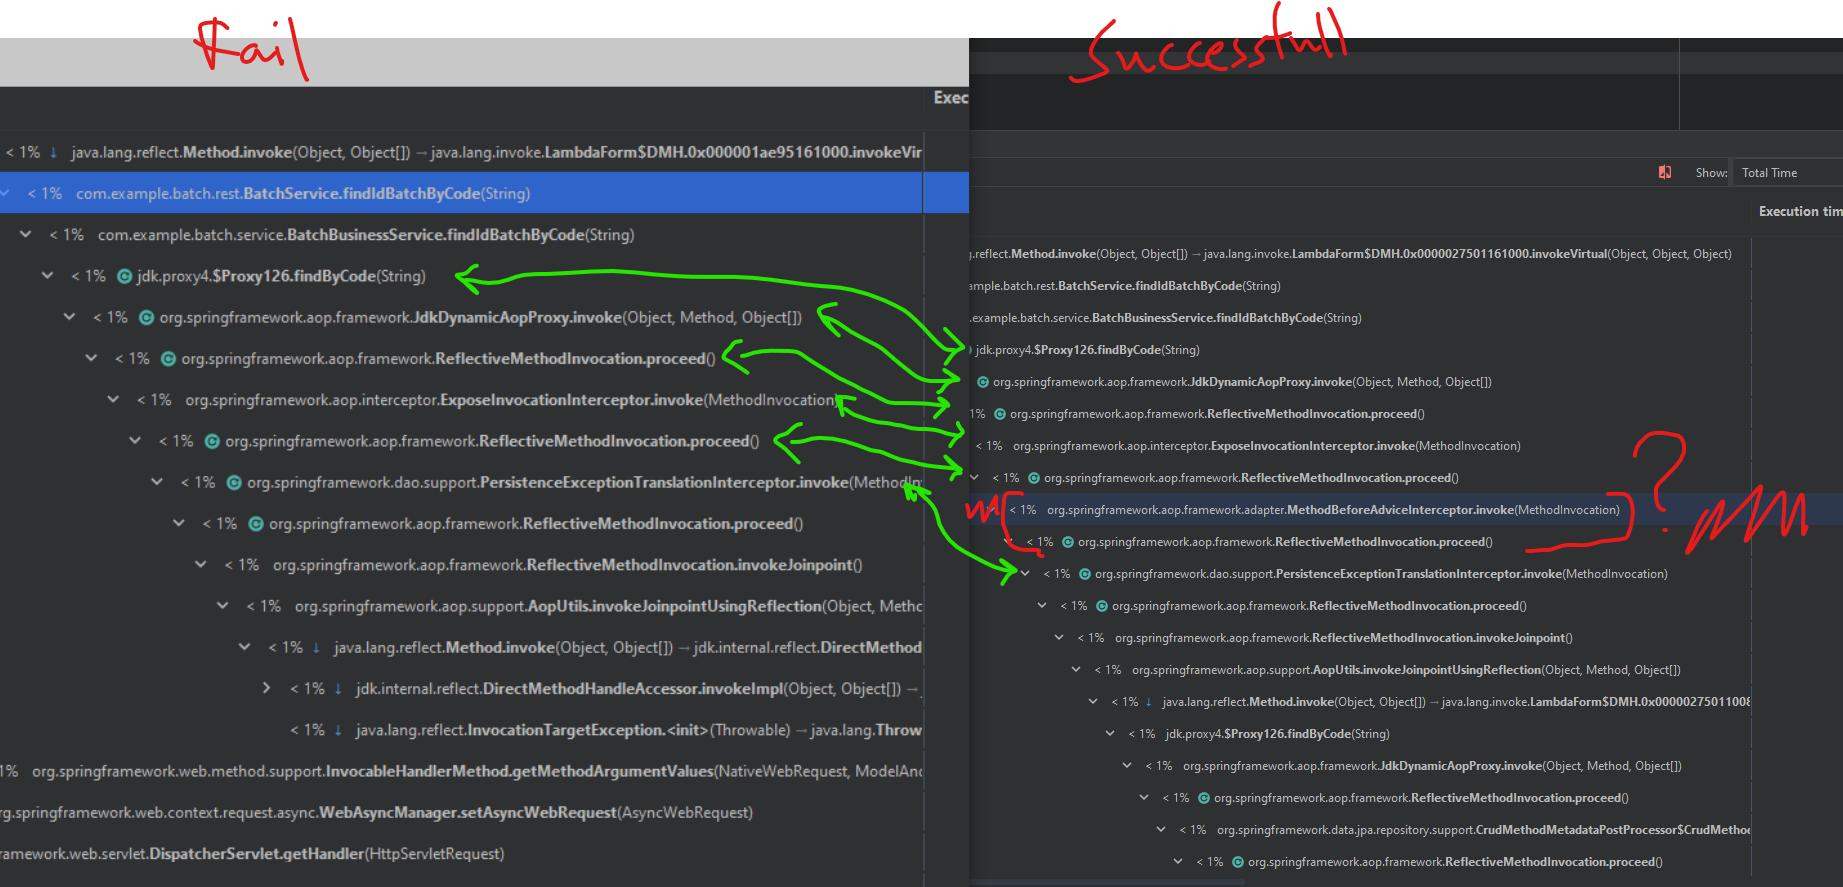
Intellij IDEA Profiler Fail and Successfull Output
Comment From: mhalbritter
If you'd like us to spend some time investigating, please take the time to provide a complete minimal sample (something that we can unzip or git clone, build, and deploy) that reproduces the problem.
Comment From: zoroglu
I have finally prepared a sample project as you requested. Here is the GitHub link for your review: github project link
@mhalbritter
Comment From: mhalbritter
Thanks. First thing i'd do is to upgrade to the latest Spring Boot 3.4.x version, 3.4.4. Then, as you have noticed, https://github.com/spring-projects/spring-boot/issues/42934 removed spring-boot-starter-aop from spring-boot-starter-data-jpa. You could try adding spring-boot-starter-aop back again and see if the issue persists.
Spring Boot 3.4.0+ (including 3.4.3) uses aspectjweaver version 1.9.22.1
I don't see that. A mvn dependency:tree shows org.aspectj:aspectjweaver:jar:1.9.23:compile.
Comment From: zoroglu
Thanks.
Just to clarify, in Spring Boot 3.3.10, the version of aspectjweaver is 1.9.23 by default.
However, in Spring Boot 3.4.x (up to3.4.3), it uses aspectjweaver 1.9.22.1.
Only in Spring Boot 3.4.4, the version is updated back to 1.9.23.
I also tested with Spring Boot 3.4.4 and manually added spring-boot-starter-aop dependency,
but I still encountered the same issue.
Comment From: mhalbritter
I can't reproduce it. I've built your application (i had to simplify it, i'm using this) and load-tested it with hey (hey -n 100000 -c 1 -q 100 http://localhost:8080/batch/findIdBatchByCode\?code\=CURRENCYRATE) but the aspect gets executed every time, even after several restarts.
i've both used IntelliJ for executing as well as mvn package and then java -jar ....
Comment From: mhalbritter
Sorry, i can now reproduce it. I have increased the concurrency of hey and now i see the stacktrace.
Comment From: mhalbritter
There's a race condition somewhere. If I start the application, then execute one request with curl, and then start the load test, it works. If i don't execute curl and start the load test right away, it breaks. And it stays broken, even if i try it with curl after stopping the load test.
Comment From: zoroglu
Additionally, I've noticed that this issue occurs more frequently when using Oracle DB, when the data already exists in the database and is not inserted during application startup. With H2, it’s much harder to reproduce and happens only occasionally. Just sharing in case it helps.
Comment From: mhalbritter
It's nearly identical, but these lines are missing in the failing case:
at org.springframework.aop.framework.ReflectiveMethodInvocation.proceed(ReflectiveMethodInvocation.java:184)
at org.springframework.aop.framework.adapter.MethodBeforeAdviceInterceptor.invoke(MethodBeforeAdviceInterceptor.java:58)
That's what we can also see on your screenshot. I think this is a bug in spring-aop somewhere.
Comment From: mhalbritter
I've also tested it with downgraded framework versions 6.2.0 - 6.2.5, and they all have the race condition.
Comment From: mhalbritter
Interestingly, Boot 3.3.10 with Spring Framework 6.2.5 doesn't fail - so I'm not 100% sure that this is a framework bug.
FTR, this is the hey command i've used:
hey -n 100000 http://localhost:8080/batch/findIdBatchByCode\?code\=CURRENCYRATE
and here's the cleaned up application which (most of the time) shows the problem:
mvn package and then java -jar target/batch-0.0.1-alpha.1.jar and then run the hey command from above. If it fails, you get a lot of stack traces showing up.
Comment From: jhoeller
I'm pretty sure this is not a race condition for aspects specifically. Are there multiple threads trying to obtain beans from the application context during bootstrap? If so, this could be a side effect of lenient locking in 6.2.
It's suspicious that Boot 3.3.10 does not fail against Framework 6.2.5 but maybe some differences in Boot just trigger lenient locking in a different way. It is also suspicious that requests reach the application context before it is fully initialized, actually.
Note that there is an upcoming revision in 6.2.6 with several lenient locking refinements (avoiding deadlocks), including a spring.locking.strict=true property that can be used to enforce pre-6.2 behavior: see https://github.com/spring-projects/spring-framework/issues/34303#issuecomment-2751847509
@mhalbritter can you reproduce this with your current setup when Boot 3.4.x runs against Framework 6.2.6 snapshot? And specifically, can you reproduce it with spring.locking.strict=true? This would narrow the potential root cause.
Comment From: jhoeller
On a related note, we also got this issue open where the Spring Boot fat jar deployer on IBM Liberty lets requests through to the application context before bootstrap has finished: https://github.com/spring-projects/spring-framework/issues/34729. While I certainly expect spring.locking.strict=true to address that scenario, it is odd that the application context is heavily hit by a request thread pool before the application is ready to begin with.
Comment From: mhalbritter
It's also reproducible with 6.2.6-SNAPSHOT and with java -Dspring.locking.strict=true -jar ....
Comment From: jhoeller
Hmm that's interesting indeed, thanks for checking.
Hard to explain then though since it seems to be an initialization problem where the aspect is either applied or not, staying that way for the lifetime of the application. So not an invocation-time race condition, rather a bootstrap-time race condition during creation of the repository beans when the container looks for applicable aspects. Maybe a circular reference resolution problem?
So is the application context hit by request threads before the application is officially ready? If yes, how can that happen? With standard .war deployment, that would be impossible as far as I'm aware. Is this different with far jar deployment?
Comment From: mhalbritter
I think the application is ready. Here are the logs and i waited like 10 seconds before starting the load test:
> java -Dspring.locking.strict=true -jar target/batch-0.0.1-alpha.1.jar

  .   ____          _            __ _ _
 /\\ / ___'_ __ _ _(_)_ __  __ _ \ \ \ \
( ( )\___ | '_ | '_| | '_ \/ _` | \ \ \ \
 \\/  ___)| |_)| | | | | || (_| |  ) ) ) )
  '  |____| .__|_| |_|_| |_\__, | / / / /
 =========|_|==============|___/=/_/_/_/

 :: Spring Boot ::                (v3.4.4)

2025-04-10T12:28:31.869+02:00  INFO 193754 --- [           main] com.example.batch.BatchApplication       : Starting BatchApplication v0.0.1-alpha.1 using Java 23.0.2 with PID 193754 (/home/mhalbritter/Downloads/issue-projects/sb-45021/target/batch-0.0.1-alpha.1.jar started by mhalbritter in /home/mhalbritter/Downloads/issue-projects/sb-45021)
2025-04-10T12:28:31.871+02:00  INFO 193754 --- [           main] com.example.batch.BatchApplication       : No active profile set, falling back to 1 default profile: "default"
2025-04-10T12:28:32.196+02:00  INFO 193754 --- [           main] .s.d.r.c.RepositoryConfigurationDelegate : Bootstrapping Spring Data JPA repositories in DEFAULT mode.
2025-04-10T12:28:32.228+02:00  INFO 193754 --- [           main] .s.d.r.c.RepositoryConfigurationDelegate : Finished Spring Data repository scanning in 28 ms. Found 1 JPA repository interface.
2025-04-10T12:28:32.556+02:00  INFO 193754 --- [           main] o.s.b.w.embedded.tomcat.TomcatWebServer  : Tomcat initialized with port 8080 (http)
2025-04-10T12:28:32.562+02:00  INFO 193754 --- [           main] o.apache.catalina.core.StandardService   : Starting service [Tomcat]
2025-04-10T12:28:32.562+02:00  INFO 193754 --- [           main] o.apache.catalina.core.StandardEngine    : Starting Servlet engine: [Apache Tomcat/10.1.39]
2025-04-10T12:28:32.581+02:00  INFO 193754 --- [           main] o.a.c.c.C.[Tomcat].[localhost].[/]       : Initializing Spring embedded WebApplicationContext
2025-04-10T12:28:32.581+02:00  INFO 193754 --- [           main] w.s.c.ServletWebServerApplicationContext : Root WebApplicationContext: initialization completed in 680 ms
2025-04-10T12:28:32.672+02:00  INFO 193754 --- [           main] o.hibernate.jpa.internal.util.LogHelper  : HHH000204: Processing PersistenceUnitInfo [name: default]
2025-04-10T12:28:32.698+02:00  INFO 193754 --- [           main] org.hibernate.Version                    : HHH000412: Hibernate ORM core version 6.6.11.Final
2025-04-10T12:28:32.714+02:00  INFO 193754 --- [           main] o.h.c.internal.RegionFactoryInitiator    : HHH000026: Second-level cache disabled
2025-04-10T12:28:32.844+02:00  INFO 193754 --- [           main] o.s.o.j.p.SpringPersistenceUnitInfo      : No LoadTimeWeaver setup: ignoring JPA class transformer
2025-04-10T12:28:32.858+02:00  INFO 193754 --- [           main] com.zaxxer.hikari.HikariDataSource       : HikariPool-1 - Starting...
2025-04-10T12:28:32.946+02:00  INFO 193754 --- [           main] com.zaxxer.hikari.pool.HikariPool        : HikariPool-1 - Added connection conn0: url=jdbc:h2:mem:demodb user=DEMO
2025-04-10T12:28:32.947+02:00  INFO 193754 --- [           main] com.zaxxer.hikari.HikariDataSource       : HikariPool-1 - Start completed.
2025-04-10T12:28:32.958+02:00  WARN 193754 --- [           main] org.hibernate.orm.deprecation            : HHH90000025: H2Dialect does not need to be specified explicitly using 'hibernate.dialect' (remove the property setting and it will be selected by default)
2025-04-10T12:28:32.970+02:00  INFO 193754 --- [           main] org.hibernate.orm.connections.pooling    : HHH10001005: Database info:
        Database JDBC URL [Connecting through datasource 'HikariDataSource (HikariPool-1)']
        Database driver: undefined/unknown
        Database version: 2.3.232
        Autocommit mode: undefined/unknown
        Isolation level: undefined/unknown
        Minimum pool size: undefined/unknown
        Maximum pool size: undefined/unknown
2025-04-10T12:28:33.355+02:00  INFO 193754 --- [           main] o.h.e.t.j.p.i.JtaPlatformInitiator       : HHH000489: No JTA platform available (set 'hibernate.transaction.jta.platform' to enable JTA platform integration)
Hibernate: drop table if exists batchtemp cascade
Hibernate: drop sequence if exists batchtemp_s
Hibernate: create sequence batchtemp_s start with 1 increment by 1
Hibernate: create table batchtemp (companyid bigint, id bigint not null, versionid bigint, code varchar(255), primary key (id))
2025-04-10T12:28:33.379+02:00  INFO 193754 --- [           main] j.LocalContainerEntityManagerFactoryBean : Initialized JPA EntityManagerFactory for persistence unit 'default'
2025-04-10T12:28:33.552+02:00  WARN 193754 --- [           main] JpaBaseConfiguration$JpaWebConfiguration : spring.jpa.open-in-view is enabled by default. Therefore, database queries may be performed during view rendering. Explicitly configure spring.jpa.open-in-view to disable this warning
2025-04-10T12:28:33.750+02:00  INFO 193754 --- [           main] .w.s.a.s.AnnotationActionEndpointMapping : Supporting [WS-Addressing August 2004, WS-Addressing 1.0]
2025-04-10T12:28:33.776+02:00  INFO 193754 --- [           main] o.s.b.w.embedded.tomcat.TomcatWebServer  : Tomcat started on port 8080 (http) with context path '/'
2025-04-10T12:28:33.783+02:00  INFO 193754 --- [           main] com.example.batch.BatchApplication       : Started BatchApplication in 2.126 seconds (process running for 2.36)
2025-04-10T12:28:33.787+02:00  INFO 193754 --- [           main] c.e.batch.aspect.TenantServiceAspect     : TenantServiceAspect.beforeExecution
Hibernate: select next value for batchtemp_s
Hibernate: select next value for batchtemp_s
Hibernate: insert into batchtemp (code,companyid,versionid,id) values (?,?,?,?)
Hibernate: insert into batchtemp (code,companyid,versionid,id) values (?,?,?,?)
You can even see the first invocation of the TenantServiceAspect at 2025-04-10T12:28:33.787+02:00.
The hibernate SQL statements come from the CommandLineRunner which add two entries into the table.
Comment From: jhoeller
Ok, so even with such a long delay after bootstrap, the problem shows when the load test kicks in immediately - but not when the request code path has been warmed up by an individual request before. Hmm, is any affected bean marked as lazy-init here? Is Spring Data JPA doing any lazy initialization? Otherwise I'm out of explanations since it seems to be a persistent problem with the aspect not applied to the given bean for the lifetime of the application - that only makes sense when the race condition interferes during the initialization of a lazy-init singleton bean then.
Comment From: mhalbritter
It could well be that this is a Spring Data problem. Would also explain why Boot 3.3.10 works with 6.2.5 Framework.
When the first request hits, I just see this in the logs:
2025-04-10T12:36:41.973+02:00  INFO 199845 --- [io-8080-exec-50] o.a.c.c.C.[Tomcat].[localhost].[/]       : Initializing Spring DispatcherServlet 'dispatcherServlet'
2025-04-10T12:36:41.973+02:00  INFO 199845 --- [io-8080-exec-50] o.s.web.servlet.DispatcherServlet        : Initializing Servlet 'dispatcherServlet'
2025-04-10T12:36:41.974+02:00  INFO 199845 --- [io-8080-exec-50] o.s.web.servlet.DispatcherServlet        : Completed initialization in 0 ms
I'll try to get better logging.
Comment From: mhalbritter
Those are the lazy beans in the context:
Lazy bean: applicationTaskExecutor
Lazy bean: mvcHandlerMappingIntrospector
Lazy bean: emBeanDefinitionRegistrarPostProcessor
Lazy bean: jpaMappingContext
Lazy bean: jpaContext
Lazy bean: restTemplateBuilderConfigurer
Lazy bean: restTemplateBuilder
Lazy bean: jpaSharedEM_AWC_entityManagerFactory
Comment From: jhoeller
Hmm according to those request-initiated logs, the DispatcherServlet is not initialized on startup? It should usually be load-on-startup, shouldn't it? Tomcat should block the request(s) until the Servlet is initialized in any case but that increases the problem area.
Comment From: mhalbritter
Yeah, that's the case for every Spring Boot application.
Initializing Spring DispatcherServlet 'dispatcherServlet'
only appears when doing the 1st request.
Comment From: mhalbritter
I disabled the lazy flag on the beans using this code:
  @Bean
  static BeanFactoryPostProcessor beanFactoryPostProcessor() {
      return (beanFactory) -> {
          for(String beanDefName: beanFactory.getBeanDefinitionNames()) {
              BeanDefinition beanDef = beanFactory.getBeanDefinition(beanDefName);
              if (beanDef.isLazyInit()) {
                  System.out.println("Disabling lazy on bean: " + beanDefName);
                  beanDef.setLazyInit(false);
              }
          }
      };
  }
but the problem persists.
Comment From: jhoeller
Is there a specific reason why Boot initializes the DispatcherServlet lazily? In a good old web.xml setup, those were always marked as load-on-startup. I see no reason why we couldn't do that in a standard Boot app as well.
In any case, it's worth testing with that DispatcherServlet Servlet registration marked as load-on-startup (even if that has to be patched in Boot). A first individual request has the same effect of initializing the DispatcherServlet, so this would explain the behavior that we are seeing. The load test with its 100000 threads forces Tomcat to block everything until the DispatcherServlet is initialized (exposing it to race conditions) which seems like a shame if that could easily have happened on startup.
Comment From: mhalbritter
I don't know the reason why this isn't the default, but you can easily change that by setting a property:
spring.mvc.servlet.load-on-startup=0
we can now see that the servlet is initialized while starting up:
2025-04-10T14:52:46.687+02:00  INFO 286028 --- [           main] .w.s.a.s.AnnotationActionEndpointMapping : Supporting [WS-Addressing August 2004, WS-Addressing 1.0]
2025-04-10T14:52:46.711+02:00  INFO 286028 --- [           main] o.a.c.c.C.[Tomcat].[localhost].[/]       : Initializing Spring DispatcherServlet 'dispatcherServlet'
2025-04-10T14:52:46.711+02:00  INFO 286028 --- [           main] o.s.web.servlet.DispatcherServlet        : Initializing Servlet 'dispatcherServlet'
2025-04-10T14:52:46.712+02:00  INFO 286028 --- [           main] o.s.web.servlet.DispatcherServlet        : Completed initialization in 1 ms
2025-04-10T14:52:46.712+02:00  INFO 286028 --- [           main] o.s.b.w.embedded.tomcat.TomcatWebServer  : Tomcat started on port 8080 (http) with context path '/'
2025-04-10T14:52:46.719+02:00  INFO 286028 --- [           main] com.example.batch.BatchApplication       : Started BatchApplication in 2.091 seconds (process running for 2.316)
However, this doesn't fix that problem either. It's still occuring :/
// Edit: This issue is discussing dispatcherservlet load on startup. Seems like -1 is just the default in servlet API.
Comment From: jhoeller
Ugh :-( Then I'm out of educated guesses, I'm afraid.
So to summarize: An individual request warms it up properly but an initial load of 100000 requests breaks it, and it's not a temporary failure but rather the permanent absence of that aspect for the lifetime of the application. Something must trigger the lazy initialization of a repository bean without us realizing it, otherwise that permanent absence of the aspect is not explainable.
In terms of further debugging: There must be a difference in application state before and after that initial warm-up request that makes the aspect applying to that repository bean. We need to track down what that difference is and how it is being created.
Comment From: mhalbritter
Thanks for taking a look @jhoeller.
Yes, that summarizes it nicely. Although the -n from hey is not concurrent threads, but requests in total. The concurrency is, if not set with -c, 50.
And it works with Boot 3.3.x and started breaking with 3.4.x.
@mp911de any ideas?
Comment From: jhoeller
Ah yes, good point. A concurrency level of 50 is pretty high in any case, and somehow able to trigger a race condition that otherwise remains unnoticed.
The key question is how and when that aspect is being applied to that repository bean. There must be some laziness involved in the initialization there, otherwise it couldn't be exposed to that concurrency race condition and result in permanent application state.
Comment From: sbrannen
Potentially related to:
-
34563
Comment From: msievers
@jhoeller Even though I cannot say for certain that it is related to the issue here, we observed strange behavior today with one of our applications where a security-relevant aspect, which should protect the execution of a method, was not called on one of several instances. I was able to connect to all instances of the application via the debugger and can see in the stack trace that on one instance the authorization-relevant aspect is not called, while it is called as expected on other instances.
According to our testing department, authorization-related errors seem to occur sporadically since a few months, which would generally coincide with the dependency upgrades to Spring Boot 3.4.
What I want to say with this is that if there is a currently unresolved problem with aspects in Spring, then this can have security-relevant consequences in the worst case, for example, if people rely on aspects to protect certain execution paths in the code.
Against this background, these aspect-related problems should be investigated with high priority.
Unfortunately, I cannot currently identify a real trigger on our end. We have been seeing the mentioned faulty behavior for some time in the context of automated tests, which probably send a large number of requests to the application in a short period of time. However, that is the only parallel I can see to this issue here.
Comment From: otbe
We can see the same behaviour with SB 3.4.5 (but most likely also earlier versions). An aspect that should trigger the execution of another method is not being executed on one out of three instances in a production deployment of the same version. Rotating the affected container(s) solves this issues most of the times. In our case that aspect is triggered within a controller method when invoking a service bean method (around aspect for this method). Theres no Spring Data involved here.
Comment From: bpavin
Hi, we got the same problem in our application, after spring boot application is running, hitting endpoints in parallel can reproduce this problem.
Enabling this debugging log:
<logger name="org.springframework.aop.aspectj.AspectJExpressionPointcut" level="DEBUG" />
revealed this error:
2025-05-29 11:37:33,935 DEBUG [service-executor-4] o.s.a.a.AspectJExpressionPointcut - PointcutExpression matching rejected target method java.lang.NullPointerException: Cannot invoke "org.aspectj.weaver.ResolvedMember.matches(org.aspectj.weaver.ResolvedMember, boolean)" because "candidate" is null at org.aspectj.weaver.ResolvedType.lookupResolvedMember(ResolvedType.java:650) at org.aspectj.weaver.JoinPointSignatureIterator.findSignaturesFromSupertypes(JoinPointSignatureIterator.java:192) at org.aspectj.weaver.JoinPointSignatureIterator.findSignaturesFromSupertypes(JoinPointSignatureIterator.java:238) at org.aspectj.weaver.JoinPointSignatureIterator.findSignaturesFromSupertypes(JoinPointSignatureIterator.java:229) at org.aspectj.weaver.JoinPointSignatureIterator.hasNext(JoinPointSignatureIterator.java:68) at org.aspectj.weaver.patterns.SignaturePattern.matches(SignaturePattern.java:317) at org.aspectj.weaver.patterns.KindedPointcut.matchInternal(KindedPointcut.java:202) at org.aspectj.weaver.patterns.Pointcut.match(Pointcut.java:137) at org.aspectj.weaver.patterns.KindedPointcut.findResidueInternal(KindedPointcut.java:454) at org.aspectj.weaver.patterns.Pointcut.findResidue(Pointcut.java:260) at org.aspectj.weaver.patterns.OrPointcut.findResidueInternal(OrPointcut.java:111) at org.aspectj.weaver.patterns.Pointcut.findResidue(Pointcut.java:260) at org.aspectj.weaver.patterns.AndPointcut.findResidueInternal(AndPointcut.java:101) at org.aspectj.weaver.patterns.Pointcut.findResidue(Pointcut.java:260) at org.aspectj.weaver.patterns.AndPointcut.findResidueInternal(AndPointcut.java:101) at org.aspectj.weaver.patterns.Pointcut.findResidue(Pointcut.java:260) at org.aspectj.weaver.internal.tools.PointcutExpressionImpl.getShadowMatch(PointcutExpressionImpl.java:323) at org.aspectj.weaver.internal.tools.PointcutExpressionImpl.matchesExecution(PointcutExpressionImpl.java:129) at org.aspectj.weaver.internal.tools.PointcutExpressionImpl.matchesMethodExecution(PointcutExpressionImpl.java:110) at org.springframework.aop.aspectj.AspectJExpressionPointcut.getShadowMatch(AspectJExpressionPointcut.java:476) at org.springframework.aop.aspectj.AspectJExpressionPointcut.getTargetShadowMatch(AspectJExpressionPointcut.java:466) at org.springframework.aop.aspectj.AspectJExpressionPointcut.matches(AspectJExpressionPointcut.java:349) at org.springframework.aop.framework.ReflectiveMethodInvocation.proceed(ReflectiveMethodInvocation.java:172) at org.springframework.aop.aspectj.MethodInvocationProceedingJoinPoint.proceed(MethodInvocationProceedingJoinPoint.java:89) at aop.exception.handling.ExceptionHandlingAspect.invoke(ExceptionHandlingAspect.java:91) at java.base/jdk.internal.reflect.DirectMethodHandleAccessor.invoke(DirectMethodHandleAccessor.java:103) at java.base/java.lang.reflect.Method.invoke(Method.java:580) at org.springframework.aop.aspectj.AbstractAspectJAdvice.invokeAdviceMethodWithGivenArgs(AbstractAspectJAdvice.java:642) at org.springframework.aop.aspectj.AbstractAspectJAdvice.invokeAdviceMethod(AbstractAspectJAdvice.java:632) at org.springframework.aop.aspectj.AspectJAroundAdvice.invoke(AspectJAroundAdvice.java:71) at org.springframework.aop.framework.ReflectiveMethodInvocation.proceed(ReflectiveMethodInvocation.java:184) at org.springframework.aop.aspectj.MethodInvocationProceedingJoinPoint.proceed(MethodInvocationProceedingJoinPoint.java:89) at aop.audit.MDCCleanerAspect.invoke(MDCCleanerAspect.java:26) at java.base/jdk.internal.reflect.DirectMethodHandleAccessor.invoke(DirectMethodHandleAccessor.java:103) at java.base/java.lang.reflect.Method.invoke(Method.java:580) at org.springframework.aop.aspectj.AbstractAspectJAdvice.invokeAdviceMethodWithGivenArgs(AbstractAspectJAdvice.java:642) at org.springframework.aop.aspectj.AbstractAspectJAdvice.invokeAdviceMethod(AbstractAspectJAdvice.java:632) at org.springframework.aop.aspectj.AspectJAroundAdvice.invoke(AspectJAroundAdvice.java:71) at org.springframework.aop.framework.ReflectiveMethodInvocation.proceed(ReflectiveMethodInvocation.java:184) at org.springframework.aop.interceptor.ExposeInvocationInterceptor.invoke(ExposeInvocationInterceptor.java:97) at org.springframework.aop.framework.ReflectiveMethodInvocation.proceed(ReflectiveMethodInvocation.java:184) at org.springframework.aop.framework.CglibAopProxy$DynamicAdvisedInterceptor.intercept(CglibAopProxy.java:728) ...
after this exception, aspect stops working. Probably because this line caches shadowMatch that always returns false, so every new aspect match will hit this cache and skip shadowMatch evaluation, this is probably the reason why aspect stays in the "corrupted" state and is always skipped.
I found this change set which maybe caused this problem.
Can someone who is more familiar with springframework check this out please.
Comment From: jhoeller
@bpavin this looks like a potential cause indeed: a race condition in AspectJ ShadowMatch cache handling, caused by our revised caching in 6.2 - and for some reason falling into a workaround for an old AspectJ bug ("PointcutExpression matching rejected target method") which silently swallows the exception and unfortunately skips the affected aspect. Thanks for digging into it so deeply!
@msievers @otbe we are aiming to resolve this for next week's 6.2.8 release. If you could confirm that the same debug log message happens in your scenario as well, that would help to focus our efforts accordingly.
Comment From: jhoeller
As far as I can tell, this is caused by ShadowMatch caching effectively being static now whereas it was bound to AspectJExpressionPointcut instances before, getting cleaned up when those pointcut instance were GC'ed. The static cache in ShadowMatchUtils is being cleared after startup and on shutdown but that's not guaranteed, so depending on the restart scenario, there could be old content in there that fails to evaluate against the current state of the application.
Comment From: msievers
@jhoeller I tried to set logging.level.org.springframework.aop.aspectj.AspectJExpressionPointcut at runtime for an application where I can currently observe the faulty behavior in production, but I am not seeing any corresponding logs there.
However, I am running it with debugging enabled, i.e., -agentlib:jdwp=transport=dt_socket,server=y,suspend=n,address=*:5005, meaning I could also take a look in other ways.
Currently, after about one and a half days, the application consistently shows the mentioned behavior where a certain aspect does not take effect.
Should I use the debugger to check for something specific here?
Comment From: bpavin
@msievers exception in debug log is shown only after application restart, when aspect's shadowMatch is first evaluated. You won't see exception after that, because shadowMatch will be always read from cache on subsequent aspect's executions.
Comment From: jhoeller
@msievers indeed, this will only show once right on restart when matching the aspect against the singleton bean. You could put a debugger breakpoint in AspectJExpressionPointcut:518 to observe the catch block, but even that will only happen once on restart.
https://github.com/zoroglu/batch?tab=readme-ov-file#interesting-observation shows an exception in that catch block as well, slightly different but also caused by a null handle having been encountered within the ShadowMatch instance. I'm pretty sure that's where the problem is in your scenario as well.
Also worth trying for narrowing the problem: You may call org.springframework.aop.aspectj.ShadowMatchUtils.clearCache() before the restart. Assuming that the restart happens within the same JVM, this would make sure that no stale ShadowMatch instances are being encountered on restart (which is a likely cause for our problem here).
Comment From: bpavin
@jhoeller maybe relevant: here the synchronized block was removed that probably protected against possible race condition, but I don't know if we want it back?
Comment From: jhoeller
@bpavin good point, this may also be a race condition within AspectJ's matching infrastructure that we are uncovering through hitting it concurrently (and then ignoring the re-built ShadowMatch instances). Aside from stale ShadowMatch instances on restart, that's actually an even more likely cause.
Comment From: lgp547
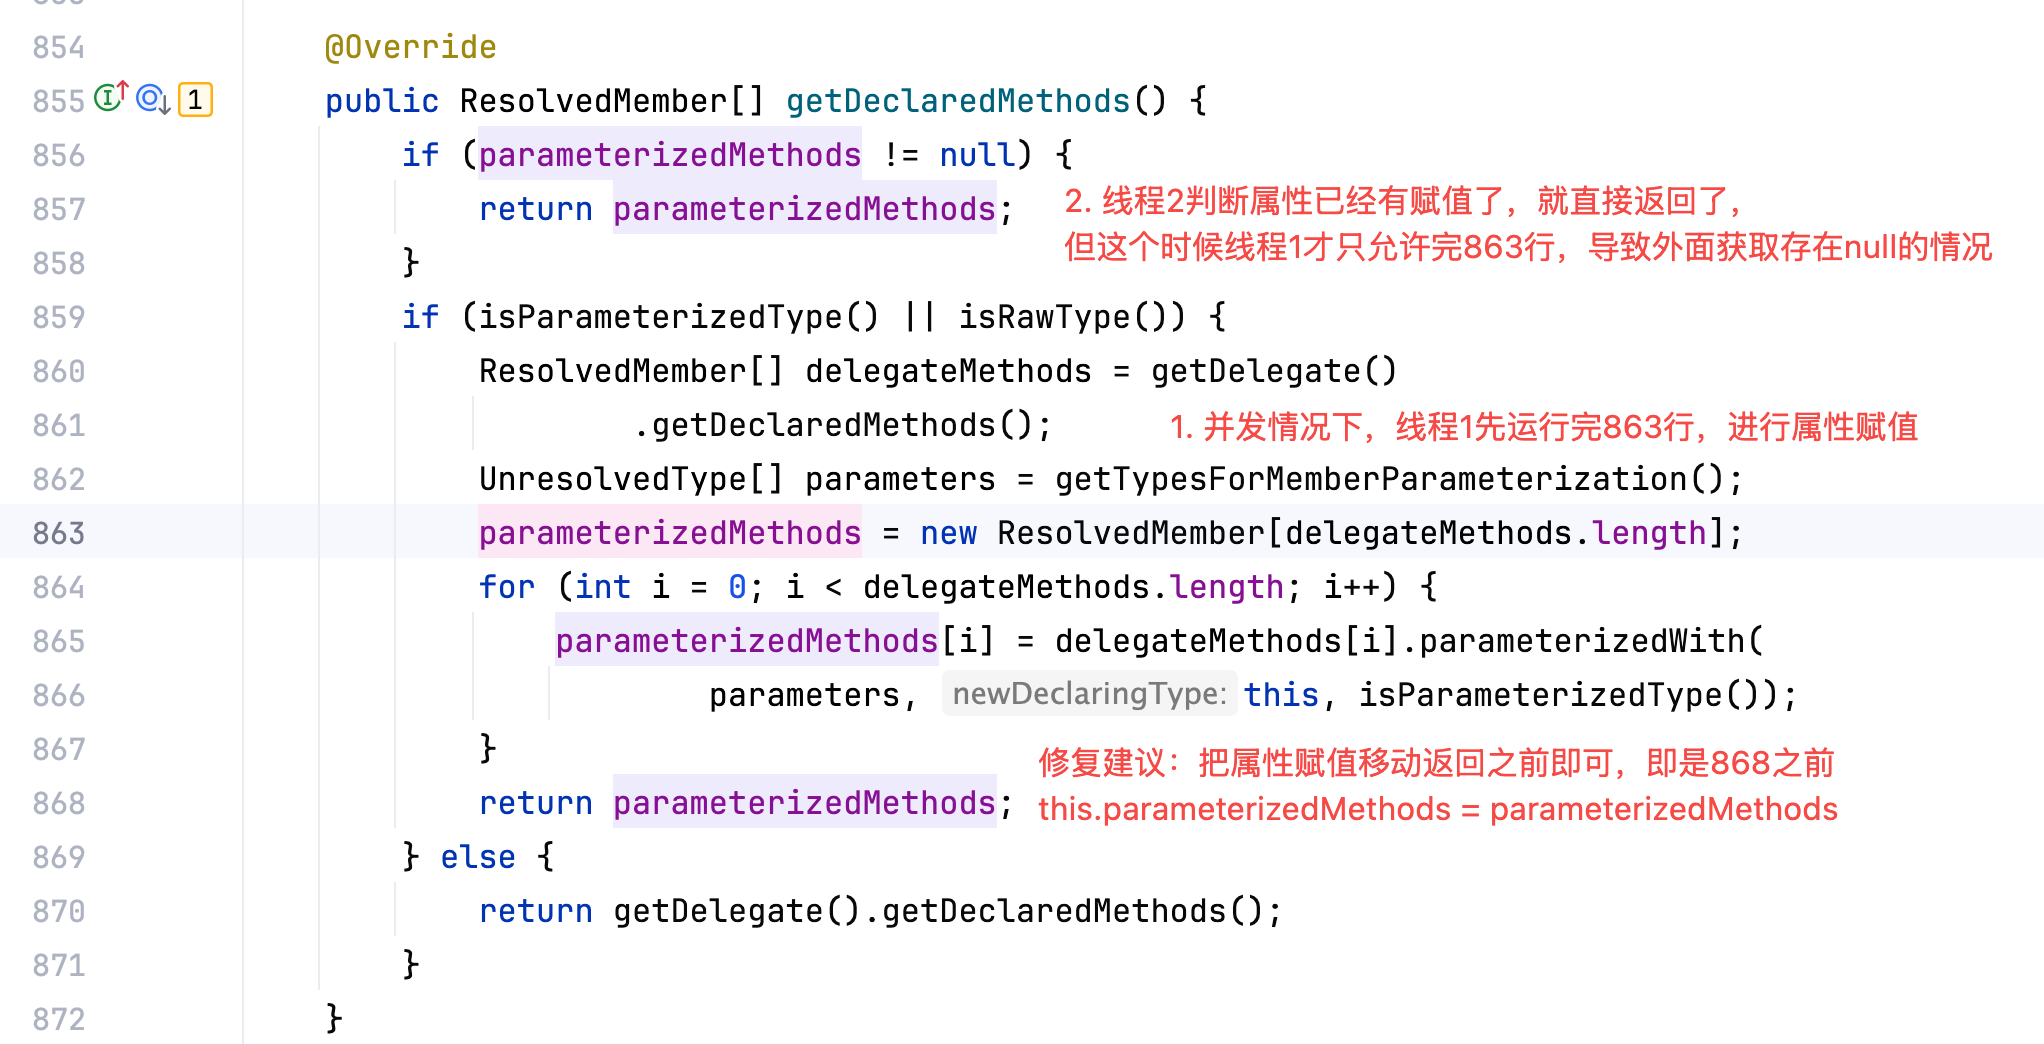
我也遇到了一样的问题,偶发的切面失效,定位到返回的是ShadowMatchImpl里的residualTest是null,说明是getShadowMatch出异常了,打开了org.springframework.aop.aspectj.AspectJExpressionPointcut的debug,拿到了一样的空指针报错,然后找到本问题这里。
我拉了https://github.com/zoroglu/batch进行本地复现,确实在启动的时候并发请求进来就会有" because "candidate" is null 问题,通过增加日志,定位到ReferenceType.getDeclaredMethod()并发出问题。 过程:看图片文字说明
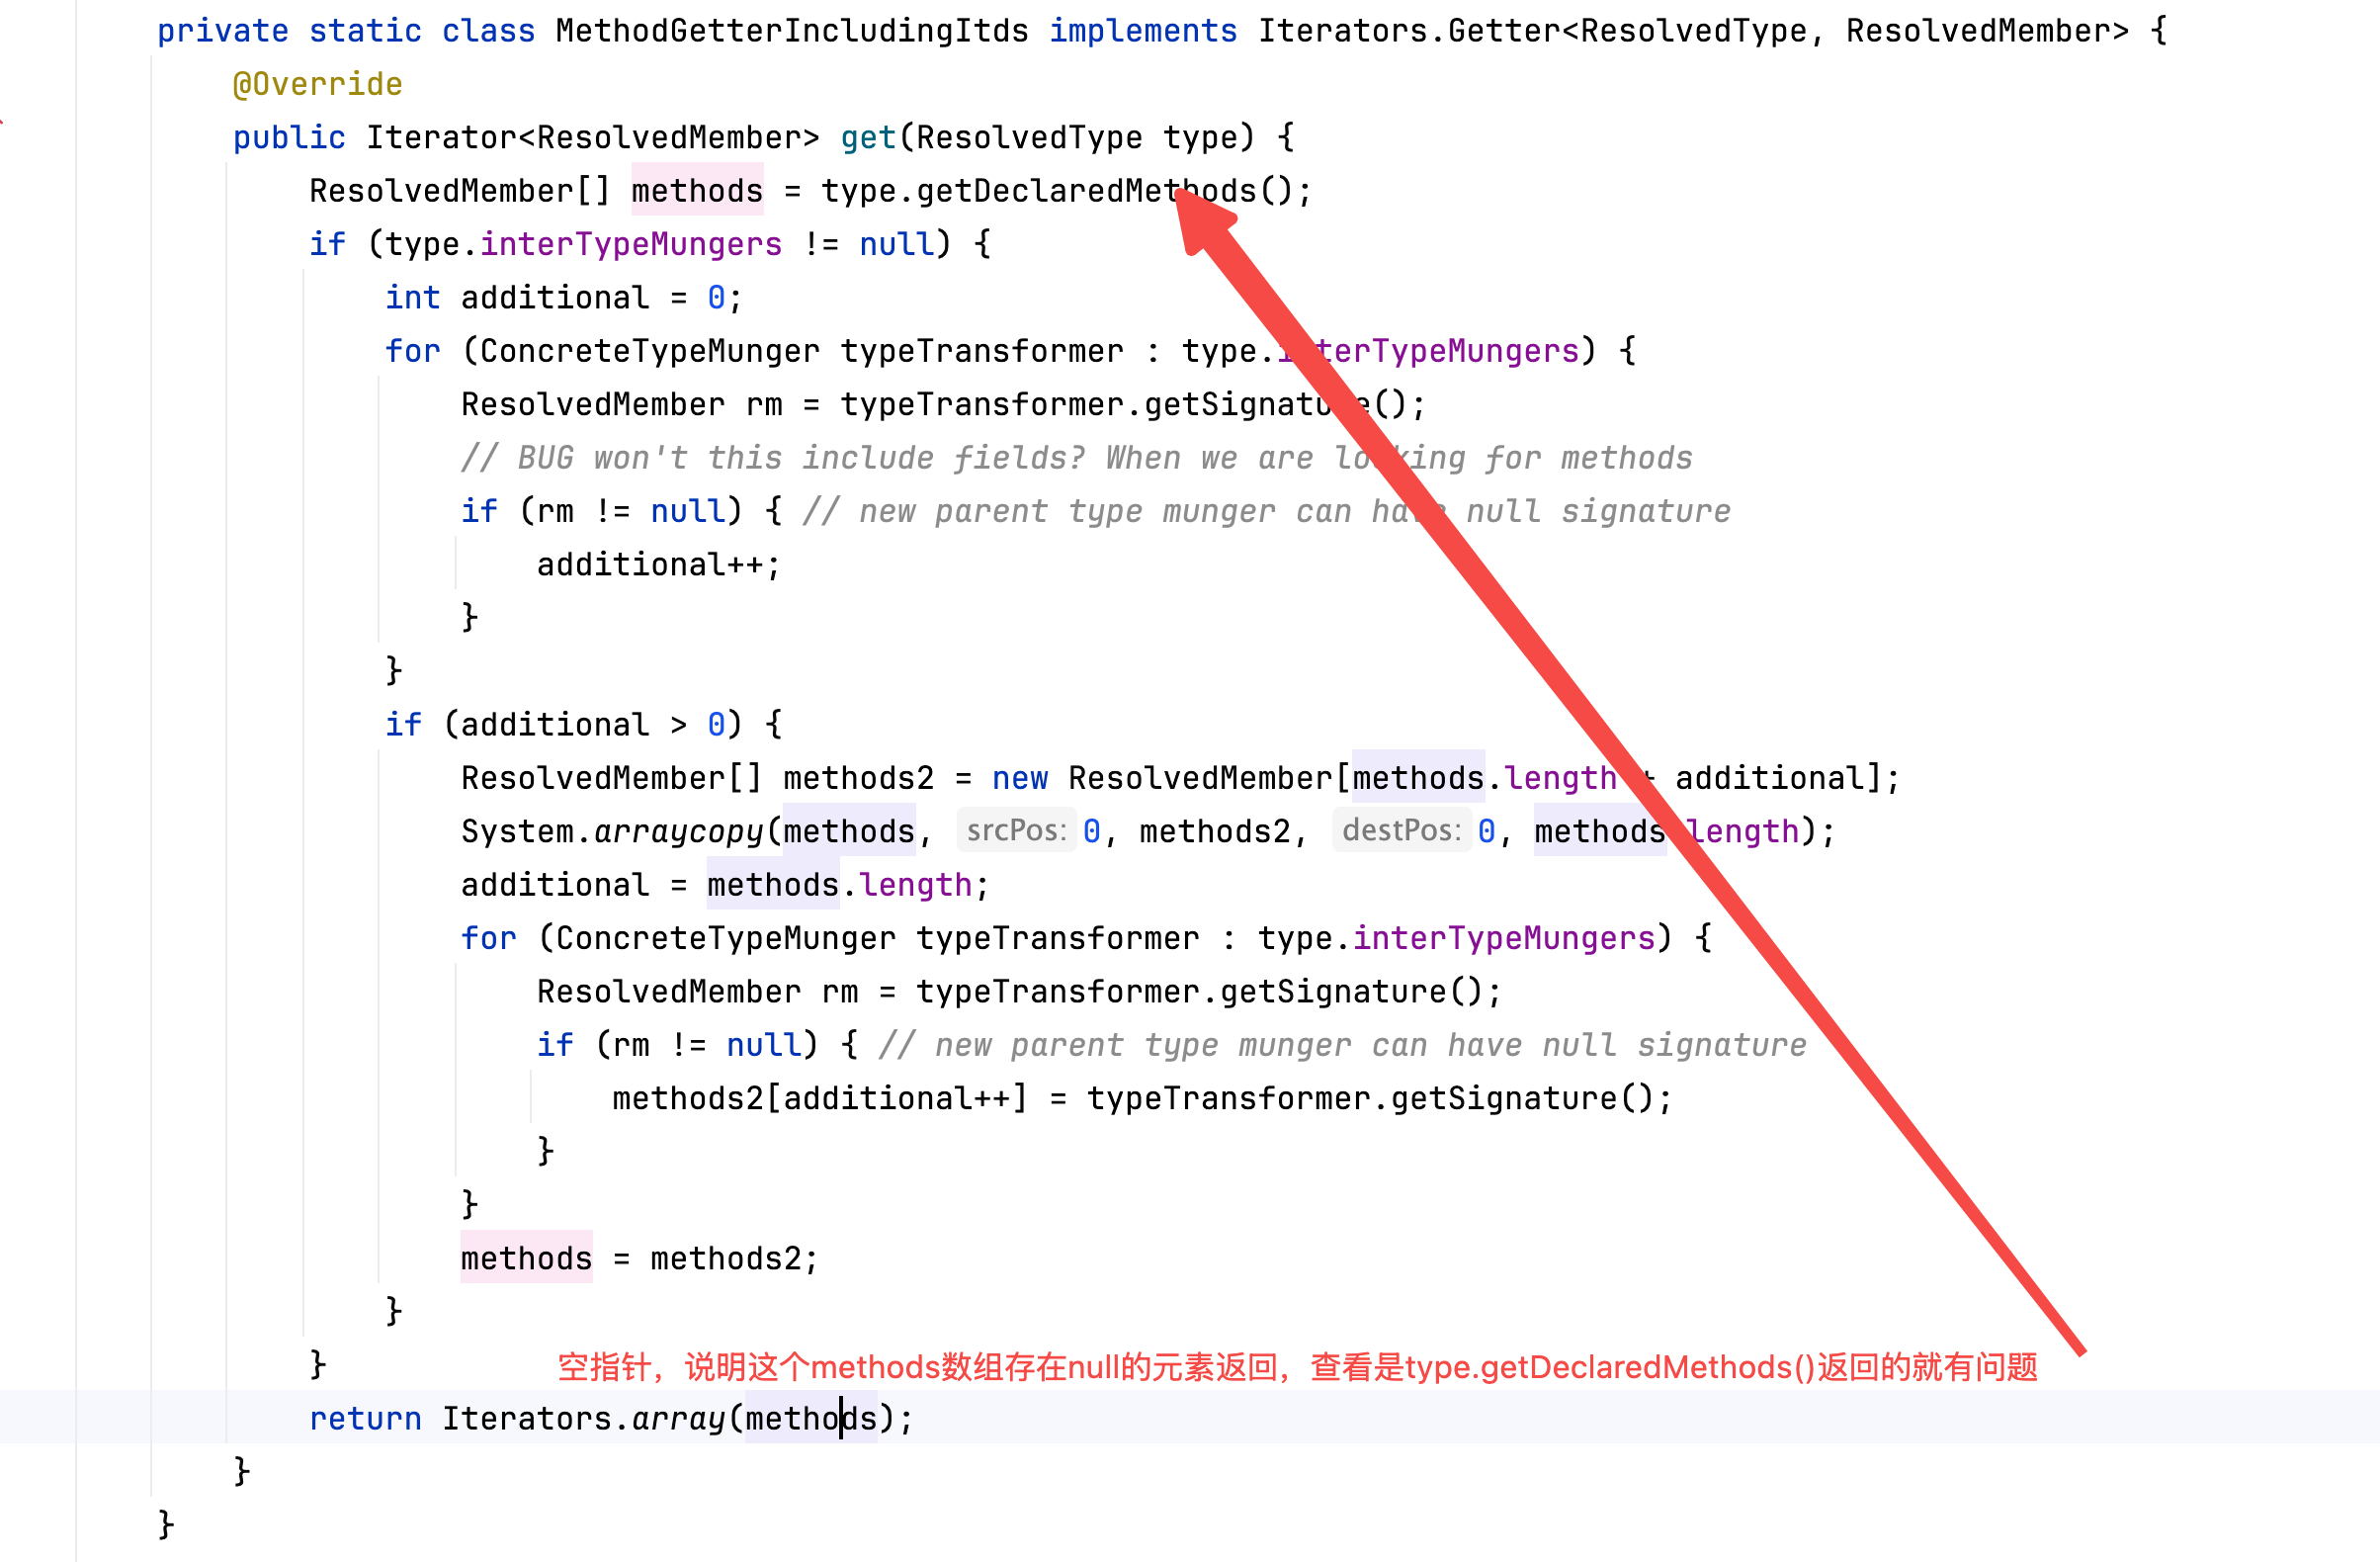
Comment From: jhoeller
@lgp547 good catch, it looks like that ReferenceType.getDeclaredMethods() implementation in AspectJ is not thread-safe for parameterized methods since it initializes the parameterizedMethods array first and then assigns each element in a loop - which leaves a race condition where the initialized array may be accessed by other threads which might see null elements then. That aside, there seems to be no volatile marker or synchronized guard either. This should be reported to the AspectJ project but I'm not sure how long it will take them to revise this.
In any case, I'll restore a degree of locking for adding entries to Spring's ShadowMatch cache for 6.2.8, for defensiveness against concurrency issues in AspectJ's current implementation. I expect this to resolve the problem in all scenarios reported here.
Comment From: jhoeller
@msievers @bpavin @lgp547 a revision is available in the latest 6.2.8 snapshot now, synchronizing on the AspectJ PointcutExpression instance itself (where the actual AspectJ race condition is hidden). Please give it a try in your scenario before the 6.2.8 release (scheduled for Thursday next week)...
Comment From: bpavin
@jhoeller I tested the snapshot, and I am no longer able to reproduce the issue, so we can consider it fixed. Thank you for the help and fast fix.
Comment From: jhoeller
@bpavin great to hear, thanks for the immediate testing!